5.4 Why do we need an off-sample test
Author: 善, Created: 2019-05-10 09:13:53, Updated:Summary
In the previous section, we showed you how to read the strategy backtesting performance report by focusing on several important performance indicators. In fact, it is not hard to write a strategy that making profit in the backtesting performance report. It is difficult to evaluate whether this strategy will continue to be effective in the real-market in the future. So today I will explain the off-sample test and the importance of it.
Backtesting is not equal to the real-market
Many beginners are easily convinced of their trading strategies and are ready to put their thoughts into practice with a performance report or fund curve that looks good. Admittedly, this backtesting result fits perfectly with the certain state of a market they observed, but once the trading strategy is put into a long-term battle, they will find that the strategy is actually not effective.
I have seen many trading strategies, and the success rate can reach up to 50% when backtesting. Under the premise of such a high winning rate, there is still have a higher ratio of profit and loss of 1:1. However, once these strategies are put into practice, they are all losing money. There are many reasons for this. Among these reasons, the data sample is too small is the major one, which leads to the deviation of the data .
However, the trading is such a tangled thing, and it is very clear afterwards, but if we return to the original, we still feel overwhelmed. This involves the root cause of quantification - the limitations of historical data. so, if we only use limited historical data to test the trading strategy, it is difficult to avoid the problem of “Driving according to looking at the rearview mirror”.
What is an off-sample test?
How to make full use of limited data to scientifically test the trading strategy when data is limited ? The answer is the off-sample test method. During the backtesting, the historical data is divided into two segments according to the time sequence. The previous segment of data is used for strategy optimization, called the training set, and the latter segment of data is used for the off-sample test, called the test set.
If your strategy is always valid, then optimize several sets of best parameters in the training set data, and apply these sets of parameters to the test set data to backtest again. Ideally, the backtest results should be almost the same with the training sets, or the difference is within a reasonable range. Then it can be say that this strategy is relatively effective.
But if a strategy performs well in the training set, but the test set performs poorly, or changes a lot, and when used other parameters are sitll the same, then the strategy may have data migration bias.
For example, suppose you want to backtest commodity futures rebar. Now that rebar has data for about 10 years (2009~2019), you can use the data from 2009 to 2015 as a training set, from 2015 to 2019, used as a test set. If the best parameter set in the training set is (15, 90), (5, 50), (10, 100)… then we put these sets of parameters into the test set. By comparing these two backtest performance reports and fund curves determine whether their difference is within a reasonable range.
If you do not use the off-sample test, just directly use the data from 2009 to 2019 to test the strategy. The result may be a good backtest performance report because of over-fitting the historical data, but such backtest results have little meaning for the real market and have no guiding effect, especially those strategies with more parameters.
Advanced off-sample test
As mentioned above, under the premise of lack of historical data, it is a good idea to divide the data into two parts to form data within and off-sample. But if you can take a recursive test and a cross-check test, it might be even better.
The basic principle of the recursive test: use the previous long historical data to train the model, and then use the relatively short data to test the model, and then continuously move the time window to retrieve the data, repeat the steps of training and testing.
Training data: 2000 to 2001, test data: 2002;
Training data: 2001 to 2002, test data: 2003;
Training data: 2002 to 2003, test data: 2004;
Training data: 2003 to 2004, test data: 2005;
Training data: 2004 to 2005, test data: 2006;
…and so on…
Finally, the test results (2002, 2003, 2004, 2005, 2006…) were statistically analyzed to comprehensively evaluate the performance of the strategy.
The following diagram can explain the principle of the recursive test intuitively:
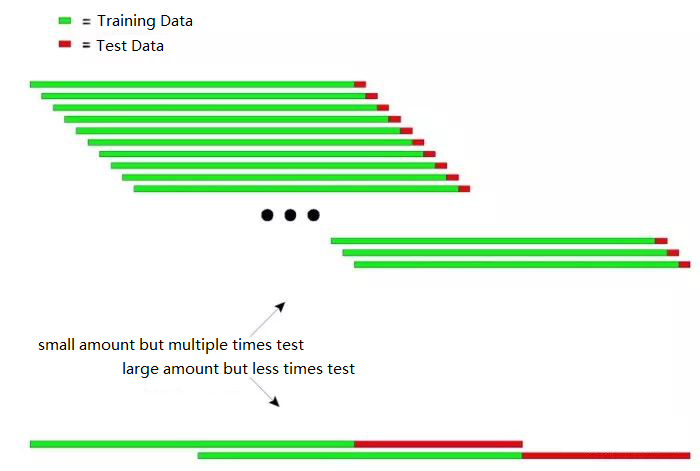
The above figure shows two methods of recursive testing.
The first type: small amount but multiple times test
The second type: large amount but less times test
In practical applications, multiple tests can be performed by changing the length of the test data to determine the stability of the model in response to non-stationary data.
The basic principle of cross-checking test: divide all the data into N parts, use N-1 parts to train each time, and use the remaining part to test.
From 2000 to 2003, it is divided into four parts according to the annually division. The operation of the cross-check test is as follows:
Training data: 2001-2003, test data: 2000;
Training data: 2000-2002, test data: 2003;
Training data: 2000, 2001, 2003, test data: 2002;
Training data: 2000, 2002, 2003, test data: 2001;
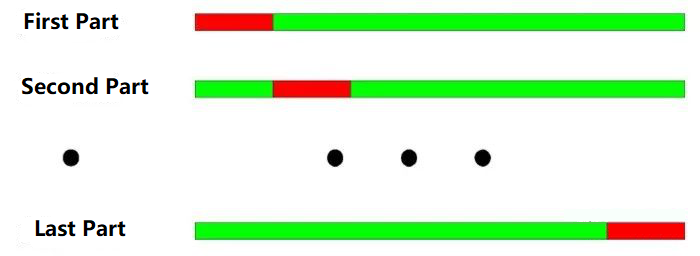
As shown in the figure above: The biggest advantage of the cross-check test is to make full use of the limited data, and each training data is also the test data. However, there are also obvious shortcomings when cross-checking is applied to the backtest:
When the price data is not stable, the test results of the model are often unreliable. For example, use the 2008 data for training and the 2005 data for testing. It is very likely that the market environment in 2008 has changed a lot compared to 2005, so the results of the model tests are not credible.
Similar to the first one, in the cross-check test, if the model is trained with the latest data and the model is tested with older data, this is not very logical in itself.
In addition, when testing the quantitative strategy model, both the recursive test and the cross-check test have encountered data overlap problems.
When developing a trading strategy model, most of the technical indicators are based on historical data of a certain period. For example, using trend indicators to calculate historical data for the past 50 days, but for the next trading day, which is again calculated from the data for the first 50 days of the trading day, the data for calculating the two indicators is the same for 49 days. This will result in a very insignificant change in the indicator for each adjacent two days.
Data overlap can have the following effects:
The slow change in the results predicted by the model leads to a slow change in positions, which is the hysteresis of the indicators we often say.
Some statistical values for the test of the model results are not available. Due to the sequence correlation caused by repeated data, the results of some statistical tests are not reliable.
A good trading strategy should be profitable in the future. off-sample testing, in addition to objectively detecting trading strategies, is more efficient in saving time for quantitative traders. In most cases, it is very dangerous to use the optimal parameters of all the samples directly.
If all the historical data before the time point for parameter optimization is distinguished, and the data is divided into the data in the sample and the data outside the sample, the parameter is optimized by using the data in the sample, and then the sample outside the sample is used for the off-sample test. The error will be detected, and at the same time it can be tested whether the optimized strategy is suitable for the future market.
To sum up
Just like the trading itself, we can never go back time and make a correct decision for ourselves. If you have the ability to time travel, you wouldn’t need to do trading at all. after all, we are all mortals, we must verify our strategy in the historical data.
However, even with the huge history data, in front of the endless and unpredictable future, history is extremely scarce. Therefore, the trading system based on history will eventually sink over time. Because history cannot exhaust the future. Therefore, a complete positive expectation trading system must be supported by its inherent principles and logic.
“Trust, but verify.” - President Reagan
After-school exercises
What are the phenomena in real life that are Survivor biases?
Use the FMZ Quant platform to compare the in and off-sample backtest.
- 何时能添加抹茶交易所
- 手机上通过终端模拟器装linux托管者的时候,最后显示bad system call可能是什么原因啊?
- 请问GetDepth返回的深度的数量可以调整么?
- 怎么把机器人部署到本地,win或者mac
- 添加火币期货交易所的时候出错。
- 管理员能否提供Deribit的wss连接代码
- BitMax 使用汇总
- 请问可视化编程如何记录最高价
- 有办法同时拿到多个数字货币对的报价吗?套利时需要快速扫描多个货币对的报价。
- 5.5 Trading strategy optimization
- 5.3 How to read the strategy backtest performance report
- FAQ
- 请问数字货币回测中,如果模拟tick的底层周期是1分钟,每分钟会能模拟出几个tick数据?
- FMZ量化平台一些值得学习的比特币及数字货币量化策略
- 5.2 How to do quantitative trading backtesting
- 请问数字货币策略回测中,撮合方式是以当前bar的收盘还是下一根bar的开盘?
- 请问数字货币策略回测中,开平仓的交易量不大,为什么经常会不能成交,仓位冻结FrozenAmount > 0
- 5.1 The meaning and trap of backtesting
- 4.6 How to implement strategies in C++ language
- 还有个关于ema的 问题