An Essential Tool in the Field of Quantitative Trading - FMZ Quant Data Exploration Module
Author: FMZ~Lydia, Created: 2024-02-26 13:39:28, Updated: 2024-06-24 17:47:55
In today’s fiercely competitive financial market, quantitative trading, as a trading strategy based on data analysis and algorithmic models, is becoming an increasingly favored choice for investors and traders. In the field of quantitative trading, the value of data is becoming increasingly prominent. Therefore, an efficient and reliable quantitative data exploration tool has become an indispensable key to achieving successful transactions.
In this era where data-driven decision-making is increasingly valued, the FMZ Quant data exploration module has emerged. As one of the essential tools in the field of quantitative trading, it is not only an ordinary data analysis software, but also a revolutionary innovation that provides investors with unique data analysis and mining functions, helping them seize opportunities and reduce risks in complex and ever-changing financial markets.
FMZ Quant, as a professional quantitative trading platform, is supported by numerous quantitative trading tools. At present, the “Data Exploration” module of the FMZ Quant Trading Platform has integrated the services of the datadata platform, giving users more advantages in multidimensional data analysis, mining visual data, exploring trading strategies, and other aspects. FMZ’s self-developed datadata platform is a quantitative financial data platform. Using SQL queries to analyze massive amounts of data and configuring them through visual interfaces, generating various charts suitable for data analysis and sharing them with the team, allowing us to easily grasp market trends and seize investment opportunities!
FMZ Quant Data Exploration Module
First of all, let’s familiarize with the FMZ Quant Data Exploration module, which is used just like on datadata. For each FMZ platform user, we don’t need to register for the datadata platform again, and we can use all the features of the datadata platform directly.
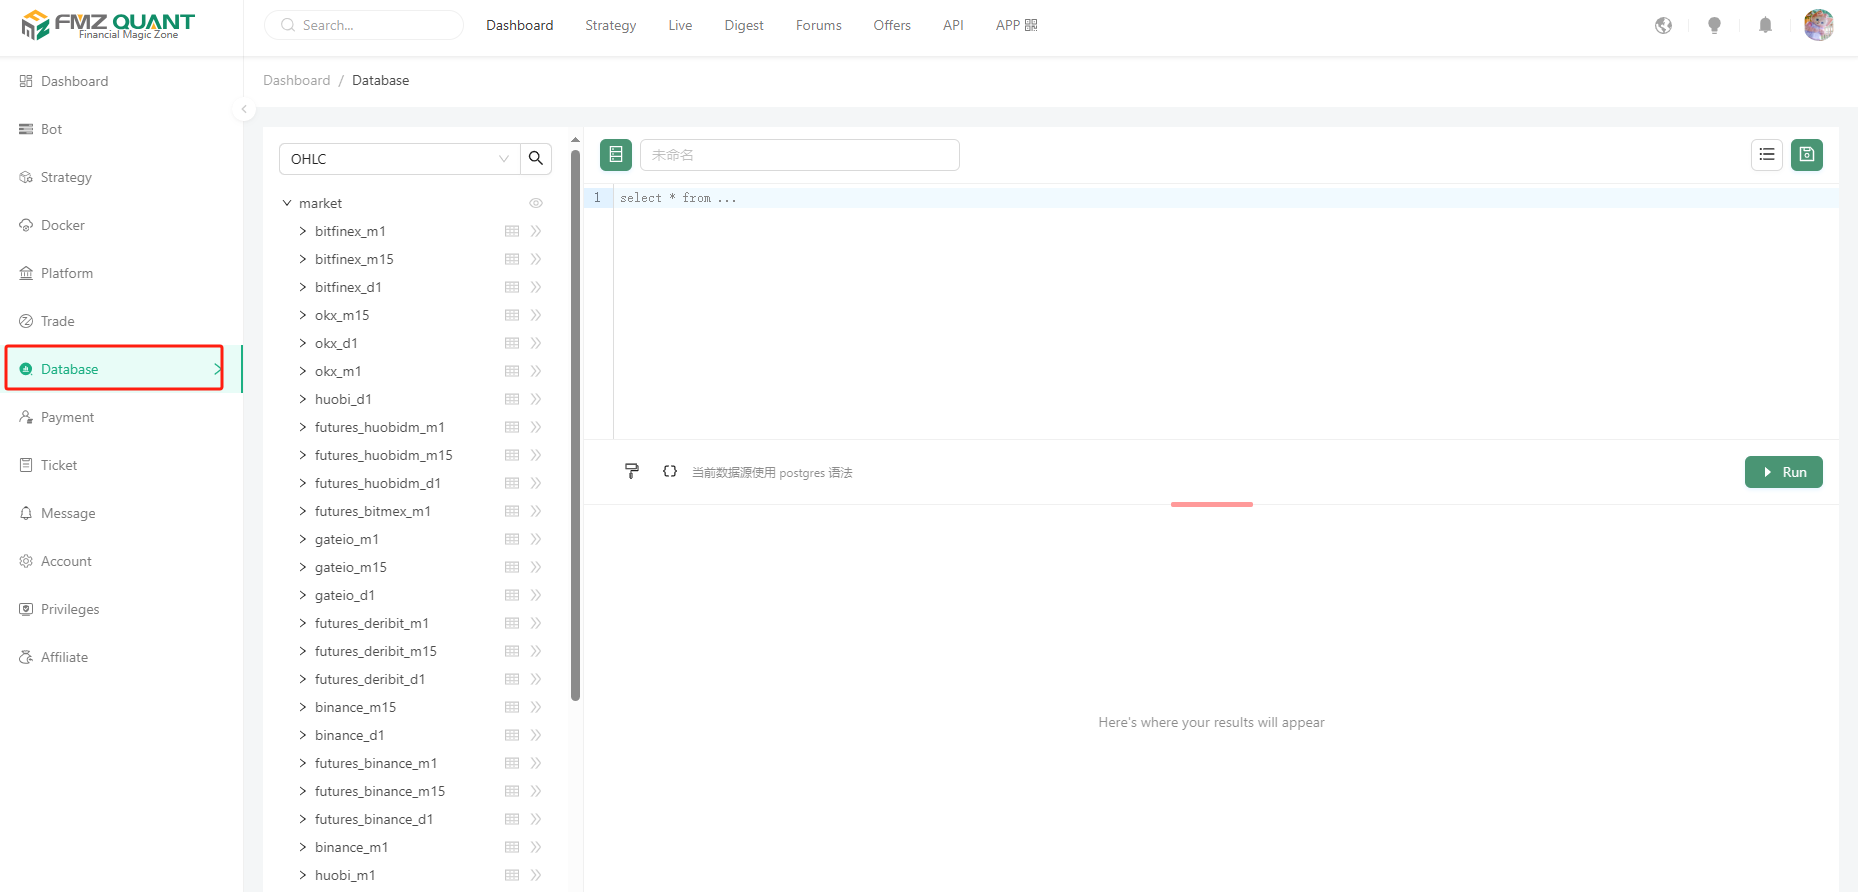
- 1. Data areas The list on the left side shows the data content that has been supported on-line, currently supporting K-line data (OHLC) and Tick data of each exchange (platform). More types and dimensions of data will be supported in the future. These data are updated continuously in real time, allowing us to always grasp the market dynamics.
For example, if we select OHLC and then select market->bitfinex_m1, we can see the field names in this table object after clicking Expand.
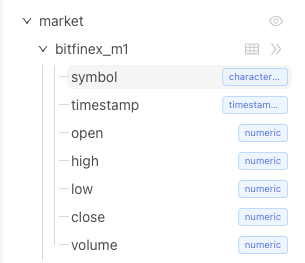
Click on the table chart to preview some of the data.
The platform also supports uploading your own data by clicking the “Upload Data” button at the bottom of the list.
Uploading CSV files from your device to the server. The file size should not exceed 10 MB, with a maximum of 10,000 rows and 128 columns.
- 2. SQL statement edit area

Here is the edit box for writing a specific query statement, we will show two interesting examples later, let’s understand the other features first.

There are two control buttons here, the first one can be used to format the SQL statement easily. The second button is used to insert variables used in the SQL statement, similar to adding a parameter to the SQL query that can be modified in real time (without having to hard-code some of the query conditions into the SQL statement). For example:
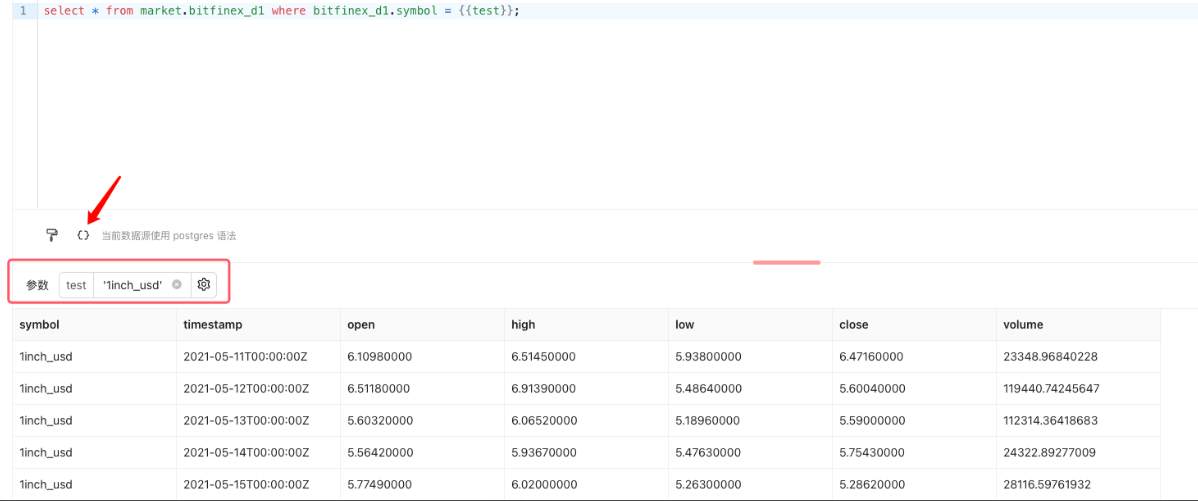
Input '1inch_usd' into the parameter test and click the “Execute” button on the right side, then you can query all the data of the variety 1inch_usd. The queried data can also be exported and downloaded locally:

It supports JSON, CSV format.
If we want to save the SQL query, we can click the “Save” button in the upper right corner to record the SQL query in the resource list of the current FMZ account’s “Data Exploration” (the resource list button is on the left side of the save button) for future use.
At present, the interface we see is simple and the functions are simple, but in practical use, we will experience the powerful use of this tool. Next, let’s take a look at two more complex examples.
Volatility ranking
SELECT
    UPPER(REPLACE(symbol, '_usdt.swap', '')) as symbol,
    ((MAX(high) - MIN(low)) / AVG((high + low) / 2)) AS volatility_percentage
FROM
    market.futures_binance_d1
WHERE
    timestamp >= CURRENT_DATE - INTERVAL '{{days}} day' and symbol like '%.swap'
GROUP BY
    symbol
ORDER BY
    volatility_percentage {{rank}}
LIMIT
    {{limit}};
This SQL code is used to get the volatility percentage of the trading pair that meets the criteria from the table “market.futures_binance_d1” and sort and limit the quantity output by volatility percentage.
The explanation of this SQL is given below:
1. Two expressions were used for calculation, one was to replace the '_usdt.swap' in the 'symbol' column with an empty string and convert the result to uppercase, and the other was to calculate (MAX(high) - MIN(low)) / AVG((high+low) / 2).
The first expression uses the REPLACE function to replace strings that meet the criteria, and then uses the UPPER function to convert the result to uppercase.
The second expression calculates the difference between the highest and lowest prices divided by the average of the highest and lowest prices to calculate the percentage of volatility.

2. FROM clause:
The specified data table to be queried is "market.futures.binance_d1".

3. WHERE clause:
Two filter conditions are used: timestamp >= CURRENT_DATE - INTERVAL '{{days}} day' and symbol like '%.swap'.
The first condition filters out data within the last {{days}} days.
The second condition filters out trading pairs where the "symbol" column ends in '.swap'.

4. GROUP BY clause:
Group by the "symbol" column.

5. ORDER BY clause:
Sort by volatility percentage, either ascending (ASC) or descending (DESC), depending on the {{rank}} parameter.

6. LIMIT clause:
Limit the number of output results, which can be set according to the {{limit}} parameter.
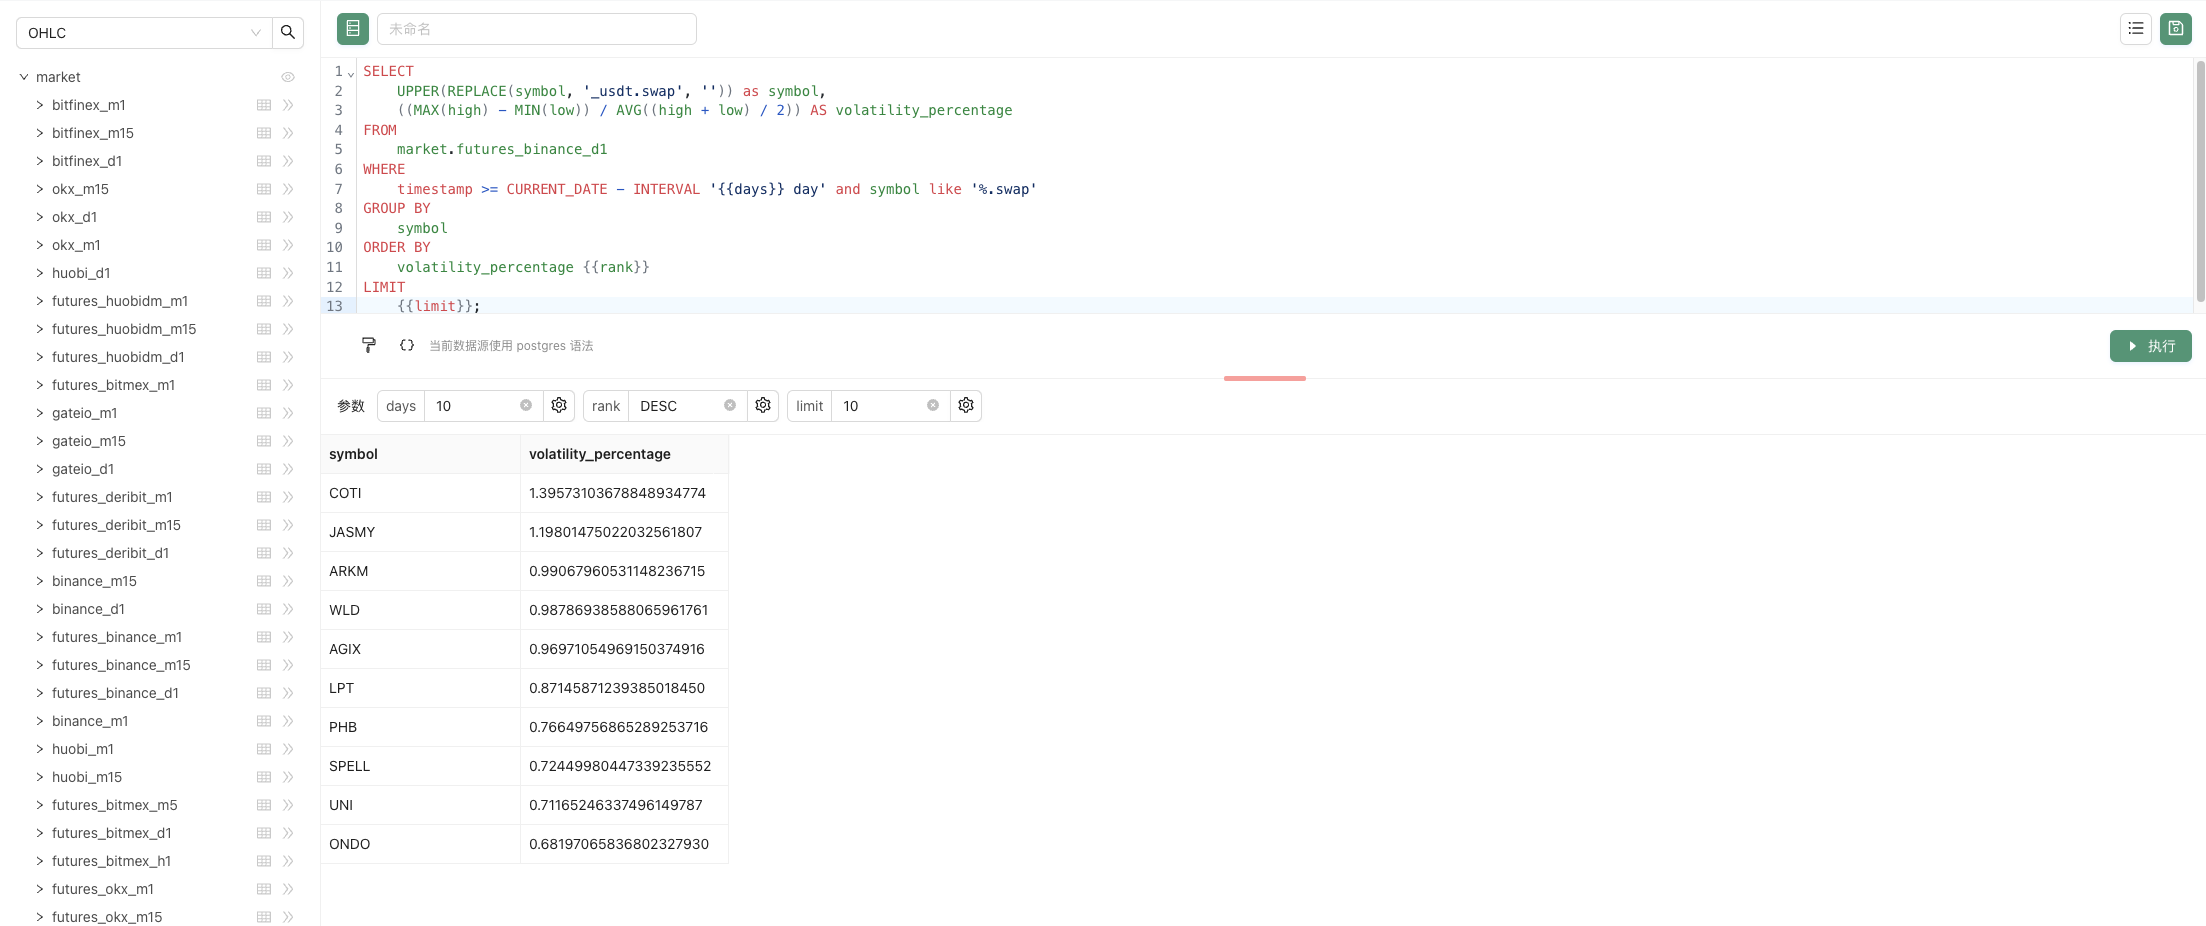
When we enter the parameters: days: 10 , rank: DESC , limit: 10, click the “Execute” button to execute the SQL statement and query the result.
In addition to displaying data in the form of tables, it can also be displayed in a variety of visualization ways. After setting up some relevant settings for visualization, the data will be displayed in a richer and more vivid way.
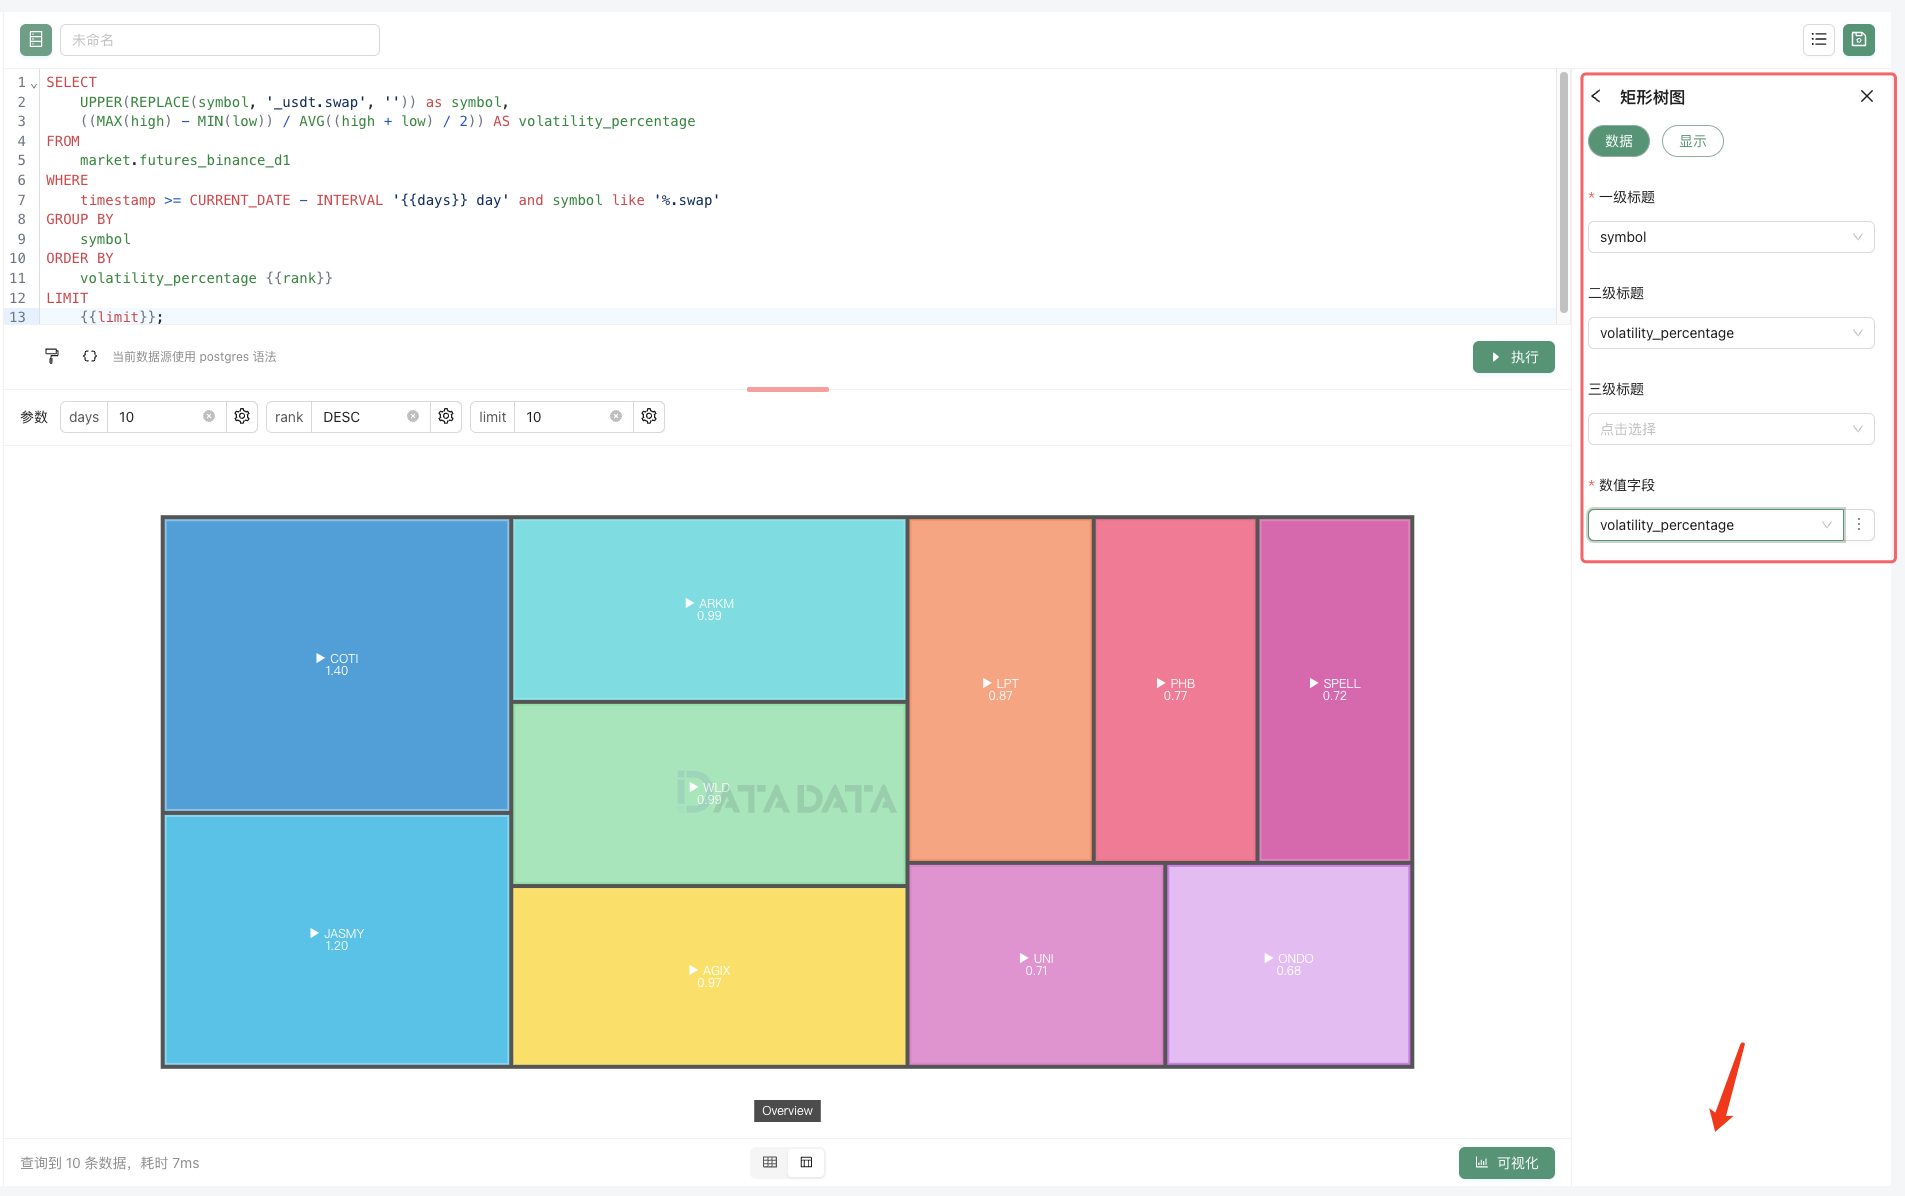
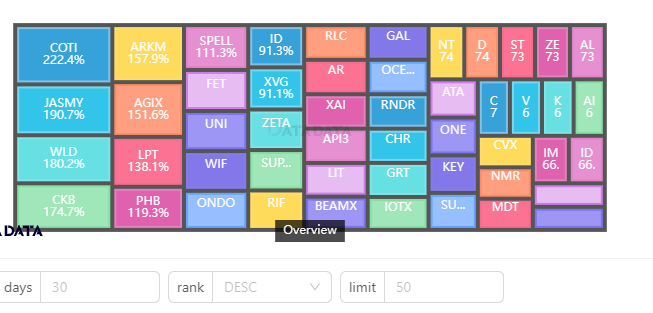
The created query can also generate URLs for easy sharing, and we can also modify the parameters to update the query (try modifying the parameters to update the query here in the article). Follwing is a chart of the real-time data generated:
volatility ranking
In-depth Replay
Next we’re going to study an example of studying a market micro-scenario, which is a wonderful tool for studying the details of high-frequency trading.
select * from market.binance where symbol = lower('{{symbol}}') order by timestamp desc limit 2000
Use the above SQL statement to query the tick level tick data for a particular species.

The SQL query for this example is very simple, just querying the Tick data for a certain variety (specified by the parameter symbol) on the Binance exchange.
The point is to show the data in the form of a live trading replay, on a time series, with multiple charts:
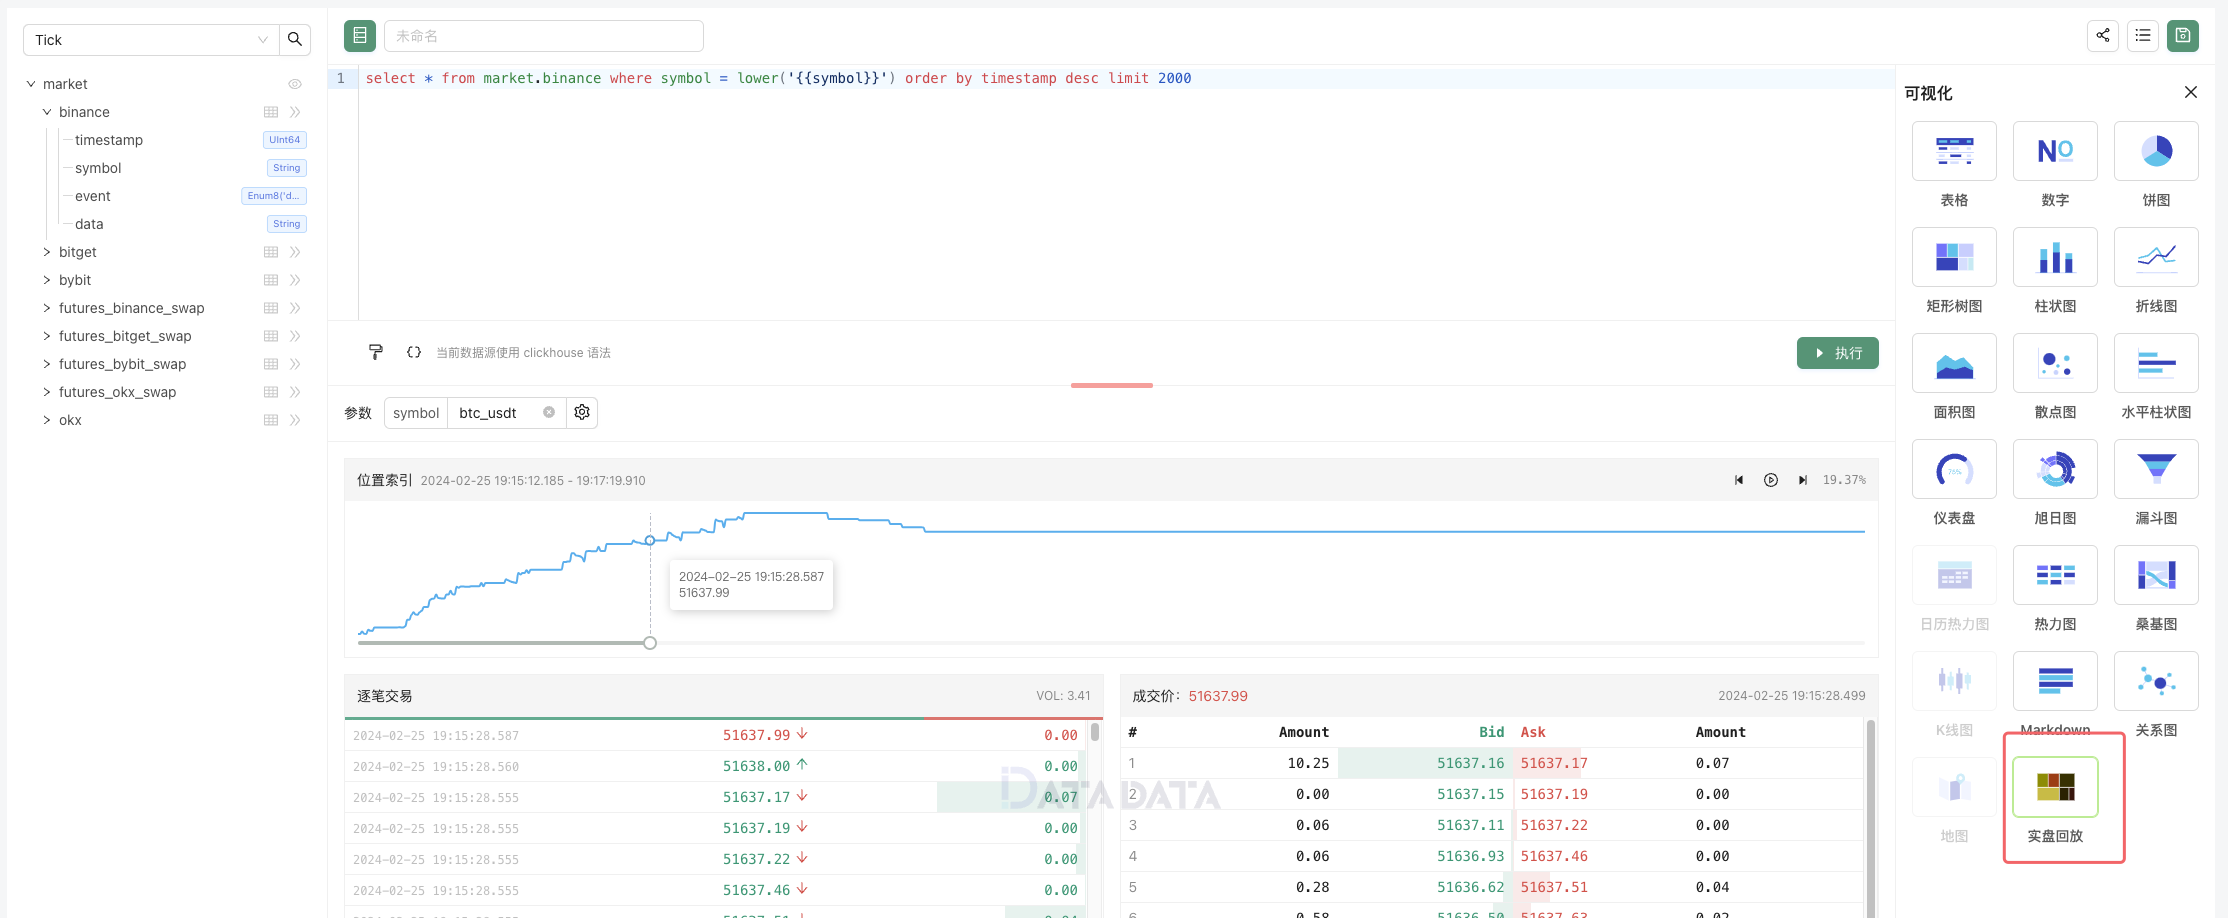
Is it convenient to study the details in the market?
Next, let’s take a look at how to share our research. We can click on the share icon in the upper right corner.

These shared codes, links, can be embedded in FMZ platform community posts, articles. They can be embedded in web pages and can be republished in other communities, forums, etc. It can also be shared directly to anyone.

What are you waiting for with this powerful quantitative trading tool? Try to mine the data and analyze it.
- Detailed Explanation of Digital Currency Pair Trading Strategy
- FMZ Quant & OKX: How Do Ordinary People Master Quantitative Trading? The Answers Are All Here!
- 数字货币配对交易策略详解
- Detailed Explanation of FMZ Quant API Upgrade: Improving the Strategy Design Experience
- Detailed Explanation of New Features of Strategy Interface Parameters and Interactive Controls
- FMZ 量化& OKX:普通人如何玩转量化交易?答案都在这儿!
- 详解发明者量化交易平台API升级:提升策略设计体验
- 策略界面参数与交互控件新增功能详解
- Quantifying Fundamental Analysis in the Cryptocurrency Market: Let Data Speak for Itself!
- 币圈基本面量化研究-不要再相信各种“老师”了,数据客观来说话!
- 量化交易领域的必备工具--发明者量化数据探索模块
- Mastering Everything - Introduction to FMZ New Version of Trading Terminal (with TRB Arbitrage Source Code)
- 掌握一切——FMZ新版交易终端介绍(附赠TRB套利源码)
- FMZ Quant: An Analysis of Common Requirements Design Examples in the Cryptocurrency Market (II)
- How to Exploit Brainless Selling Bots with a High-Frequency Strategy in 80 Lines of Code
- FMZ量化:加密货币市场常见需求设计实例解析(二)
- 如何用80行代码的高频策略剥削无脑出售的机器人
- FMZ Quant: An Analysis of Common Requirements Design Examples in the Cryptocurrency Market (I)
- FMZ量化:加密货币市场常见需求设计实例解析(一)
- WexApp, the FMZ Quant Cryptocurrency Demo Exchange, is Newly Launched