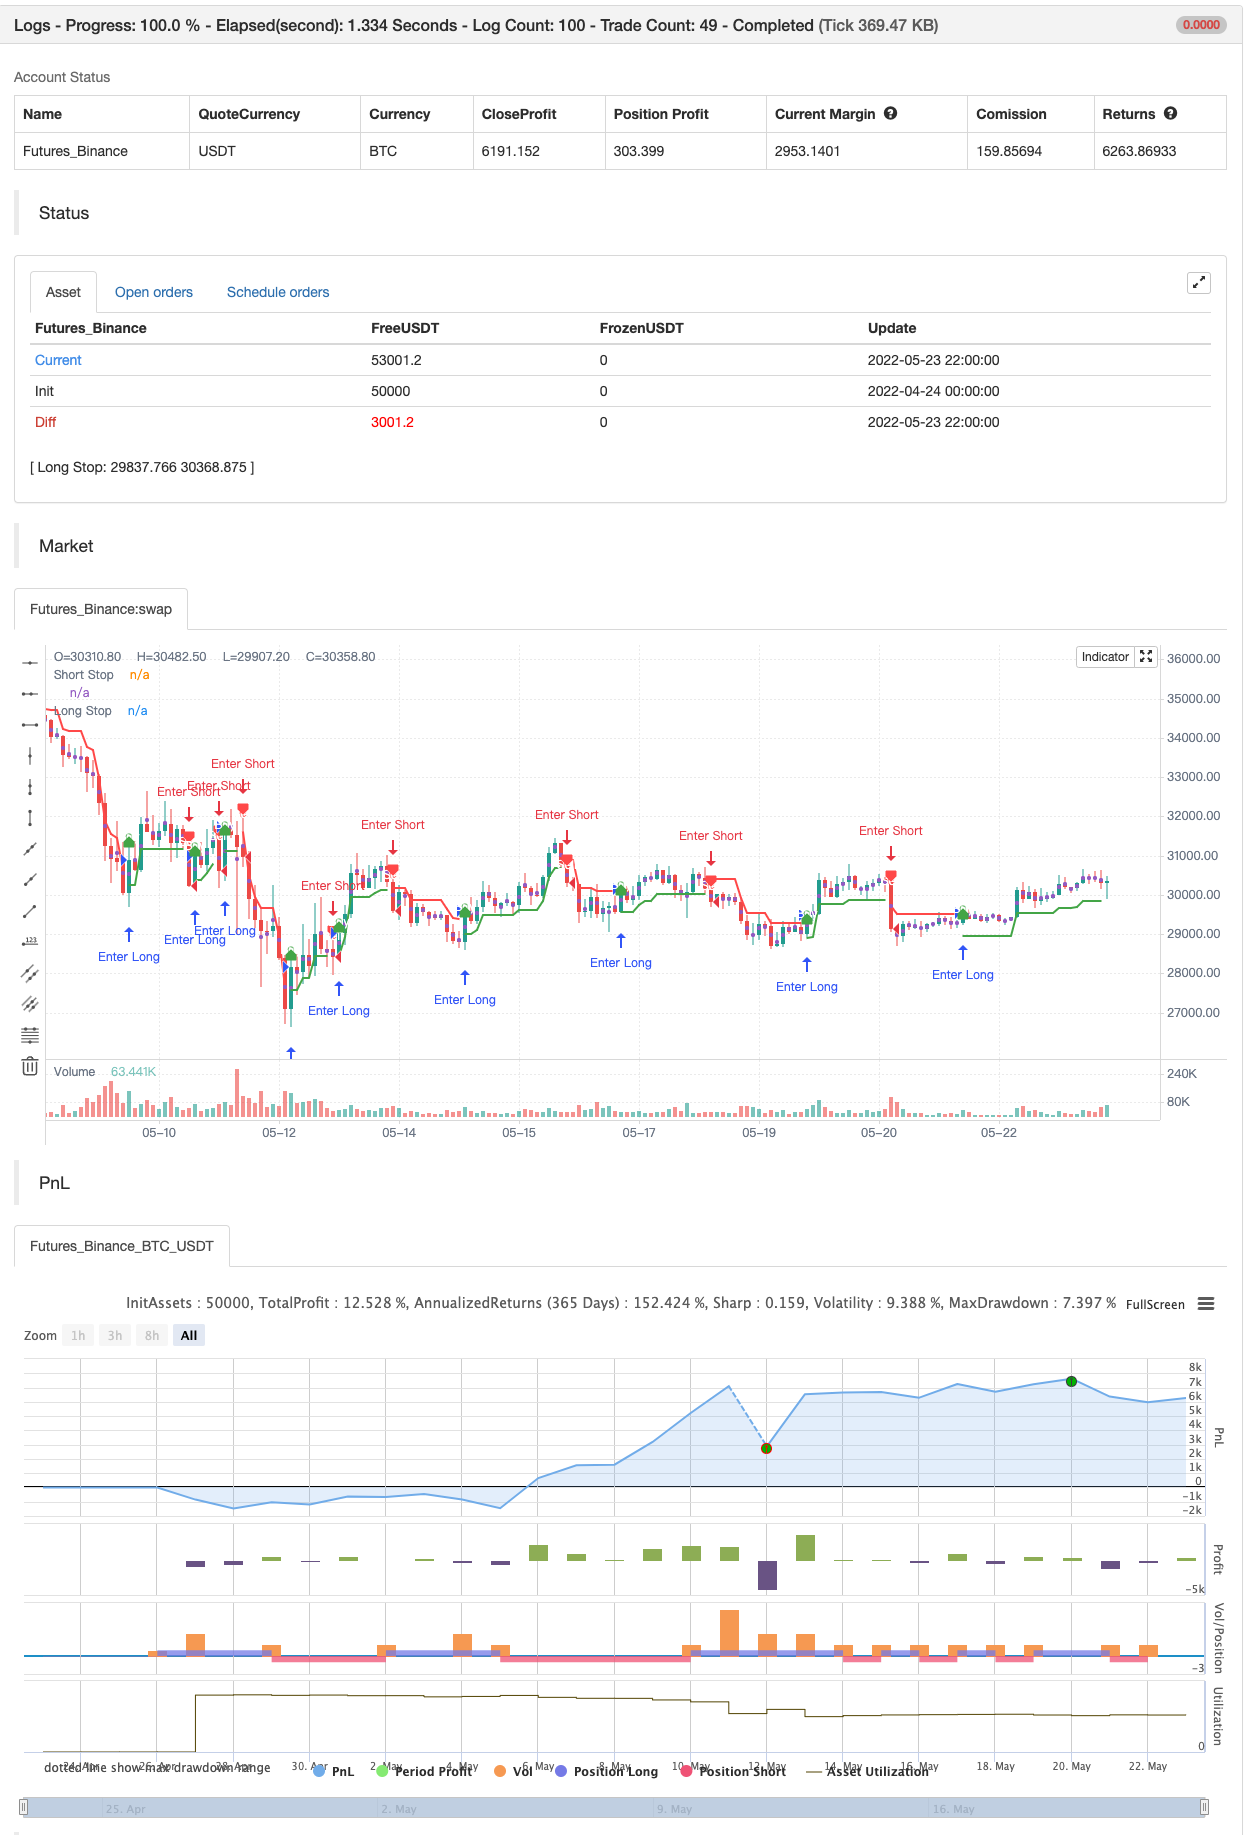
নিক রাইপক ট্রেলিং রিভার্স (এনআরটিআর)
লেখক:চাওঝাং, তারিখ: ২০২২-০৫-২৫ ১৮ঃ১৪ঃ৩২ট্যাগঃএনআরটিআর
এই সূচকটি ২০০১ সালে কনস্টান্টিন কপিরকিন আবিষ্কার করেছিলেন।
কপিরকিন -> কপির কিং -> কপির কিং -> নিক রিপক
সূচকটির ধারণা চ্যান্ডেলিয়ারের প্রস্থানের অনুরূপ, তবে এটিআর উপাদান জড়িত নয় এবং পরিবর্তে একটি শতাংশ ব্যবহার করে।
এনআরটিআর গণনা করার জন্য একটি গতিশীল মূল্য চ্যানেল ব্যবহার করা হয়। গণনাগুলি কেবলমাত্র বর্তমান প্রবণতায় অন্তর্ভুক্ত মূল্যগুলিকে জড়িত করে এবং পূর্ববর্তী প্রবণতার সাথে সম্পর্কিত চরমগুলিকে বাদ দেয়। সূচকটি সর্বদা মূল্য দ্বারা প্রাপ্ত চরমগুলি থেকে একই দূরত্বে (শতাংশে) থাকে (বর্তমান আপট্রেন্ডের সর্বাধিক শিখরের নীচে, বর্তমান ডাউনট্রেন্ডের সর্বনিম্ন নীচের উপরে) ।
ব্যাকটেস্ট

/*backtest
start: 2022-04-24 00:00:00
end: 2022-05-23 23:59:00
period: 2h
basePeriod: 15m
exchanges: [{"eid":"Futures_Binance","currency":"BTC_USDT"}]
*/

//@version=4
// Copyright (c) 2021-present, Alex Orekhov (everget)
study("Nick Rypock Trailing Reverse", shorttitle="NRTR", overlay=true)

k = input(title="Coefficient of Correction, %", type=input.float, minval=0, maxval=100, step=0.1, defval=2)
showLabels = input(title="Show Buy/Sell Labels ?", type=input.bool, defval=true)
applyRibbon = input(title="Apply Ribbon ?", type=input.bool, defval=true)

var int trend = 0
var float hp = close
var float lp = close
float nrtr = close

percentage = k * 0.01

if trend >= 0
	if close > hp
		hp := close
		hp
	nrtr := hp * (1 - percentage)
	if close <= nrtr
		trend := -1
		lp := close
		nrtr := lp * (1 + percentage)
		nrtr
else
	if close < lp
		lp := close
		lp
	nrtr := lp * (1 + percentage)
	if close > nrtr
		trend := 1
		hp := close
		nrtr := hp * (1 - percentage)
		nrtr

var color longColor = color.green
var color shortColor = color.red
var color textColor = color.white

longStopPlot = plot(trend == 1 ? nrtr : na, title="Long Stop", style=plot.style_linebr, linewidth=2, color=longColor)
buySignal = trend == 1 and trend[1] == -1
plotshape(buySignal ? nrtr : na, title="Long Stop Start", location=location.absolute, style=shape.circle, size=size.tiny, color=longColor, transp=0)
plotshape(buySignal and showLabels ? nrtr : na, title="Buy Label", text="Buy", location=location.absolute, style=shape.labelup, size=size.tiny, color=longColor, textcolor=textColor, transp=0)

shortStopPlot = plot(trend == 1 ? na : nrtr, title="Short Stop", style=plot.style_linebr, linewidth=2, color=shortColor)
sellSignal = trend == -1 and trend[1] == 1
plotshape(sellSignal ? nrtr : na, title="Short Stop Start", location=location.absolute, style=shape.circle, size=size.tiny, color=shortColor, transp=0)
plotshape(sellSignal and showLabels ? nrtr : na, title="Sell Label", text="Sell", location=location.absolute, style=shape.labeldown, size=size.tiny, color=shortColor, textcolor=textColor, transp=0)

midPricePlot = plot(ohlc4, title="", style=plot.style_circles, linewidth=0, display=display.none, editable=false)

longFillColor = applyRibbon ? (trend == 1 ? longColor : na) : na
shortFillColor = applyRibbon ? (trend == -1 ? shortColor : na) : na
fill(midPricePlot, longStopPlot, title="Long Ribbon", color=longFillColor)
fill(midPricePlot, shortStopPlot, title="Short Ribbon", color=shortFillColor)

changeCond = trend != trend[1]
alertcondition(changeCond, title="Alert: NRTR Direction Change", message="NRTR has changed direction!")
alertcondition(buySignal, title="Alert: NRTR Buy", message="NRTR Buy!")
alertcondition(sellSignal, title="Alert: NRTR Sell", message="NRTR Sell!")


if buySignal
    strategy.entry("Enter Long", strategy.long)
else if sellSignal
    strategy.entry("Enter Short", strategy.short)
সম্পর্কিত
আরো
- ক্রয়/বিক্রয় সহ EMA ADX RSI এর স্কাল্পিং
- ভলিউম ডিভার্জেন্স
- সুপার ট্রেন্ড ডেইলি ২.০ বিএফ
- হুল মুভিং এভারেজ সুইং ট্রেডার
- এফটিএসএমএ - ট্রেন্ড আপনার বন্ধু
- ব্যাপ্তি ফিল্টার কিনুন এবং বিক্রি করুন
- এসএসএল চ্যানেল
- হেল স্যুট কৌশল
- প্যারাবোলিক এসএআর কিনুন এবং বিক্রয় করুন
- পিভট ভিত্তিক ট্রেইলিং সর্বোচ্চ ও সর্বনিম্ন
- জিগজ্যাগ পিএ কৌশল V4.1
- ইনট্রা ডে কেনা/বিক্রয়
- ব্রেকড ফ্র্যাক্টাল: কারো ভাঙা স্বপ্ন আপনার লাভ!
- মুনাফা সর্বাধিকীকরণকারী PMax
- নিখুঁত বিজয় কৌশল
- স্টোক্যাস্টিক + আরএসআই, ডাবল স্ট্র্যাটেজি
- সুইং হুল/আরএসআই/ইএমএ কৌশল
- স্কেলপিং সুইং ট্রেডিং টুল R1-4
- সেরা গলফিং + ব্রেকআউট কৌশল
- বোলিংজার অ্যামেজিং অ্যালার্ট R1