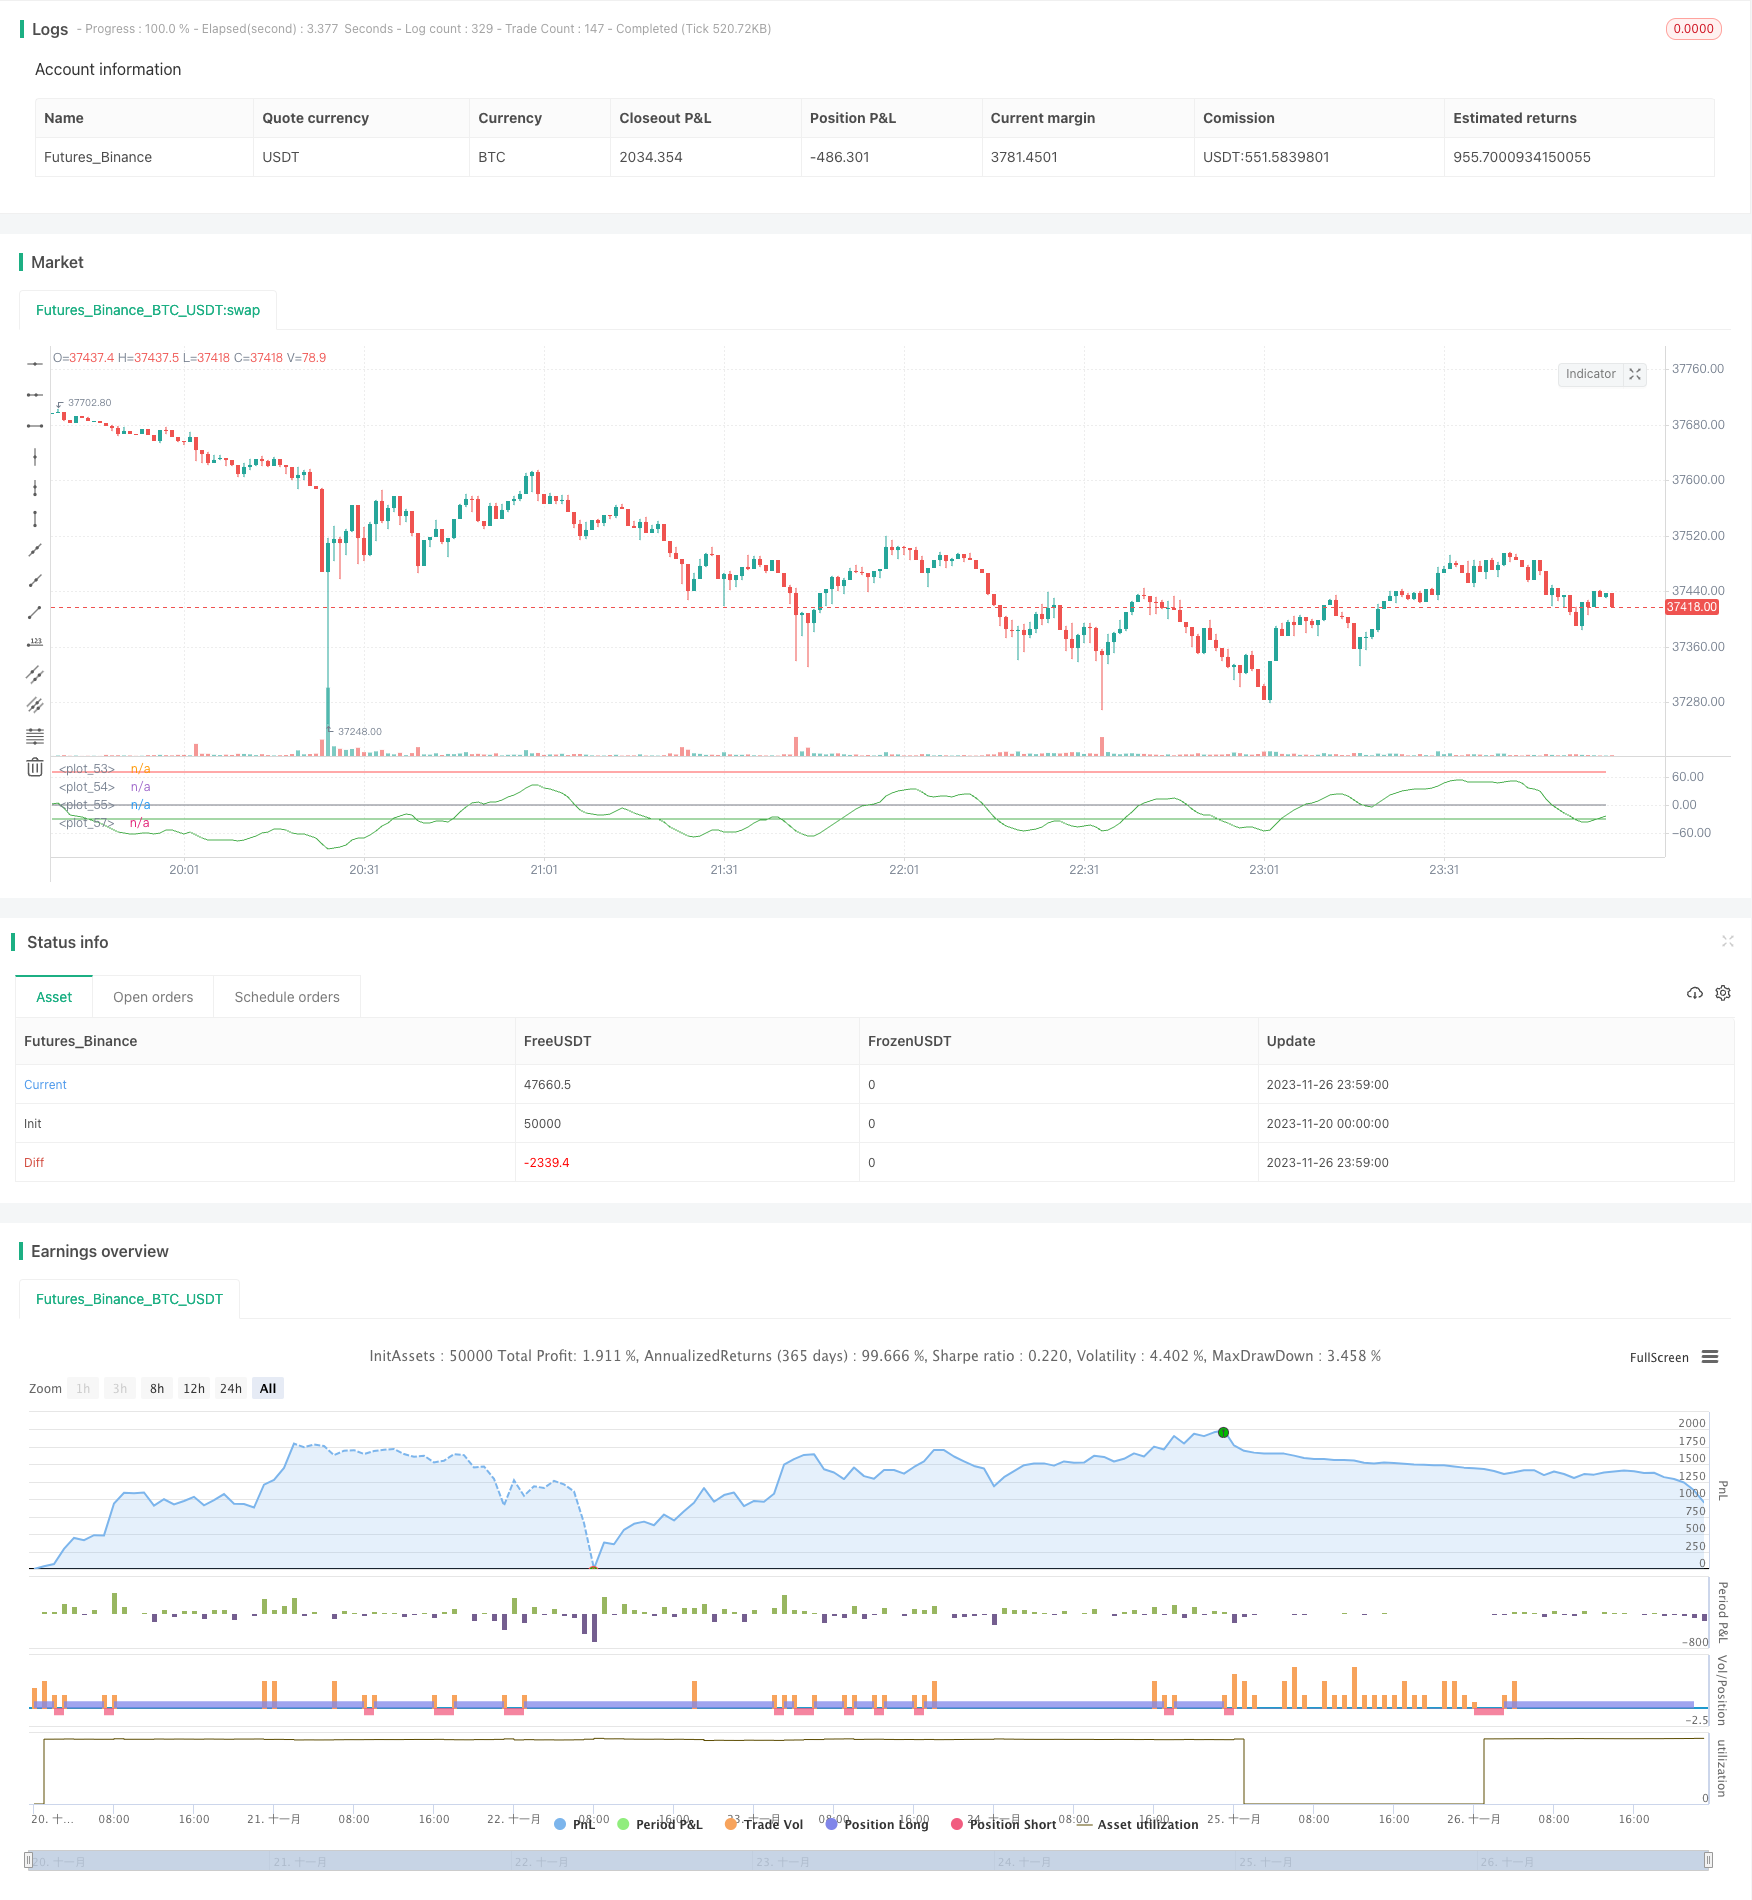
তরঙ্গ প্রবণতা ভিত্তিক পরিমাণগত ট্রেডিং কৌশল
লেখক:চাওঝাং, তারিখঃ ২০২৩-১১-২৮ ১৬ঃ১৭ঃ৩১ট্যাগঃ

সারসংক্ষেপ
এই কৌশলটি ওয়েভ ট্রেন্ড সূচকের উপর ভিত্তি করে ডিজাইন করা হয়েছে। ওয়েভ ট্রেন্ড সূচকটি বাজারের প্রবণতা কার্যকরভাবে সনাক্ত করতে এবং ট্রেডিং সংকেত তৈরি করতে মূল্য চ্যানেল এবং চলমান গড়ের সংমিশ্রণ করে। এই কৌশলটি দীর্ঘ বা সংক্ষিপ্ত অবস্থানে প্রবেশ করে যখন ওয়েভ ট্রেন্ড লাইনটি অত্যধিক ক্রয় বা অত্যধিক বিক্রয় অবস্থা প্রতিনিধিত্বকারী মূল স্তরের উপর অতিক্রম করে।
কৌশলগত যুক্তি
- মূল্যের ত্রিভুজীয় চলমান গড় এপি, সেইসাথে এপি এর এক্সপোনেন্সিয়াল চলমান গড় এএসএ গণনা করুন।
- এপি এবং এএসএ এর মধ্যে পরম পার্থক্যের এক্সপোনেন্সিয়াল চলমান গড় d গণনা করুন।
- অস্থিরতা সূচক সিআই বের করুন।
- তরঙ্গ প্রবণতা সূচক wt1 পেতে ci এর n2 সময়ের চলমান গড় গণনা করুন।
- অতিরিক্ত ক্রয় এবং অতিরিক্ত বিক্রয়ের সীমা নির্ধারণ করুন।
- যখন wt1 ওভারসোল্ড লাইন অতিক্রম করে তখন লম্বা হয়ে যায়, যখন wt1 ওভারক্রয়েড লাইন অতিক্রম করে তখন শর্ট হয়ে যায়।
সুবিধা বিশ্লেষণ
- ওভারকুপেড/ওভারসোল্ড স্তরের তরঙ্গ প্রবণতা বিরতি কার্যকরভাবে প্রবণতা বিপরীত পয়েন্টগুলি ধরতে এবং সঠিক ট্রেডিং সংকেত তৈরি করতে পারে।
- মূল্য চ্যানেল এবং চলমান গড় তত্ত্বের সংমিশ্রণ, সূচকটি ঘন ঘন মিথ্যা সংকেতগুলি এড়ায়।
- সকল সময়সীমার জন্য এবং বিভিন্ন ট্রেডিং যন্ত্রের জন্য প্রযোজ্য।
- কাস্টমাইজযোগ্য প্যারামিটারগুলি ব্যবহারকারীর ভাল অভিজ্ঞতা প্রদান করে।
ঝুঁকি এবং সমাধান
- উল্লেখযোগ্য whipsaws খারাপ সংকেত, উচ্চ ঝুঁকি হতে পারে। সংকেত ফিল্টারিং জন্য সংক্ষিপ্ত হোল্ডিং সময়কাল ব্যবহার করতে পারেন বা অন্যান্য সূচক সঙ্গে একত্রিত।
- কোন পজিশন সাইজিং এবং স্টপ লস মেকানিজম নেই, ক্ষতির ঝুঁকি আছে। স্থির পজিশন সাইজ নিয়ম এবং চলমান স্টপ সেট করতে পারেন।
অপ্টিমাইজেশান নির্দেশাবলী
- এটিকে কেডিজে এবং এমএসিডি-র মতো অন্যান্য সূচকের সাথে একত্রিত করে কৌশলগত সংমিশ্রণ গঠনের বিষয়টি বিবেচনা করুন, যা স্থিতিশীলতা বৃদ্ধি করে।
- স্বয়ংক্রিয় স্টপ লস ডিজাইন করুন যেমন ট্রেলিং স্টপ, ট্রেড লস প্রতি সীমাবদ্ধ করতে অস্থিরতা স্টপ।
- ঐতিহাসিক তথ্যের উপর মেশিন লার্নিং অ্যালগরিদম ব্যবহার করে স্বয়ংক্রিয়ভাবে পরামিতিগুলি সামঞ্জস্য করতে এবং কৌশল কর্মক্ষমতা উন্নত করতে।
সিদ্ধান্ত
এই কৌশলটি তরঙ্গ প্রবণতা সূচক ব্যবহার করে প্রবণতা এবং ওভারক্রয় / ওভারসোল্ড স্তরগুলি সনাক্ত করে, কৌশল অনুসরণ করে একটি কার্যকর প্রবণতা গঠন করে। স্বল্পমেয়াদী দোলকের তুলনায়, তরঙ্গ প্রবণতা মিথ্যা সংকেত এড়ায় এবং আরও স্থিতিশীলতা সরবরাহ করে। সঠিক ঝুঁকি নিয়ন্ত্রণ পদ্ধতির সাথে, এটি স্থিতিশীল মুনাফা অর্জন করতে পারে। পরামিতি এবং মডেল টিউনিং থেকে আরও কর্মক্ষমতা বৃদ্ধি আশা করা যেতে পারে।
/*backtest
start: 2023-11-20 00:00:00
end: 2023-11-27 00:00:00
period: 1m
basePeriod: 1m
exchanges: [{"eid":"Futures_Binance","currency":"BTC_USDT"}]
*/


//@author SoftKill21
//@version=4

strategy(title="WaveTrend strat", shorttitle="WaveTrend strategy")
n1 = input(10, "Channel Length")
n2 = input(21, "Average Length")
Overbought = input(70, "Over Bought")
Oversold = input(-30, "Over Sold ")

// BACKTESTING RANGE

// From Date Inputs
fromDay = input(defval = 1, title = "From Day", minval = 1, maxval = 31)
fromMonth = input(defval = 1, title = "From Month", minval = 1, maxval = 12)
fromYear = input(defval = 2001, title = "From Year", minval = 1970)

// To Date Inputs
toDay = input(defval = 1, title = "To Day", minval = 1, maxval = 31)
toMonth = input(defval = 12, title = "To Month", minval = 1, maxval = 12)
toYear = input(defval = 2020, title = "To Year", minval = 1970)

// Calculate start/end date and time condition
DST = 1 //day light saving for usa
//--- Europe
London = iff(DST==0,"0000-0900","0100-1000")
//--- America
NewYork = iff(DST==0,"0400-1500","0500-1600")
//--- Pacific
Sydney = iff(DST==0,"1300-2200","1400-2300")
//--- Asia
Tokyo = iff(DST==0,"1500-2400","1600-0100")

//-- Time In Range
timeinrange(res, sess) => time(res, sess) != 0

london = timeinrange(timeframe.period, London)
newyork = timeinrange(timeframe.period, NewYork)

startDate = timestamp(fromYear, fromMonth, fromDay, 00, 00)
finishDate = timestamp(toYear, toMonth, toDay, 00, 00)
time_cond = true //and (london or newyork)

ap = hlc3
esa = ema(ap, n1)
d = ema(abs(ap - esa), n1)
ci = (ap - esa) / (0.015 * d)
tci = ema(ci, n2)

wt1 = tci
wt2 = sma(wt1,4)

plot(0, color=color.gray)
plot(Overbought, color=color.red)
plot(Oversold, color=color.green)

plot(wt1, color=color.green)
longButton = input(title="Long", type=input.bool, defval=true)
shortButton = input(title="Short", type=input.bool, defval=true)

if(longButton==true)
    strategy.entry("long",1,when=crossover(wt1,Oversold) and time_cond)
    strategy.close("long",when=crossunder(wt1, Overbought))

if(shortButton==true)
    strategy.entry("short",0,when=crossunder(wt1, Overbought) and time_cond)
    strategy.close("short",when=crossover(wt1,Oversold))

//strategy.close_all(when= not (london or newyork),comment="time")
if(dayofweek == dayofweek.friday)
    strategy.close_all(when= timeinrange(timeframe.period, "1300-1400"), comment="friday")
আরো
- ডাবল এন্ট্রি পজিশনের গড় হ্রাস স্টপ লস কৌশল
- RSI Moving Average ক্রসওভার ট্রেন্ড কৌশল
- ঐতিহাসিক তথ্যের উপর ভিত্তি করে গতিশীল সমর্থন ও প্রতিরোধ কৌশল
- নোরোর বোলিংজার ট্র্যাকিং কৌশল
- ইএমএ বিপরীত ক্রয়-বিক্রয় কৌশল
- হারামি ক্লোজিং মূল্য কৌশল
- সিএমও এবং ডব্লিউএমএ-র উপর ভিত্তি করে গতিশীল ট্রেডিং কৌশল
- P-Signal মাল্টি টাইমফ্রেম ট্রেডিং কৌশল
- কমোডিটি মিনটেম ইনডেক্স কৌশল
- ডাবল টার্টেল অগ্রগতি কৌশল
- ইচিমোকু কুমো টুইস্ট গোল্ড-অ্যাসোসিভিং কৌশল
- আংশিক মুনাফা গ্রহণের কৌশল সহ ধাপে ধাপে ট্রেলিং স্টপ
- টিএসআই এবং সিসিআই হুল চলমান গড় প্রবণতা ট্র্যাকিং কৌশল
- বিপরীত প্রকৌশল আরএসআই কৌশল
- দ্বৈত সিসিআই পরিমাণগত কৌশল
- ডুয়াল ইএমএ ক্রসওভার ব্রেকআউট কৌশল
- মাল্টি টাইমফ্রেম এমএসিডি কৌশল
- RSI এবং ATR চ্যানেলের উপর ভিত্তি করে সুপার স্কাল্পিং কৌশল
- ডনচিয়ান ট্রেন্ড কৌশল
- মাল্টি-এসএমএ চলমান গড় ক্রসওভার কৌশল