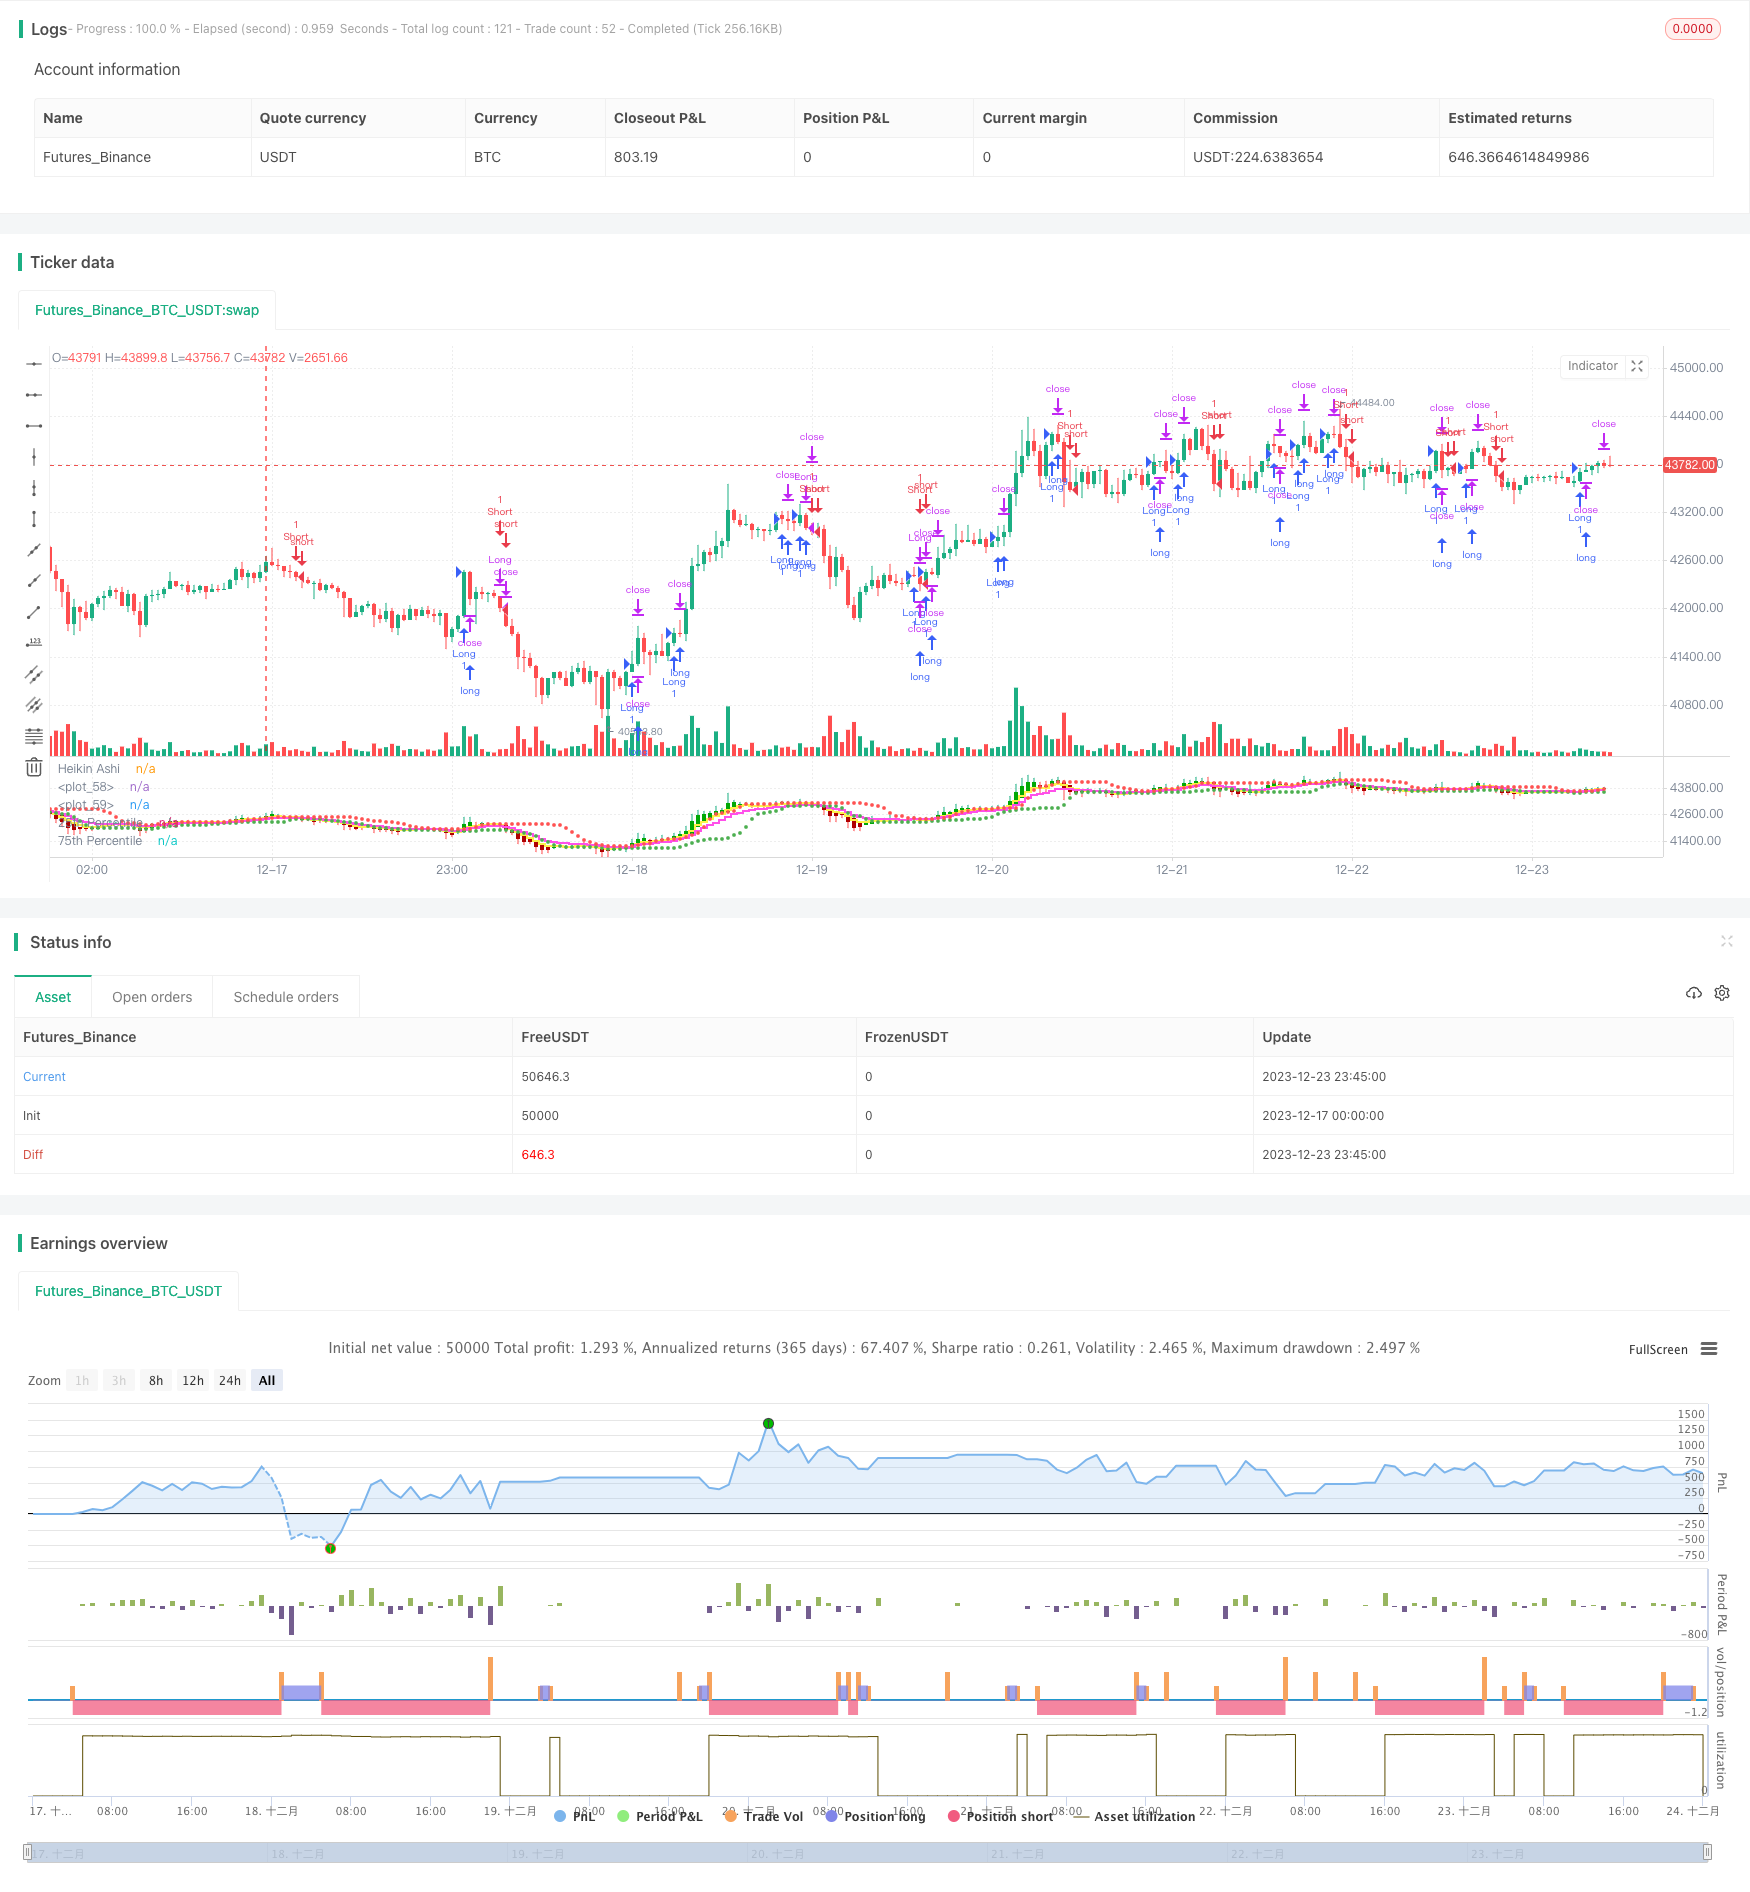
শতকরা হারের উপর ভিত্তি করে হাইনাচ মুভিং এভারেজ ট্রেডিং কৌশল

ওভারভিউ
এই কৌশলটি হাইন-আশের গড়ের উপর ভিত্তি করে ট্রেডিং সিগন্যাল তৈরির উপর ভিত্তি করে তৈরি করা হয়। এর মধ্যে, ক্রয় এবং বিক্রয় সংকেত তৈরির জন্য হাইন-আশের ক্লোজিং মূল্যের 75 শতাংশ মূল্যের স্তরের সাথে ক্রস এবং হাইন-আশের ক্লোজিং মূল্যের চলমান গড়ের চেয়ে বেশি দুটি ফ্যাক্টর বিবেচনা করা হয়।
কৌশল নীতি
এই কৌশলটি সাধারণ K-লাইনগুলির পরিবর্তে হাইনা-আশির গড় ব্যবহার করে বিশ্লেষণ করে। এই গড়টি বাজার শব্দটি ফিল্টার করে, যা প্রবণতা এবং বিপরীত সংকেতগুলি সনাক্ত করতে আরও সহায়ক। বিশেষত, কৌশলটি শতাংশের চ্যানেল এবং চলমান গড়ের সাথে একত্রিত হয়ে ট্রেডিং সংকেত তৈরি করেঃ
- হেইনা-আশির দরপতন যখন ৭৫ শতাংশে নেমে আসে, তখন এটি একটি ক্রয় সংকেত দেয়।
- হেইনা এশির বন্ধের দামের নিচে ৫ দিনের মুভিং এভারেজ অতিক্রম করার সময় বিক্রির সংকেত দেওয়া হয়।
এছাড়াও, এই কৌশলটি একতরফা ঝুঁকি নিয়ন্ত্রণের জন্য স্টপ লস দূরত্ব এবং স্টপ লস ট্র্যাকিং সেট করে।
কৌশলগত সুবিধা
- হেইনাশ গড়রেখার সাহায্যে প্রবণতা আরো স্পষ্টভাবে চিহ্নিত করা যায় এবং সময়মত বিপরীতমুখী সংকেত পাওয়া যায়।
- শতকরা হার চ্যানেলের সাথে মিলিত করে, এটি নির্ধারণ করা যায় যে দামটি উত্তপ্ত বা অতিমাত্রায় বিক্রি হয়েছে কিনা, যাতে ক্রয় এবং বিক্রয়ের সময় নির্ধারণ করা যায়।
- স্টপ লস সেট এবং স্টপ লস ট্র্যাকিং ঝুঁকিকে সক্রিয়ভাবে নিয়ন্ত্রণ করতে সাহায্য করে এবং সহ্যযোগ্য ক্ষতির বাইরে যাওয়া এড়ায়।
কৌশলগত ঝুঁকি
- হাইন-আশি গড়রেখা নিজেই বিলম্ব সৃষ্টি করে, যা সংক্ষিপ্ত রেখার অপারেশনের জন্য সর্বোত্তম পয়েন্টটি মিস করতে পারে।
- শতকরা চ্যানেলগুলি মূল্যের টার্নপয়েন্টগুলিকে পুরোপুরি নির্ধারণ করতে পারে না, এবং কিছু মিথ্যা সংকেত হার রয়েছে।
- ভুলভাবে সেট করা স্টপ-ড্রপ দূরত্বটি খুব হালকা বা খুব সংকীর্ণ হতে পারে, যার ফলে কৌশলটির কার্যকারিতা প্রভাবিত হয়।
উপরোক্ত ঝুঁকি কমানোর জন্য, চলমান গড়ের সময়কাল বা স্টপ লস অনুপাতের সমন্বয় করা যেতে পারে।
কৌশল অপ্টিমাইজেশন
- চলমান গড়ের বিভিন্ন সমন্বয় পরীক্ষা করে সেরা প্যারামিটার খুঁজে বের করুন।
- বিভিন্ন শতাংশের চ্যানেল প্যারামিটার পরীক্ষা করে নিশ্চিত করুন যে দামের উত্তপ্ত অঞ্চলটি ধরা হয়েছে।
- অন্যান্য সূচকগুলির সাথে মিলিতভাবে, ক্রয়-বিক্রয় সংকেতগুলি যাচাই করে এবং মিথ্যা সংকেতগুলি ফিল্টার করে।
- ডায়নামিক অ্যাডজাস্টমেন্ট স্টপডোজার দূরত্ব।
সারসংক্ষেপ
এই কৌশলটি হাইন-আশ গড়, শতাংশের চ্যানেল এবং চলমান গড়ের একাধিক সূচককে একত্রিত করে একটি ট্রেডিং সিস্টেম গঠন করে। এই সিস্টেমটি কার্যকরভাবে প্রবণতার দিক সনাক্ত করতে পারে এবং ঝুঁকি নিয়ন্ত্রণের জন্য স্টপ লস সেট করে। এটি একটি পরিমাণগত ট্রেডিং কৌশল যা বিবেচনা করা উচিত। প্যারামিটারগুলি অপ্টিমাইজ করা এবং অন্যান্য সহায়ক সূচক যুক্ত করে সিস্টেমের স্থায়িত্ব আরও বাড়ানোর সম্ভাবনা রয়েছে।
/*backtest
start: 2023-12-17 00:00:00
end: 2023-12-24 00:00:00
period: 45m
basePeriod: 5m
exchanges: [{"eid":"Futures_Binance","currency":"BTC_USDT"}]
*/

//@version=5
strategy("HK Percentile Interpolation One",shorttitle = "HKPIO", overlay=false, default_qty_type = strategy.cash, default_qty_value = 5000, calc_on_order_fills = true, calc_on_every_tick = true)

// Input parameters
stopLossPercentage = input(3, title="Stop Loss (%)") // User can set Stop Loss as a percentage
trailStopPercentage = input(1.5, title="Trailing Stop (%)") // User can set Trailing Stop as a percentage
lookback = input.int(14, title="Lookback Period", minval=1) // User can set the lookback period for percentile calculation
yellowLine_length = input.int(5, "Yellow", minval=1) // User can set the length for Yellow EMA
purplLine_length = input.int(10, "Purple", minval=1) // User can set the length for Purple EMA
holdPeriod = input.int(200, title="Minimum Holding Period", minval=10) // User can set the minimum holding period
startDate = timestamp("2021 01 01")  // User can set the start date for the strategy

// Calculate Heikin Ashi values
haClose = ohlc4
var float haOpen = na
haOpen := na(haOpen[1]) ? (open + close) / 2 : (haOpen[1] + haClose[1]) / 2
haHigh = math.max(nz(haOpen, high), nz(haClose, high), high)
haLow = math.min(nz(haOpen, low), nz(haClose, low), low)

// Calculate Moving Averages
yellowLine = ta.ema(haClose, yellowLine_length)
purplLine = ta.ema(haClose, purplLine_length)

// Calculate 25th and 75th percentiles
p25 = ta.percentile_linear_interpolation(haClose, lookback, 28)
p75 = ta.percentile_linear_interpolation(haClose, lookback, 78)

// Generate buy/sell signals
longSignal = ta.crossover(haClose, p75) and haClose > yellowLine
sellSignal = ta.crossunder(haClose, yellowLine)
longSignal1 = ta.crossover(haClose, p75) and haClose > purplLine
sellSignal1 = ta.crossunder(haClose, purplLine)

// Set start time and trade conditions
if(time >= startDate)
    // When longSignal is true, enter a long trade and set stop loss and trailing stop conditions
    if (longSignal)
        strategy.entry("Long", strategy.long, 1)
        strategy.exit("Sell", "Long", stop=close*(1-stopLossPercentage/100), trail_points=close*trailStopPercentage/100, trail_offset=close*trailStopPercentage/100)
    // When sellSignal is true, close the long trade
    if (sellSignal)
        strategy.close("Long")
    // When sellSignal1 is true, enter a short trade
    if (sellSignal1)
        strategy.entry("Short", strategy.short, 1)
    // When longSignal1 is true, close the short trade
    if (longSignal1)
        strategy.close("Short")

// Plot Heikin Ashi candles
plotcandle(haOpen, haHigh, haLow, haClose, title="Heikin Ashi", color=(haClose >= haOpen ? color.rgb(1, 168, 6) : color.rgb(176, 0, 0)))

// Plot 25th and 75th percentile levels
plot(p25, title="25th Percentile", color=color.green, linewidth=1, style=plot.style_circles)
plot(p75, title="75th Percentile", color=color.red, linewidth=1, style=plot.style_circles)

// Plot Moving Averages
plot(yellowLine, color = color.rgb(254, 242, 73, 2), linewidth = 2, style = plot.style_stepline)
plot(purplLine, color = color.rgb(255, 77, 234, 2), linewidth = 2, style = plot.style_stepline)