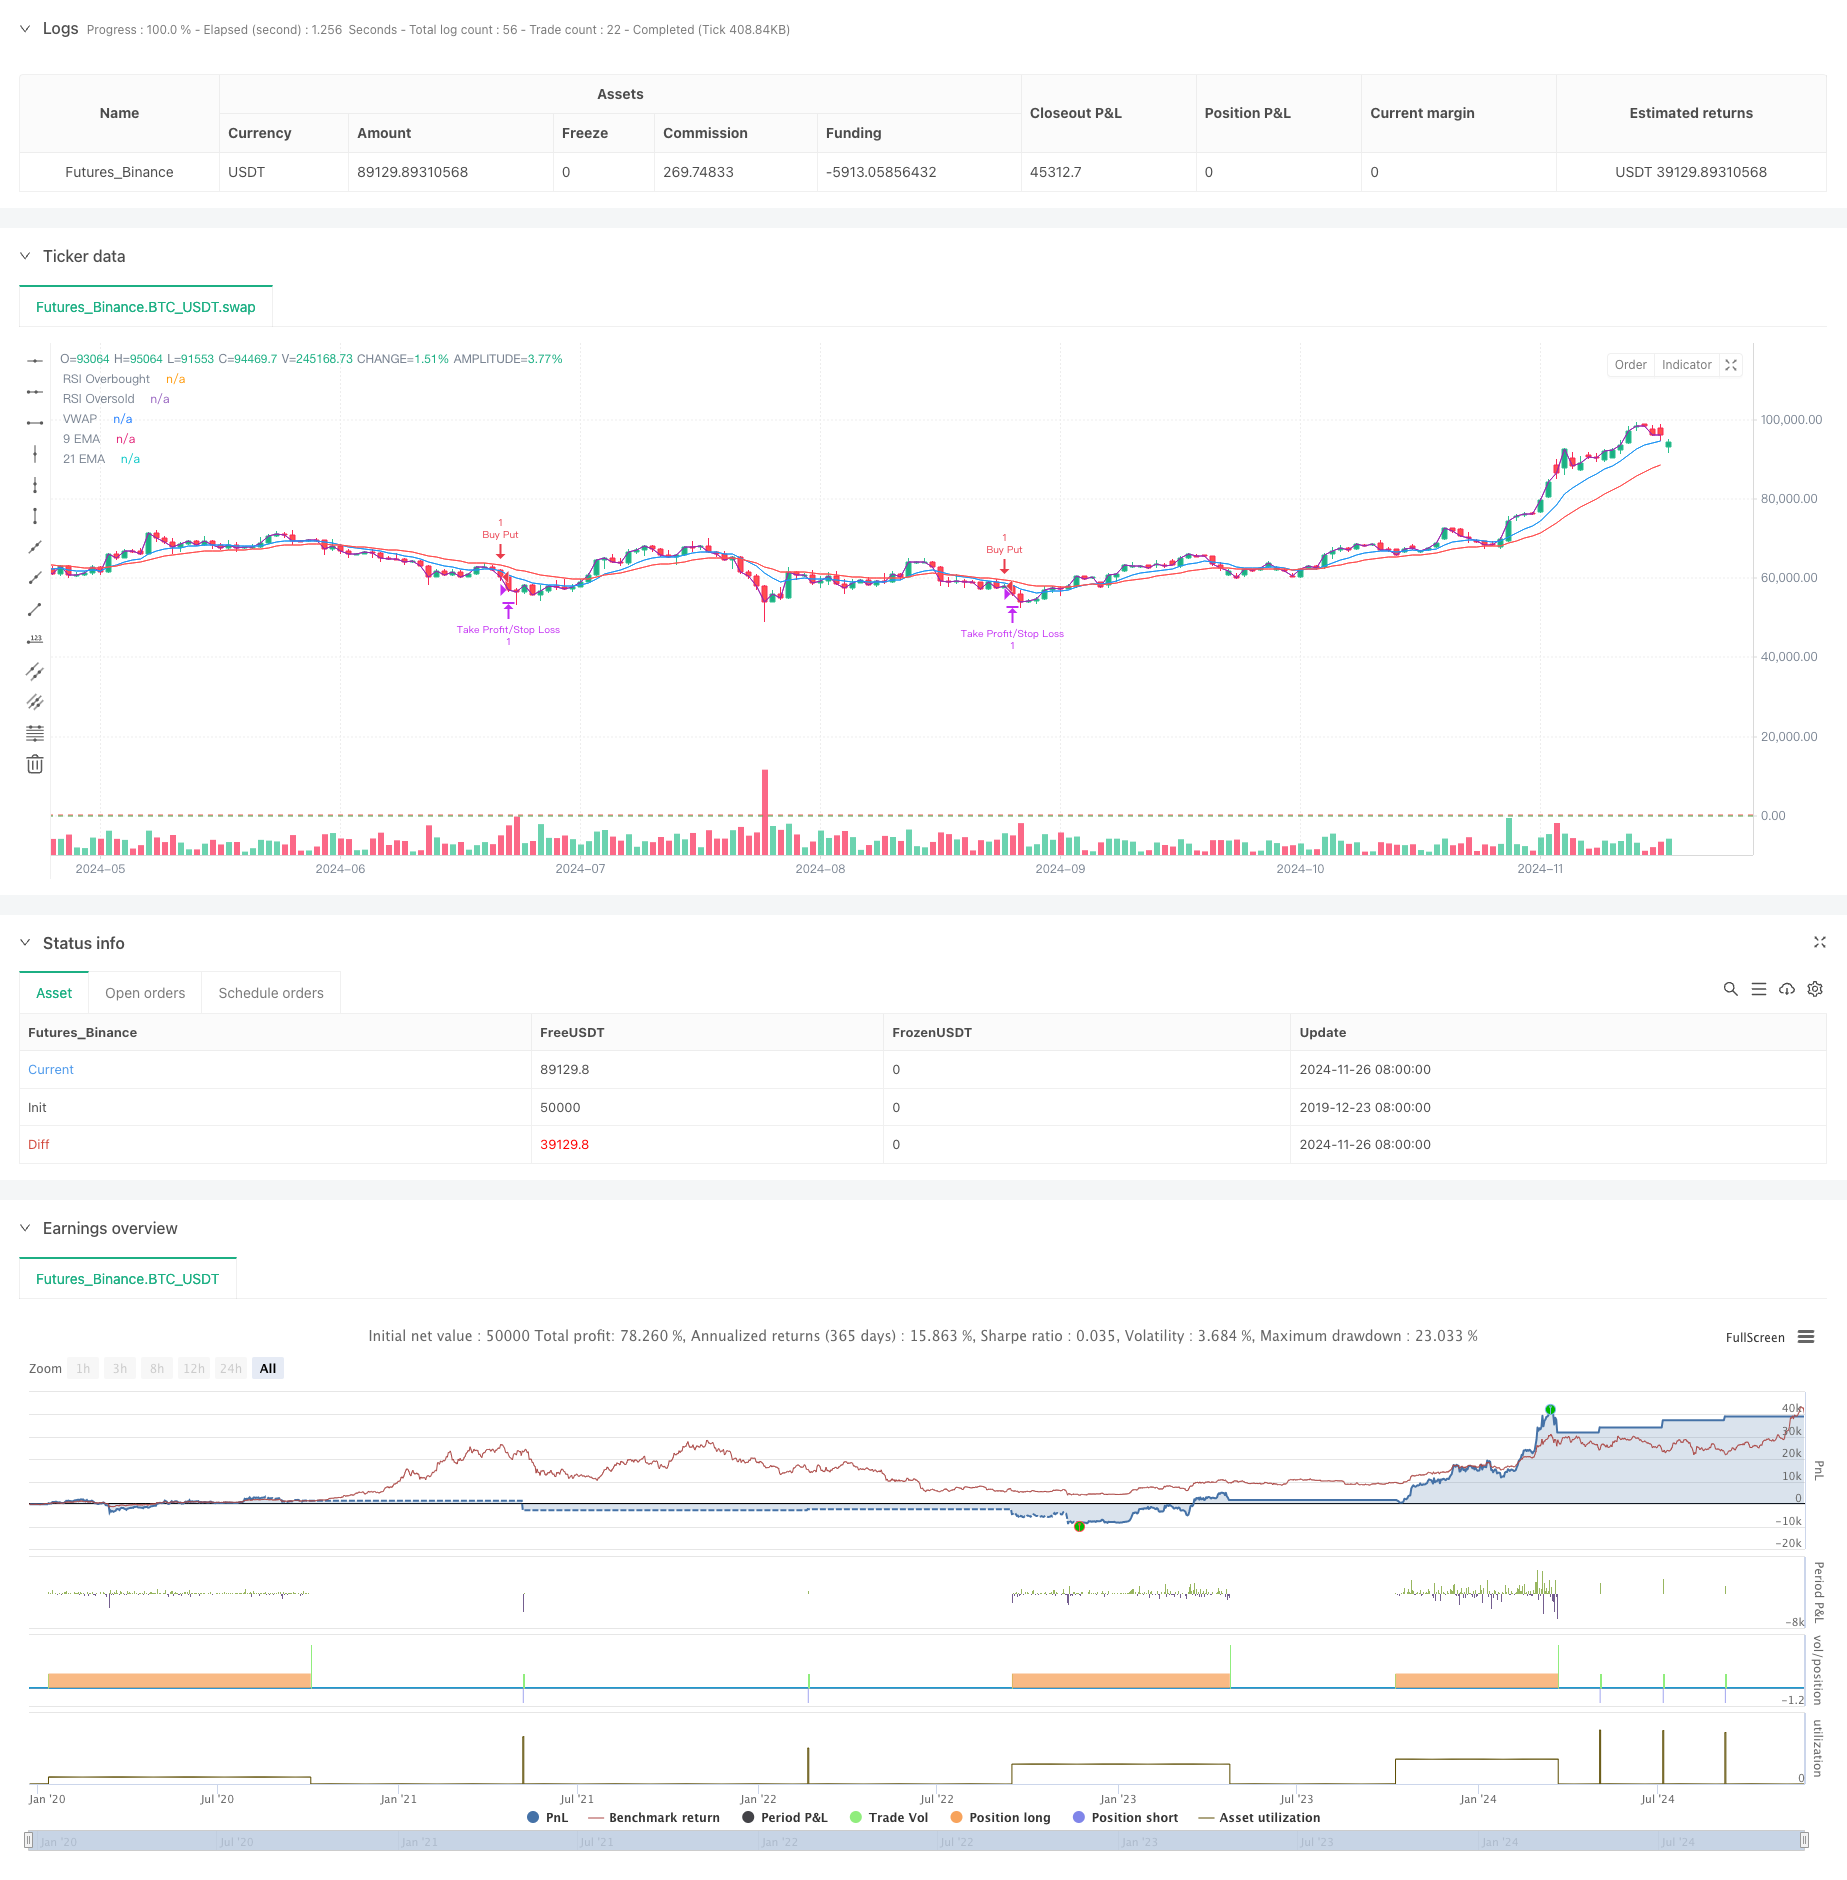
ওভারভিউ
এই কৌশলটি একটি উচ্চ-ফ্রিকোয়েন্সি ট্রেডিং সিস্টেম যা একাধিক প্রযুক্তিগত সূচকের উপর ভিত্তি করে, একটি 5-মিনিট সময় ফ্রেম ব্যবহার করে, সমান্তরাল সিস্টেম, গতিশীল সূচক এবং লেনদেনের পরিমাণ বিশ্লেষণের সাথে মিলিত। এই কৌশলটি বাজারের ওঠানামার সাথে সামঞ্জস্যপূর্ণ, একাধিক সংকেত নিশ্চিতকরণ ব্যবহার করে যাতে লেনদেনের নির্ভুলতা এবং নির্ভরযোগ্যতা বৃদ্ধি পায়। কৌশলটির মূলটি হ’ল স্বল্প-মেয়াদী বাজারের প্রবণতা ক্যাপচার করার জন্য একটি বহুমুখী প্রযুক্তিগত সূচকের সমন্বয়, যখন গতিশীল স্টপ লস ব্যবহার করা হয় ঝুঁকি নিয়ন্ত্রণের জন্য।
কৌশল নীতি
কৌশলটি দ্বি-উপমাংশের সিস্টেম ((৯-চক্র এবং ২১-চক্রের ইএমএ) ব্যবহার করে এবং আরএসআই সূচকগুলির সাথে মিলিত গতিশীলতা নিশ্চিত করে। যখন দাম দ্বি-উপমাংশের উপরে থাকে এবং আরএসআই 40-65 এর মধ্যে থাকে, তখন সিস্টেমটি আরও বেশি সুযোগের সন্ধান করে; যখন দাম দ্বি-উপমাংশের নীচে থাকে এবং আরএসআই 35-60 এর মধ্যে থাকে, তখন সিস্টেমটি খালি সুযোগের সন্ধান করে। একই সাথে, কৌশলটি একটি লেনদেনের নিশ্চিতকরণ ব্যবস্থা প্রবর্তন করে, যার জন্য বর্তমান লেনদেনের পরিমাণ 20 চক্রের চলমান গড় লেনদেনের 1.2 গুণ বেশি হওয়া দরকার। ভিডাব্লুএপি ব্যবহার আরও নিশ্চিত করে যে ট্রেডিংয়ের দিকটি দিনের মূলধারার প্রবণতাগুলির সাথে সামঞ্জস্যপূর্ণ।
কৌশলগত সুবিধা
- মাল্টি সিগন্যাল কনফার্মেশন মেকানিজম ব্যবসায়ের নির্ভরযোগ্যতা উল্লেখযোগ্যভাবে উন্নত করেছে
- ডায়নামিক স্টপ লস সেটিং বিভিন্ন বাজারের অবস্থার সাথে মানিয়ে নিতে সক্ষম
- প্রান্তিক অঞ্চলে লেনদেন এড়ানোর জন্য একটি সংরক্ষণশীল আরএসআই থ্রেশহোল্ড ব্যবহার করুন
- ভুয়া সংকেত ফিল্টার করে ডেলিভারি নিশ্চিতকরণ ব্যবস্থা কার্যকর
- ভিডাব্লুএপি ব্যবহার মূলধনের সাথে লেনদেনের দিকনির্দেশনা নিশ্চিত করতে সহায়তা করে
- দ্রুত প্রতিক্রিয়াশীল সমান্তরাল সিস্টেমগুলি স্বল্পমেয়াদী বাজারের সুযোগগুলি ধরার জন্য উপযুক্ত
কৌশলগত ঝুঁকি
- মার্কেটে ঘন ঘন মিথ্যা সংকেত সৃষ্টি করতে পারে
- একাধিক শর্তাদির সীমাবদ্ধতা কিছু ব্যবসায়ের সুযোগ হারাতে পারে
- উচ্চ ফ্রিকোয়েন্সির লেনদেনের জন্য উচ্চতর লেনদেনের খরচ হতে পারে
- বাজার দ্রুত পরিবর্তনের সময় প্রতিক্রিয়াশীল হতে পারে
- ট্রেডিং ডেটার জন্য উচ্চতর রিয়েল-টাইম প্রয়োজনীয়তা
কৌশল অপ্টিমাইজেশনের দিকনির্দেশনা
- স্বনির্ধারিত প্যারামিটার সমন্বয় ব্যবস্থা চালু করা, যাতে কৌশলগুলি বাজারের অবস্থার সাথে সামঞ্জস্য রেখে সূচক প্যারামিটারগুলিকে পরিবর্তন করতে পারে
- বিভিন্ন বাজারের পরিস্থিতিতে বিভিন্ন ট্রেডিং কৌশল ব্যবহারের জন্য মার্কেট এনভায়রনমেন্ট আইডেন্টিফিকেশন মডিউল যুক্ত করা
- আপেক্ষিক ট্র্যাফিক বা ট্র্যাফিক প্রোফাইল বিশ্লেষণ ব্যবহার করে ট্র্যাফিক ফিল্টারিং শর্তগুলি অপ্টিমাইজ করা যায়
- ট্র্যাকিং স্টপ লস ফাংশন যোগ করার জন্য ক্ষতি বন্ধ করার প্রক্রিয়া উন্নত করা
- লেনদেনের সময় ফিল্টার যুক্ত করুন, বড় আকারের ওঠানামা এবং বন্ধের সময়গুলি এড়িয়ে চলুন
সারসংক্ষেপ
এই কৌশলটি একাধিক প্রযুক্তিগত সূচকগুলির সমন্বয় ব্যবহার করে একটি অপেক্ষাকৃত সম্পূর্ণ ট্রেডিং সিস্টেম তৈরি করে। কৌশলটির সুবিধা হল এর বহু-মাত্রিক সংকেত নিশ্চিতকরণ প্রক্রিয়া এবং গতিশীল ঝুঁকি নিয়ন্ত্রণ পদ্ধতি। যদিও কিছু সম্ভাব্য ঝুঁকি রয়েছে, তবে যুক্তিসঙ্গত প্যারামিটার অপ্টিমাইজেশন এবং ঝুঁকি পরিচালনার মাধ্যমে কৌশলটির এখনও ভাল ব্যবহারের মূল্য রয়েছে। ব্যবসায়ীদেরকে রিয়েল-টাইমে ব্যবহারের আগে পর্যাপ্ত ফিডব্যাক করার পরামর্শ দেওয়া হয় এবং নির্দিষ্ট বাজারের পরিস্থিতি অনুসারে যথাযথ প্যারামিটার সামঞ্জস্য করা হয়।
/*backtest
start: 2019-12-23 08:00:00
end: 2024-11-27 00:00:00
period: 1d
basePeriod: 1d
exchanges: [{"eid":"Futures_Binance","currency":"BTC_USDT"}]
*/

//@version=5
strategy("Optimized Nifty MidCap Select Options 5-min Intraday Strategy", overlay=true)

// Parameters
emaShortPeriod = input.int(9, title="Short EMA")
emaLongPeriod = input.int(21, title="Long EMA")
rsiPeriod = input.int(14, title="RSI Period")
rsiOverbought = input.int(65, title="RSI Overbought Level") // More conservative than 70
rsiOversold = input.int(35, title="RSI Oversold Level") // More conservative than 30
atrLength = input.int(14, title="ATR Length")
atrMultiplier = input.float(1.5, title="ATR Multiplier")
volumeMultiplier = input.float(1.2, title="Volume Multiplier") // For confirming high-volume trades

// EMA Calculation
emaShort = ta.ema(close, emaShortPeriod)
emaLong = ta.ema(close, emaLongPeriod)

// RSI Calculation
rsiValue = ta.rsi(close, rsiPeriod)

// ATR Calculation
atrValue = ta.atr(atrLength)

// VWAP Calculation
vwapValue = ta.vwap(close)

// Volume Check
volumeCondition = volume > ta.sma(volume, 20) * volumeMultiplier

// Define long and short conditions

// Long Condition:
// Price above both EMAs, RSI not overbought, price above VWAP, and high volume
longCondition = (close > emaShort) and (close > emaLong) and (rsiValue > 40 and rsiValue < rsiOverbought) and (close > vwapValue) and volumeCondition

// Short Condition:
// Price below both EMAs, RSI not oversold, price below VWAP, and high volume
shortCondition = (close < emaShort) and (close < emaLong) and (rsiValue < 60 and rsiValue > rsiOversold) and (close < vwapValue) and volumeCondition

// Entry logic
if (longCondition)
    strategy.entry("Buy Call", strategy.long)
if (shortCondition)
    strategy.entry("Buy Put", strategy.short)

// Dynamic Take Profit and Stop Loss based on ATR
takeProfitLevel = strategy.position_avg_price * (1 + atrValue * atrMultiplier / 100)
stopLossLevel = strategy.position_avg_price * (1 - atrValue * atrMultiplier / 100)

// Exit strategy based on ATR levels
strategy.exit("Take Profit/Stop Loss", from_entry="Buy Call", limit=takeProfitLevel, stop=stopLossLevel)
strategy.exit("Take Profit/Stop Loss", from_entry="Buy Put", limit=takeProfitLevel, stop=stopLossLevel)

// Plotting indicators
plot(emaShort, title="9 EMA", color=color.blue)
plot(emaLong, title="21 EMA", color=color.red)
hline(rsiOverbought, "RSI Overbought", color=color.red)
hline(rsiOversold, "RSI Oversold", color=color.green)
plot(vwapValue, title="VWAP", color=color.purple)