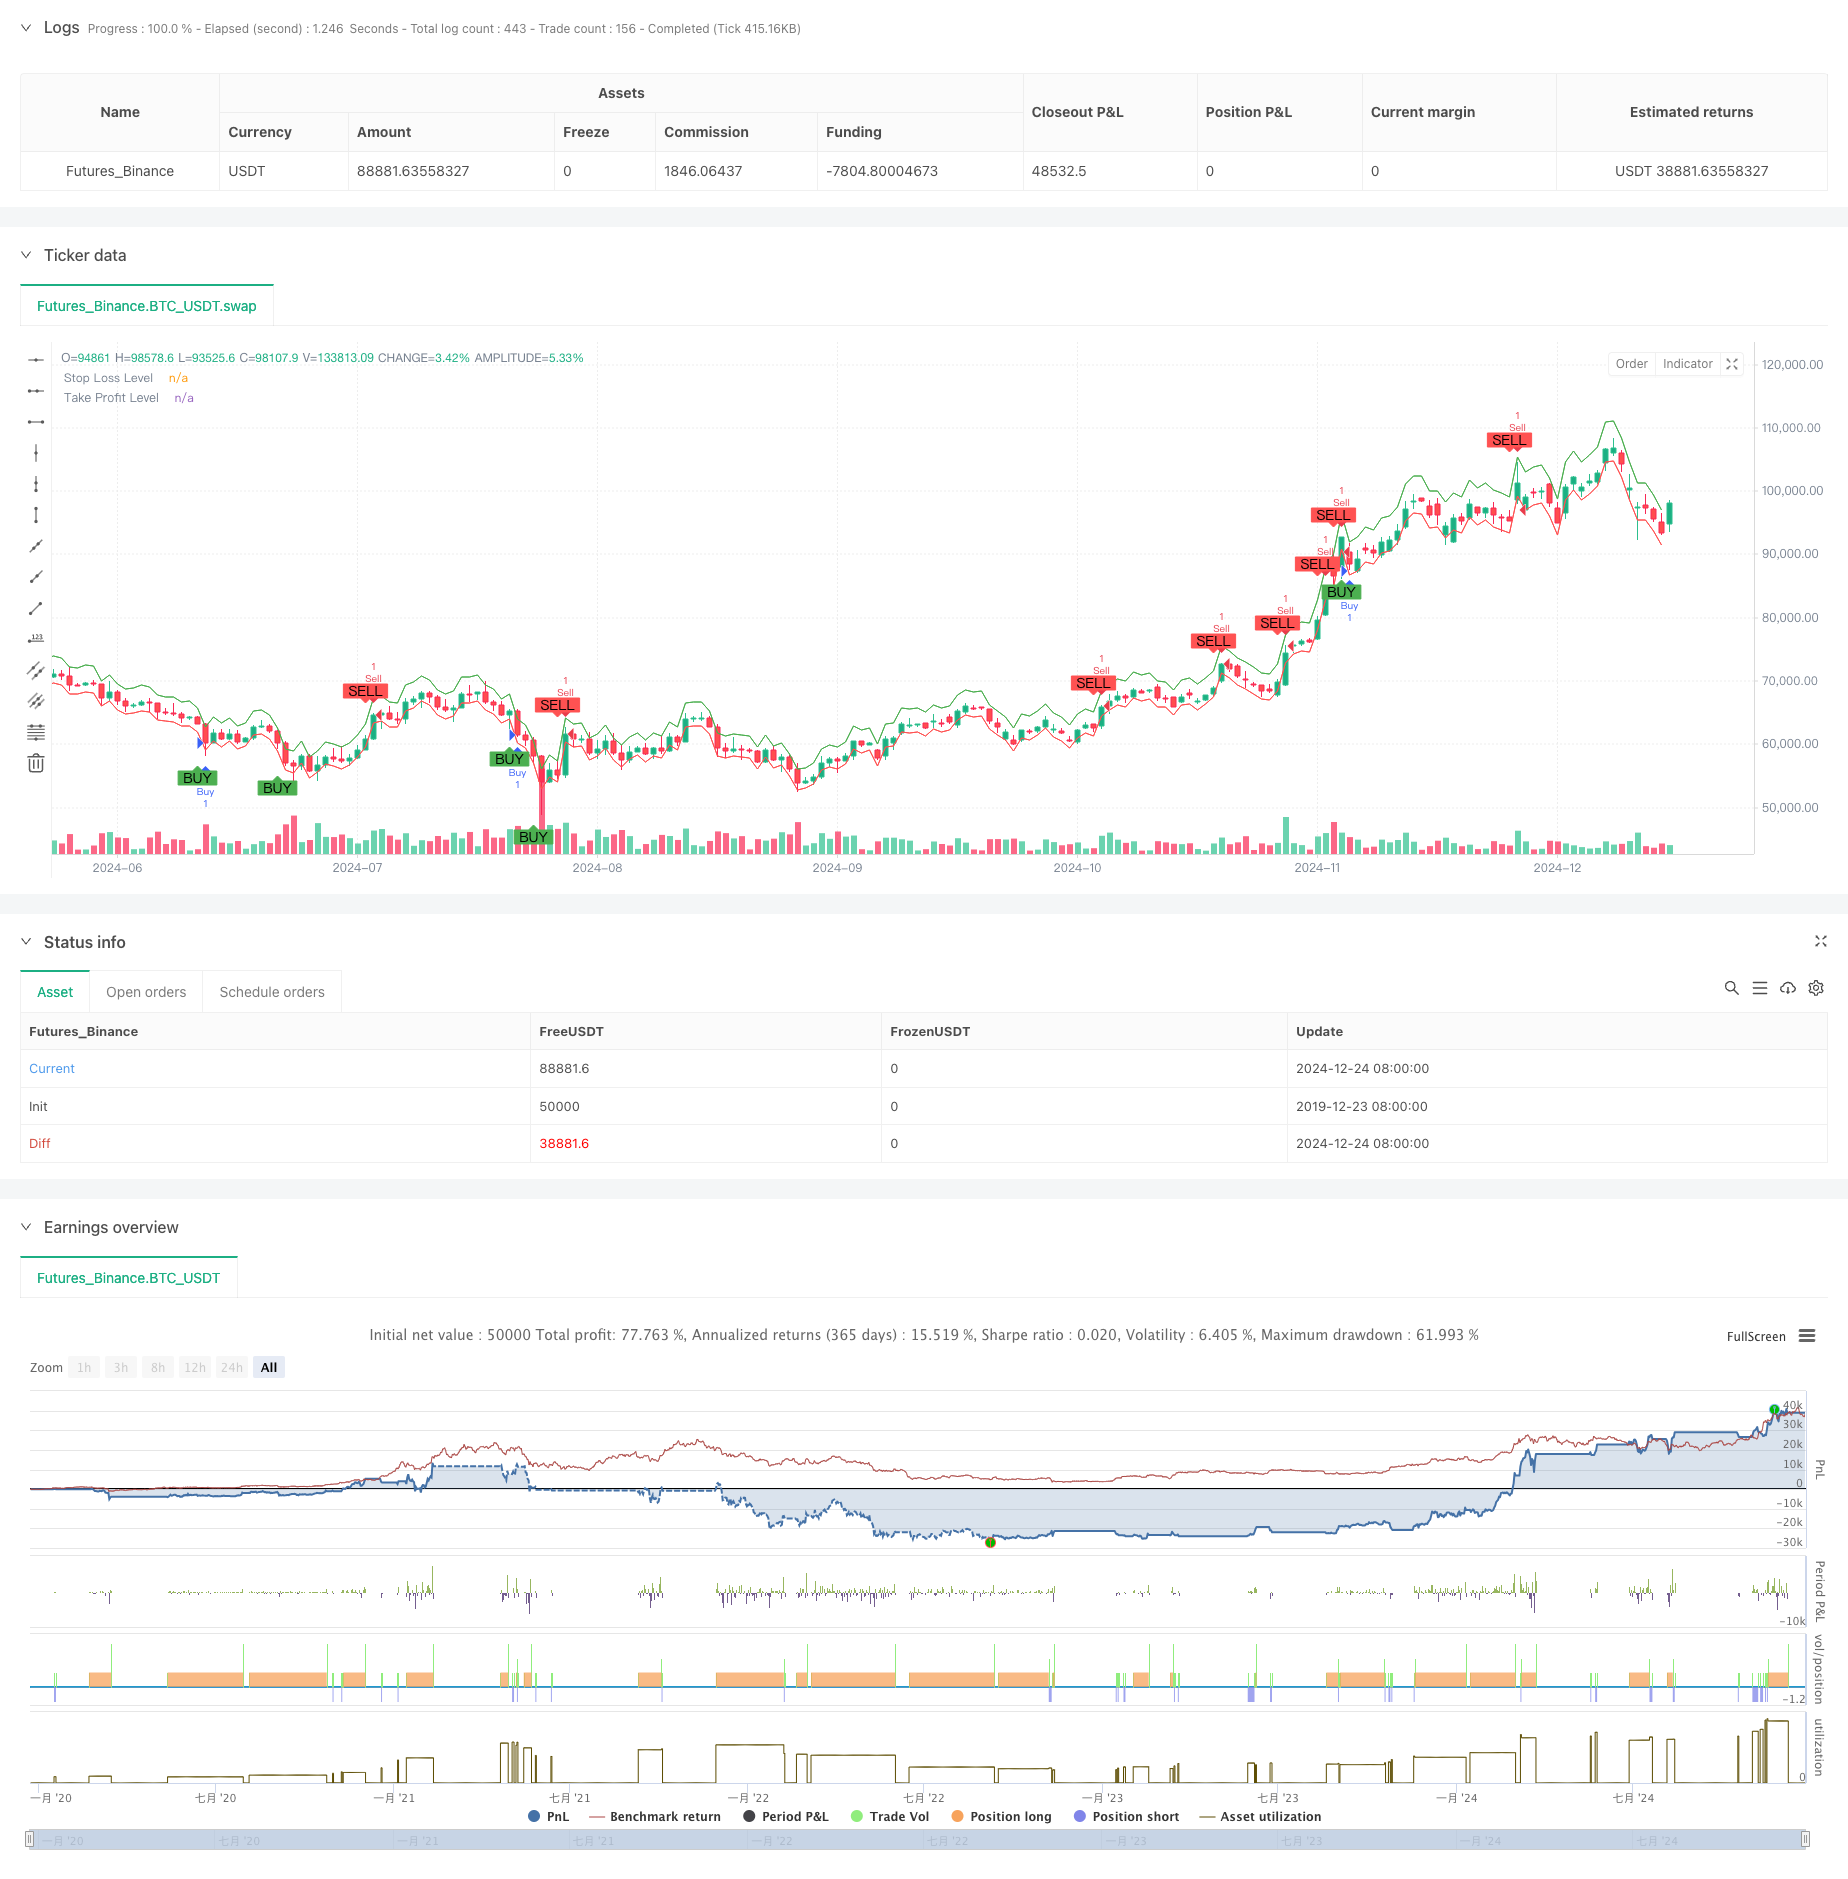
ওভারভিউ
এই কৌশলটি একটি স্বনির্ধারিত ট্রেডিং সিস্টেম যা Shiryaev-Zhou সূচক ((SZI) এর উপর ভিত্তি করে তৈরি করা হয়েছে। এটি ওভারবয় এবং ওভারসেলিং মার্কেটের অবস্থা সনাক্ত করে এবং দামের গড় রিটার্নের সুযোগকে ধরে রাখে। কৌশলটি গতিশীল স্টপ লস এবং লাভের লক্ষ্যকে একত্রিত করে এবং ঝুঁকির উপর সুনির্দিষ্ট নিয়ন্ত্রণ অর্জন করে।
কৌশল নীতি
কৌশলটির কেন্দ্রবিন্দু হল সমান্তরাল রিটার্ন হারের রোলিং পরিসংখ্যানগত বৈশিষ্ট্য দ্বারা মানসম্মত সূচকগুলি তৈরি করা। নিম্নলিখিত পদক্ষেপগুলি অনুসরণ করেঃ
- জোড়ার হার হিসাব করে, যার ফলে ফলন হারের সঠিক প্রক্রিয়াকরণ হয়
- রোলিং গড় এবং স্ট্যান্ডার্ড ডিভার্জেন্স গণনা করা হয় ৫০ চক্রের উইন্ডোতে
- এসজিআই সূচকটি তৈরি করুনঃ (অ্যারেঞ্জার রিটার্ন রেট - রোলিং গড়) / রোলিং স্ট্যান্ডার্ড ডিভার্জ
- যখন SZI ২.০ এর নিচে থাকে তখন একটি মাল্টি সিগন্যাল তৈরি হয়, ২.০ এর উপরে একটি ফাঁকা সিগন্যাল তৈরি হয়
- প্রবেশ মূল্যের উপর ভিত্তি করে 2% স্টপ লস এবং 4% স্টপ স্টপ লেভেল সেট করুন
কৌশলগত সুবিধা
- দৃঢ় তাত্ত্বিক ভিত্তিঃ সমান্তরাল সঠিক বন্টন অনুমান উপর ভিত্তি করে, ভাল পরিসংখ্যান সমর্থন
- স্বনির্ধারিতঃ রোলিং উইন্ডো গণনার মাধ্যমে বাজারের অস্থিরতার বৈশিষ্ট্যগুলির পরিবর্তনের সাথে খাপ খাইয়ে নিতে সক্ষম
- ঝুঁকি নিয়ন্ত্রণের দক্ষতাঃ শতকরা হার বন্ধ করার কৌশল ব্যবহার করে প্রতিটি লেনদেনের ঝুঁকি সঠিকভাবে নিয়ন্ত্রণ করা যায়
- ভিজ্যুয়ালাইজেশন বন্ধুত্বপূর্ণঃ ট্রেডিং সিগন্যাল এবং ঝুঁকি নিয়ন্ত্রণের স্তরটি চার্টগুলিতে পরিষ্কারভাবে চিহ্নিত করুন
কৌশলগত ঝুঁকি
- প্যারামিটার সংবেদনশীলতাঃ রোলিং উইন্ডোর দৈর্ঘ্য এবং থ্রেশহোল্ডের পছন্দগুলি কৌশলটির কার্যকারিতা উল্লেখযোগ্যভাবে প্রভাবিত করে
- বাজারের পরিবেশের উপর নির্ভরশীলতাঃ ট্রেন্ডিং বাজারে প্রায়শই মিথ্যা সংকেত তৈরি হতে পারে
- স্লাইড পয়েন্ট প্রভাবঃ তীব্র অস্থিরতার সময়, প্রকৃত লেনদেনের দামগুলি আদর্শ স্তরের থেকে উল্লেখযোগ্যভাবে বিচ্যুত হতে পারে
- গণনা বিলম্বঃ রিয়েল-টাইম গণনা পরিসংখ্যান সূচক কিছু সংকেত বিলম্ব হতে পারে
কৌশল অপ্টিমাইজেশনের দিকনির্দেশনা
- ডায়নামিক থ্রেশহোল্ডঃ বাজারের অস্থিরতার সাথে ডায়নামিকভাবে সংকেত থ্রেশহোল্ডের পরিবর্তন বিবেচনা করা যেতে পারে
- একাধিক সময়কালঃ একাধিক সময়কালের সাথে সংকেত নিশ্চিতকরণ ব্যবস্থা
- অস্থিরতা ফিল্টারঃ চরম অস্থিরতার সময় ট্রেডিং স্থগিত করা বা অবস্থানগুলি সামঞ্জস্য করা
- সিগন্যাল নিশ্চিতকরণঃ ট্র্যাফিক ভলিউম, গতিশীলতা ইত্যাদি সহায়ক সূচকগুলির জন্য সিগন্যাল নিশ্চিতকরণ
- পজিশন ম্যানেজমেন্টঃ অস্থিরতার উপর ভিত্তি করে গতিশীল পজিশন ম্যানেজমেন্ট
সারসংক্ষেপ
এটি একটি পরিমাপযোগ্য ট্রেডিং কৌশল যা দৃঢ় পরিসংখ্যানের উপর ভিত্তি করে তৈরি করা হয়, যা মানক সমান্তরাল মুনাফা দ্বারা মূল্যের ওঠানামার সুযোগকে ক্যাপচার করে। কৌশলটির প্রধান সুবিধাগুলি তার স্ব-অনুকূলতা এবং নিখুঁত ঝুঁকি নিয়ন্ত্রণের মধ্যে রয়েছে, তবে প্যারামিটার নির্বাচন এবং বাজারের পরিবেশের সাথে অভিযোজনযোগ্যতার ক্ষেত্রে এখনও অপ্টিমাইজেশনের জায়গা রয়েছে। গতিশীল হ্রাস এবং মাল্টি-ডাইমেনশনাল সিগন্যাল নিশ্চিতকরণ প্রক্রিয়া প্রবর্তনের মাধ্যমে কৌশলটির স্থায়িত্ব এবং নির্ভরযোগ্যতা আরও বাড়ানোর সম্ভাবনা রয়েছে।
/*backtest
start: 2019-12-23 08:00:00
end: 2024-12-25 08:00:00
period: 1d
basePeriod: 1d
exchanges: [{"eid":"Futures_Binance","currency":"BTC_USDT"}]
*/

//@version=5
strategy("Jalambi Paul model", overlay=true)

// Define the length for the rolling window
window = input.int(50, title="Window Length", minval=1)
threshold = 2.0 // Fixed threshold value
risk_percentage = input.float(1.0, title="Risk Percentage per Trade", step=0.1) / 100

// Calculate the logarithmic returns
log_return = math.log(close / close[1])

// Calculate the rolling mean and standard deviation
rolling_mean = ta.sma(log_return, window)
rolling_std = ta.stdev(log_return, window)

// Calculate the Shiryaev-Zhou Index (SZI)
SZI = (log_return - rolling_mean) / rolling_std

// Generate signals based on the fixed threshold
long_signal = SZI < -threshold
short_signal = SZI > threshold

// Plot the signals on the main chart (overlay on price)
plotshape(series=long_signal, location=location.belowbar, color=color.green, style=shape.labelup, title="Buy Signal", text="BUY", offset=-1)
plotshape(series=short_signal, location=location.abovebar, color=color.red, style=shape.labeldown, title="Sell Signal", text="SELL", offset=-1)

// Strategy logic: Buy when SZI crosses below the negative threshold, Sell when it crosses above the positive threshold
if (long_signal)
    strategy.entry("Buy", strategy.long, comment="Long Entry")

if (short_signal)
    strategy.entry("Sell", strategy.short, comment="Short Entry")

// Calculate the stop loss and take profit levels based on the percentage of risk
stop_loss_pct = input.float(2.0, title="Stop Loss (%)") / 100
take_profit_pct = input.float(4.0, title="Take Profit (%)") / 100

// Set the stop loss and take profit levels based on the entry price
strategy.exit("Take Profit / Stop Loss", "Buy", stop=close * (1 - stop_loss_pct), limit=close * (1 + take_profit_pct))
strategy.exit("Take Profit / Stop Loss", "Sell", stop=close * (1 + stop_loss_pct), limit=close * (1 - take_profit_pct))

// Plot the stop loss and take profit levels for visualization (optional)
plot(stop_loss_pct != 0 ? close * (1 - stop_loss_pct) : na, color=color.red, linewidth=1, title="Stop Loss Level")
plot(take_profit_pct != 0 ? close * (1 + take_profit_pct) : na, color=color.green, linewidth=1, title="Take Profit Level")