Tom DeMark Sequentielle Wärmekarte
Schriftsteller:ChaoZhang, Datum: 2022-05-08 17:19:47Tags:Trends
Dieser Indikator verwendet Tom DeMark's TD Sequential Zählung von 1 bis 13.
Die Zahlen 9 und 13 kennzeichnen in der Regel einen ausgelaufenen Trend und markieren eine Trendumkehr.
Die wichtigen Zahlen werden als Etiketten angezeigt (7-13), wobei 9 und 13 beide als
Neben den Zahlen sind die Preiskündeln nach der Reihenfolge gefärbt. Die bullischen Farben reichen von hellgelb (TD 1 = Beginn des Trends) bis dunkelrot (TD 13 = Trend erschöpft) Die Bärenfarben gehen von hellblau (TD 1 = Beginn des Trends) bis dunkelblau (TD 13 = Trend erschöpft)
DeMark empfiehlt, nur für kurzfristige Preisumkehrungen verwendet zu werden, aber wie Sie in der Grafik sehen können, funktioniert es auch für LUNA 1D-Grafik. Funktioniert auch sehr gut mit Heikin Ashi Kerzen.
Verwenden Sie es in Kombination mit z.B. dem
Wenn Sie irgendeine Idee haben, wie man den Code optimiert, bitte freuen Sie sich zu teilen
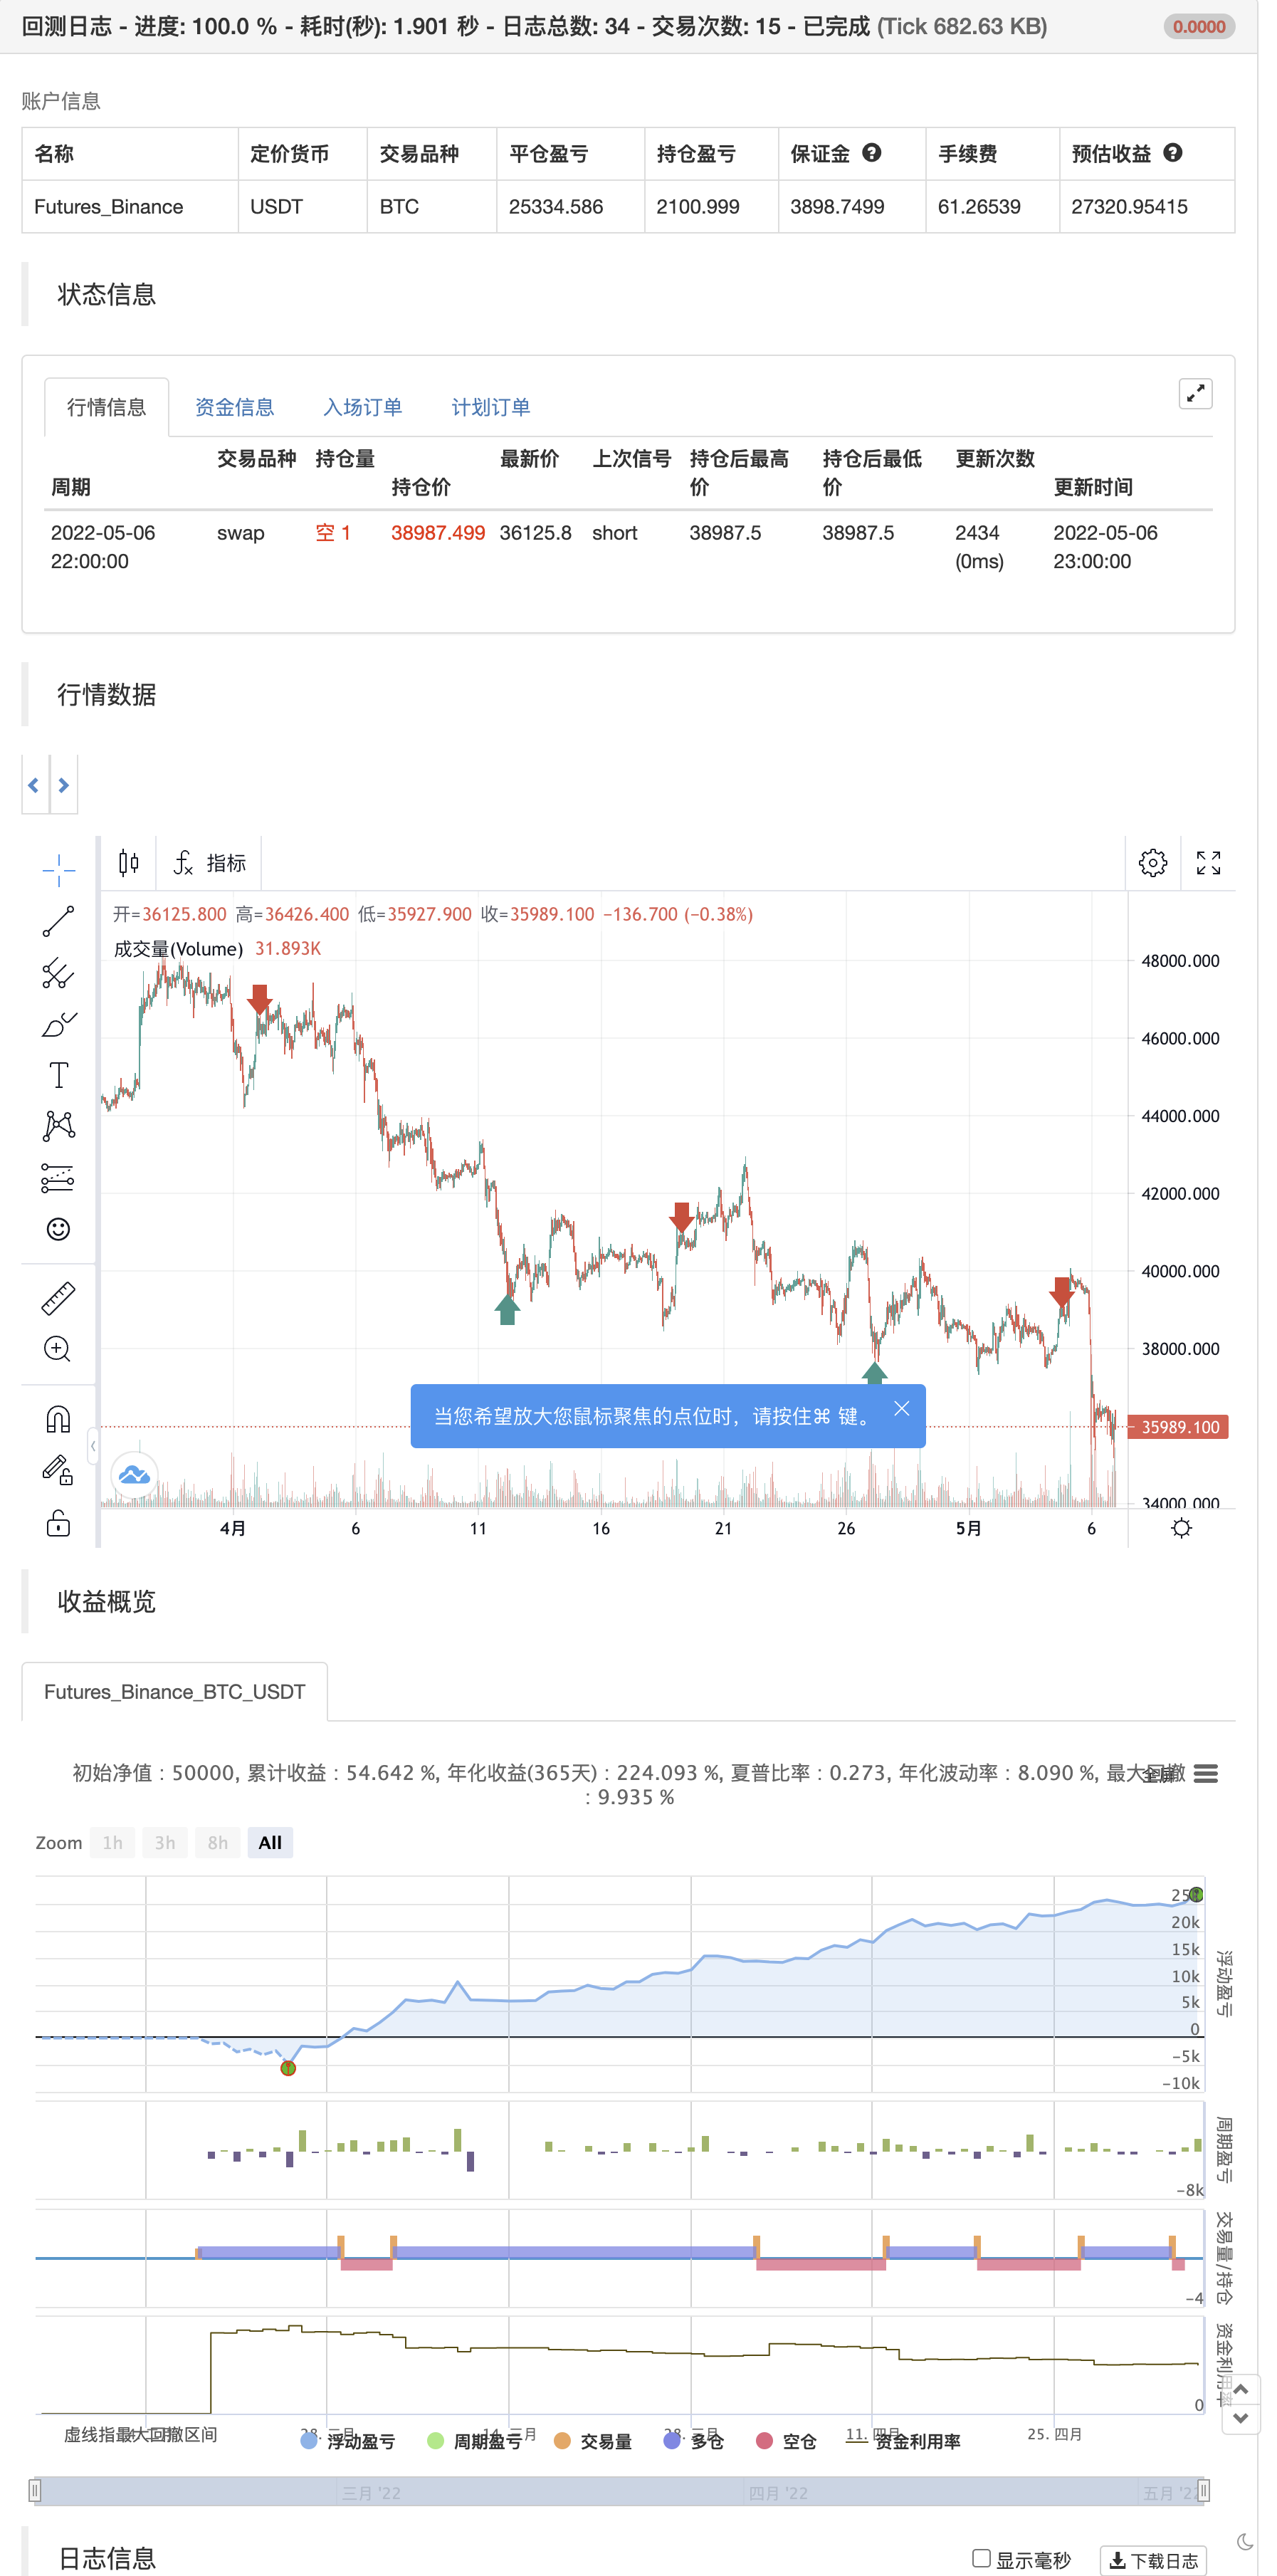
Zurückprüfung

////////////////////////////////////////// Tom DeMark heatmap © by Indicator-Jones /////////////////////////////////////////
//
// This indicator uses Tom DeMark’s TD Sequential counting from 1 to 13.
// Number 9 and 13 usually identify an exhausted trend and mark trend reversal.
// The important numbers get displayed as labels (7-13), where 9 and 13 are both highlighted as "Long" or "Short".
// Besides the numbers the price candles are colored based upon the sequence.
// Bullish colors are starting from bright yellow (TD 1 = start of trend) to dark red (TD 13 = trend exhausted)
// Bearish colors are starting from bright blue (TD 1 = start of trend) to dark blue (TD 13 = trend exhausted)
//
// DeMark recommends to be used for short term price reversals only but as you can see in the chart, it also works for LUNA 1D chart.
// Also works very well with Heikin Ashi candles.
// Use it in combination with for example the "Tom DeMark Pressure Ratio" to find tops and bottoms.
// You can change the timeframes, disable lables/barcolor and customise colors to your liking.
//
// If you have any idea on how to optimise the code, please feel free to share :)
//
// Inspired by "Stochastic Heat Map" from @Violent
//
////////////////////////////////////////////////////////////////////////////////////////////////////////////////////////////

//@version=5
indicator(title='Tom DeMark Sequential Heat Map', shorttitle='TD heatmap', overlay=true, timeframe='')
//A heat map for TD counts. If you find this useful or yank the code, please consider a donation :)

// -------- Inputs --------
paintBars = input(title='Paint Bars', defval=true)
showLabels = input(title='Show labels', defval=true)

buy_col = input(#32CD32,0,'Colors',inline='col')
sell_col = input(#F44336,0,'',inline='col')
text_col = input(#FFFFFF,0,'',inline='col')


// -------- Bearish trend (blue) color selection --------
getBuyColor(count) =>
    if count == 1
        color.new(#11e7f2,0)
    else
        if count == 2
            color.new(#11d9f2,0)
        else
            if count == 3
                color.new(#11cbf2,0)
            else
                if count == 4
                    color.new(#11aff2,0)
                else
                    if count == 5
                        color.new(#1193f2,0)
                    else
                        if count == 6
                            color.new(#1176f2,0)
                        else
                            if count == 7
                                color.new(#105df4,0)
                            else
                                if count == 8
                                    color.new(#1051f5,0)
                                else
                                    if count == 9
                                        color.new(#0f44f5,0)
                                    else
                                        if count == 10
                                            color.new(#0c3de0,0)
                                        else
                                            if count == 11
                                                color.new(#0935ca,0)
                                            else
                                                if count == 12
                                                    color.new(#062eb4,0)
                                                else
                                                    if count == 13
                                                        color.new(#02269e,0)

// -------- Bullish trend (blue) color selection --------
getSellColor(count) =>
    if count == 1
        color.new(#eef211,0)
    else
        if count == 2
            color.new(#efdc11,0)
        else
            if count == 3
                color.new(#f0c511,0)
            else
                if count == 4
                    color.new(#f1af11,0)
                else
                    if count == 5
                        color.new(#f29811,0)
                    else
                        if count == 6
                            color.new(#f28811,0)
                        else
                            if count == 7
                                color.new(#f27811,0)
                            else
                                if count == 8
                                    color.new(#f26811,0)
                                else
                                    if count == 9
                                        color.new(#f25811,0)
                                    else
                                        if count == 10
                                            color.new(#ea420d,0)
                                        else
                                            if count == 11
                                                color.new(#e12c09,0)
                                            else
                                                if count == 12
                                                    color.new(#d81605,0)
                                                else
                                                    if count == 13
                                                        color.new(#cf0000,0)

// -------- Calculate bearish trend sequence --------
buySetup = 0
buySetup := close < close[4] ? buySetup[1] == 13 ? 1 : buySetup[1] + 1 : 0


// -------- Calculate bullish trend sequence --------
sellSetup = 0
sellSetup := close > close[4] ? sellSetup[1] == 13 ? 1 : sellSetup[1] + 1 : 0


// -------- Paint bars --------
barColour = buySetup >= 1 ? getBuyColor(buySetup) : sellSetup >= 1 ? getSellColor(sellSetup) : na
//barcolor(paintBars ? barColour : na, title='Bar colors (heatmap)')


if buySetup == 13
    strategy.entry("Enter Long", strategy.long)
else if sellSetup == 13
    strategy.entry("Enter Short", strategy.short)
- Lineare Entwicklung
- Fibonacci-Zeitmuster
- Pivot-Trend
- Supertrend B
- KijunSen Linie mit Kreuz
- Diamanttrend
- Momentum 2.0
- Heikin-Aschi-Trend
- Demark-Umkehrpunkte
- Eine gerade Linie Trend Demo
- RSI MTF Ob+Os
- MACD-Willystrategie
- RSI - Kauf-Verkaufssignale
- Heikin-Aschi-Trend
- HA Marktverzerrung
- Ichimoku Wolken glatter Oszillator
- Williams %R - Glättet
- QQE MOD + SSL Hybrid + Waddah Attar Explosion
- Kauf/Verkauf von Strat
- Triple Supertrend mit EMA und ADX
- jma + dwma für Mehrkornprodukte
- MACD-Wert
- Z-Score mit Signalen
- Das ist eine sehr einfache Strategie für die Schwankungsrate.
- 3EMA + Boullinger + PIVOT
- Baguette nach Mehrkorn
- - Die Maschine.
- K-Umkehrindikator I
- Schwelende Kerzen
- MA Kaiser insilliconot