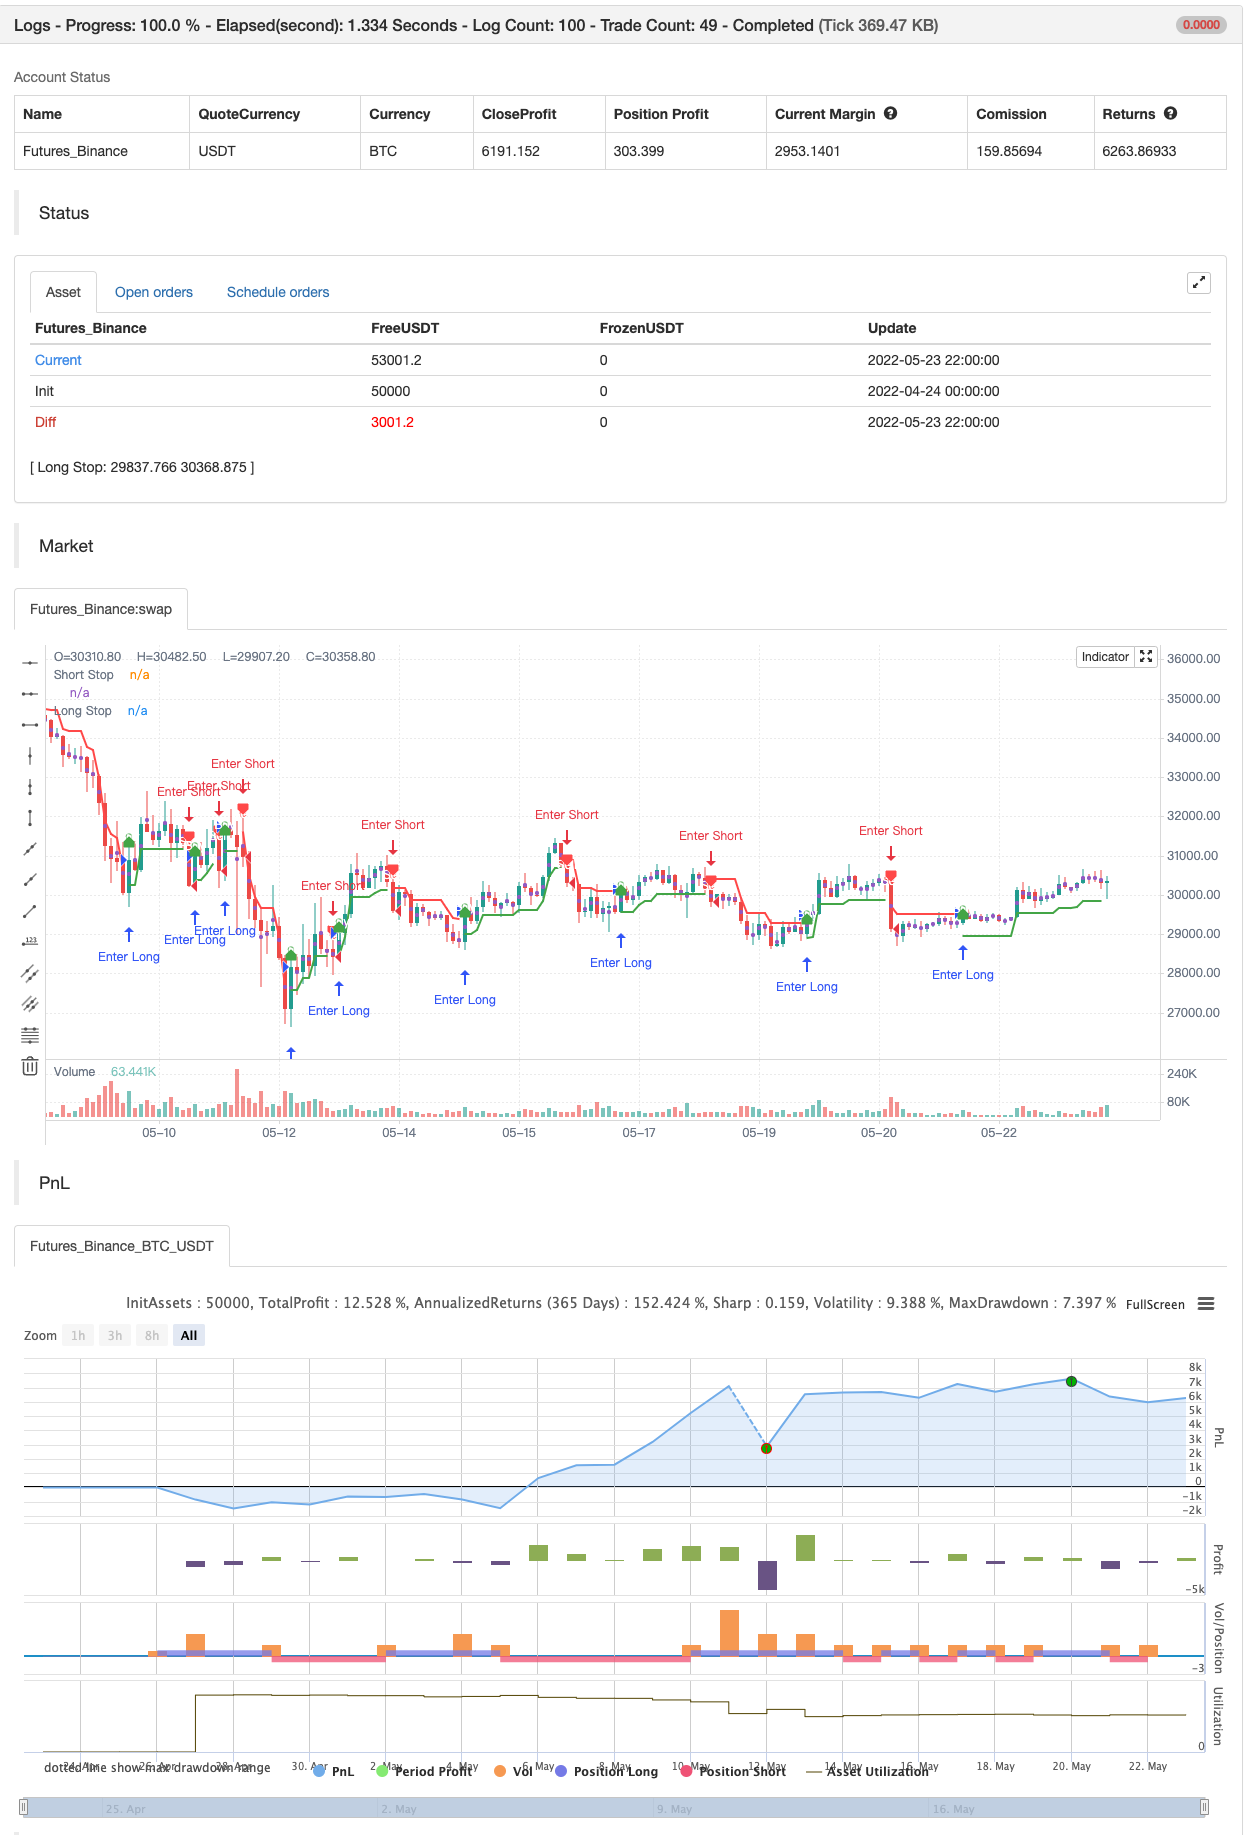
Nick Rypock nach hinten (NRTR)
Schriftsteller:ChaoZhang, Datum: 2022-05-25 18:14:32Tags:NRTR
Dieser Indikator wurde 2001 von Konstantin Kopyrkin erfunden. Der Name
Kopyrkin -> Kopyr Kin -> Kin Kopyr -> Nik Rypok
Die Idee des Indikators ist ähnlich dem Chandelier Exit, beinhaltet jedoch keine ATR-Komponente und verwendet stattdessen einen Prozentsatz.
Der NRTR wird durch einen dynamischen Preiskanal berechnet. Die Berechnungen umfassen nur die Preise, die in den aktuellen Trend einbezogen sind und die mit dem vorherigen Trend verbundenen Extreme ausschließen. Der Indikator befindet sich immer im selben Abstand (in Prozent) von den von den Preisen erreichten Extremen (unter dem maximalen Höchststand für den aktuellen Aufwärtstrend, über dem minimalen Boden für den aktuellen Abwärtstrend).
Zurückprüfung

/*backtest
start: 2022-04-24 00:00:00
end: 2022-05-23 23:59:00
period: 2h
basePeriod: 15m
exchanges: [{"eid":"Futures_Binance","currency":"BTC_USDT"}]
*/

//@version=4
// Copyright (c) 2021-present, Alex Orekhov (everget)
study("Nick Rypock Trailing Reverse", shorttitle="NRTR", overlay=true)

k = input(title="Coefficient of Correction, %", type=input.float, minval=0, maxval=100, step=0.1, defval=2)
showLabels = input(title="Show Buy/Sell Labels ?", type=input.bool, defval=true)
applyRibbon = input(title="Apply Ribbon ?", type=input.bool, defval=true)

var int trend = 0
var float hp = close
var float lp = close
float nrtr = close

percentage = k * 0.01

if trend >= 0
	if close > hp
		hp := close
		hp
	nrtr := hp * (1 - percentage)
	if close <= nrtr
		trend := -1
		lp := close
		nrtr := lp * (1 + percentage)
		nrtr
else
	if close < lp
		lp := close
		lp
	nrtr := lp * (1 + percentage)
	if close > nrtr
		trend := 1
		hp := close
		nrtr := hp * (1 - percentage)
		nrtr

var color longColor = color.green
var color shortColor = color.red
var color textColor = color.white

longStopPlot = plot(trend == 1 ? nrtr : na, title="Long Stop", style=plot.style_linebr, linewidth=2, color=longColor)
buySignal = trend == 1 and trend[1] == -1
plotshape(buySignal ? nrtr : na, title="Long Stop Start", location=location.absolute, style=shape.circle, size=size.tiny, color=longColor, transp=0)
plotshape(buySignal and showLabels ? nrtr : na, title="Buy Label", text="Buy", location=location.absolute, style=shape.labelup, size=size.tiny, color=longColor, textcolor=textColor, transp=0)

shortStopPlot = plot(trend == 1 ? na : nrtr, title="Short Stop", style=plot.style_linebr, linewidth=2, color=shortColor)
sellSignal = trend == -1 and trend[1] == 1
plotshape(sellSignal ? nrtr : na, title="Short Stop Start", location=location.absolute, style=shape.circle, size=size.tiny, color=shortColor, transp=0)
plotshape(sellSignal and showLabels ? nrtr : na, title="Sell Label", text="Sell", location=location.absolute, style=shape.labeldown, size=size.tiny, color=shortColor, textcolor=textColor, transp=0)

midPricePlot = plot(ohlc4, title="", style=plot.style_circles, linewidth=0, display=display.none, editable=false)

longFillColor = applyRibbon ? (trend == 1 ? longColor : na) : na
shortFillColor = applyRibbon ? (trend == -1 ? shortColor : na) : na
fill(midPricePlot, longStopPlot, title="Long Ribbon", color=longFillColor)
fill(midPricePlot, shortStopPlot, title="Short Ribbon", color=shortFillColor)

changeCond = trend != trend[1]
alertcondition(changeCond, title="Alert: NRTR Direction Change", message="NRTR has changed direction!")
alertcondition(buySignal, title="Alert: NRTR Buy", message="NRTR Buy!")
alertcondition(sellSignal, title="Alert: NRTR Sell", message="NRTR Sell!")


if buySignal
    strategy.entry("Enter Long", strategy.long)
else if sellSignal
    strategy.entry("Enter Short", strategy.short)
- Scalping EMA ADX RSI mit Kauf/Verkauf
- Volumendivergenz
- Super Trend täglich 2.0 BF
- Hull Moving Average Swing Trader
- FTSMA - Trend ist dein Freund
- Bereich Filter Kauf und Verkauf
- SSL-Kanal
- Strategie der Hull Suite
- Parabolische SAR Kauf und Verkauf
- Pivot-basierte Rücklaufmaxime und -minime
- ZigZag PA-Strategie V4.1
- Tagesakkauf/Verkauf
- Broken Fractal: Jemandes zerbrochener Traum ist dein Gewinn!
- Gewinnmaximierer PMax
- Eine makellose Siegstrategie
- Stochastic + RSI, doppelte Strategie
- Swing Hull/rsi/EMA-Strategie
- Scalping-Swing-Handelsmittel R1-4
- BESTE Verschlucken + Ausbruchstrategie
- Bollinger Awesome Warnung R1