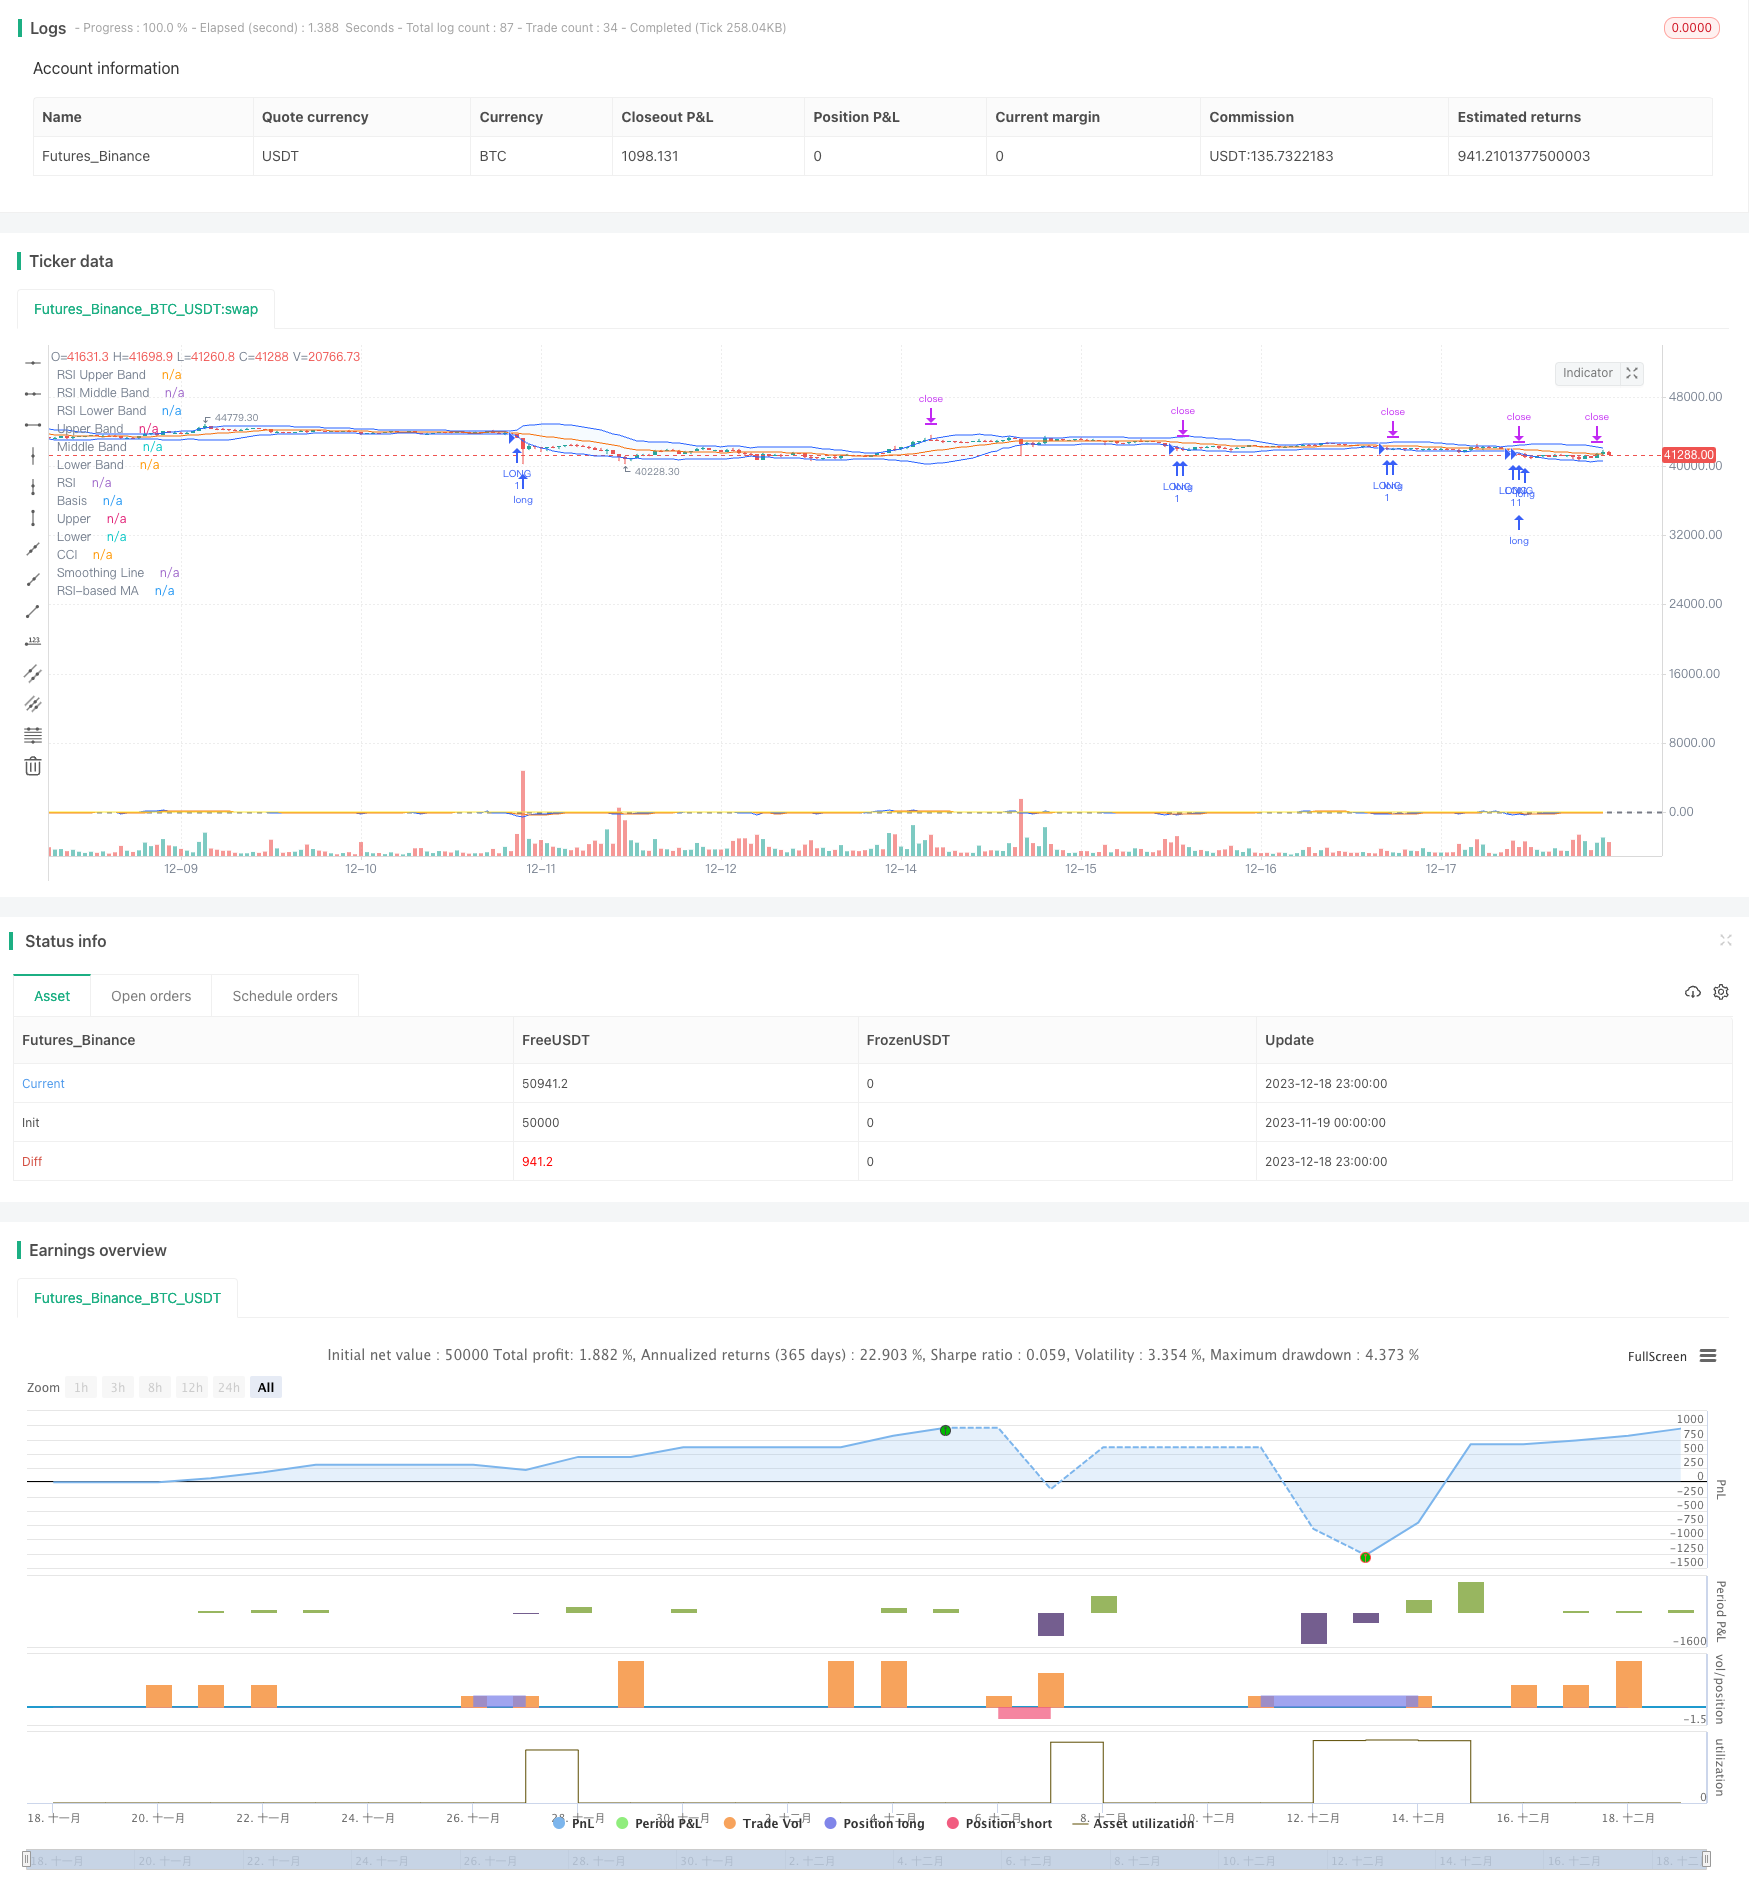
Quantitative Strategie: Bollinger Bands RSI CCI Crossover-Strategie
Schriftsteller:ChaoZhang, Datum: 2023-12-20 16:24:49Tags:

Übersicht
Diese Strategie kombiniert Bollinger Bands, Relative Strength Index (RSI) und Commodity Channel Index (CCI), um Crossover-Signale zu finden und Kauf- und Verkaufssignale zu generieren.
Strategie Logik
Bollinger-Bänder
Bollinger Bands bestehen aus einem mittleren Band, einem oberen Band und einem unteren Band. Das mittlere Band ist normalerweise ein 20-tägiger gleitender Durchschnitt. Das obere Band ist zwei Standardabweichungen über dem mittleren Band. Das untere Band ist zwei Standardabweichungen darunter. Preise in der Nähe des unteren Bandes können auf einen Überverkaufssituation hinweisen. Preise in der Nähe des oberen Bandes können auf einen Überkaufssituation hinweisen.
RSI
Der RSI misst die Geschwindigkeit der richtungsweisenden Preisbewegungen nach oben und unten. Er zeigt Überkauf über 70 und Überverkauf unter 30. Wenn der RSI von über 70 fällt, kann es ein Verkaufssignal sein. Wenn der RSI von unter 30 aufspringt, kann es ein Kaufsignal sein.
CCI
Der CCI misst, wie weit sich die Preise vom Durchschnittspreis entfernt haben. Werte über +100 bedeuten einen Überkauf. Werte unter -100 bedeuten einen Überverkauf. Der CCI spiegelt extreme Preisniveaus wider.
Kreuzungssignale
Diese Strategie verwendet Bollinger-Bänder, um kurzfristige Überkauf-/Überverkaufsniveaus zu beurteilen, RSI, um die Aufwärts-/Abwärtsdynamik zu messen, und CCI, um Preisextreme zu identifizieren.
Vorteile
- Die Kombination mehrerer Indikatoren verbessert die Genauigkeit des Signals und verringert Falschsignale
- Erfasst Umkehrmöglichkeiten an Wendepunkten
- Anpassbare Parameter an unterschiedliche Marktbedingungen angepasst
- Der glättete CCI-Filter reduziert den Lärm und verbessert die Stabilität
Risiken und Lösungen
- Alle drei Indikatoren können schlechte Signale erzeugen, die zu Verlusten führen.
- Der CCI hat mit unsicheren Märkten zu kämpfen und kann durch gleitende Durchschnitte oder Volatilitätsindikatoren ersetzt werden.
- Nur Stop-Loss, ohne Profit zu nehmen.
Optimierungsmöglichkeiten
- Testen Sie mehr Parameterkombinationen, um eine optimale Einstellung zu finden
- Einführung von maschinellem Lernen zur automatischen Anpassung von Parametern
- Gewinnaufnahme-Strategien mit Gewinnzielen
- Mehr Indikatoren wie MACD, KD hinzufügen, um Signale zu validieren
Schlussfolgerung
Diese Strategie analysiert die allgemeinen Marktbedingungen unter Verwendung von Bollinger Bands, RSI und CCI-Indikatoren. Sie identifiziert Wendepunkte durch Crossover-Signale, um Marktumkehrungen zu handeln. Mit weiteren Optimierungen wie Parameter-Tuning, Gewinnnahme-Mechanismen usw. kann es eine robuste Gegentrend-Strategie für verschiedene Marktumgebungen sein.
/*backtest
start: 2023-11-19 00:00:00
end: 2023-12-19 00:00:00
period: 1h
basePeriod: 15m
exchanges: [{"eid":"Futures_Binance","currency":"BTC_USDT"}]
*/

//@version=5
strategy(shorttitle="BBRSIstr", title="Bollinger Bands", overlay=true)
length = input.int(20, minval=1)
maType = input.string("SMA", "Basis MA Type", options = ["SMA", "EMA", "SMMA (RMA)", "WMA", "VWMA"])
src = input(close, title="Source")
mult = input.float(2.0, minval=0.001, maxval=50, title="StdDev")

ma(source, length, _type) =>
    switch _type
        "SMA" => ta.sma(source, length)
        "EMA" => ta.ema(source, length)
        "SMMA (RMA)" => ta.rma(source, length)
        "WMA" => ta.wma(source, length)
        "VWMA" => ta.vwma(source, length)

basis = ma(src, length, maType)
dev = mult * ta.stdev(src, length)
upper = basis + dev
lower = basis - dev
offset = input.int(0, "Offset", minval = -500, maxval = 500)
plot(basis, "Basis", color=#FF6D00, offset = offset)
p1 = plot(upper, "Upper", color=#2962FF, offset = offset)
p2 = plot(lower, "Lower", color=#2962FF, offset = offset)
fill(p1, p2, title = "Background", color=color.rgb(33, 150, 243, 95))

//RSI
rsiLengthInput = input.int(14, minval=1, title="RSI Length", group="RSI Settings")
rsiSourceInput = input.source(close, "Source", group="RSI Settings")
maTypeInput = input.string("SMA", title="MA Type", options=["SMA", "Bollinger Bands", "EMA", "SMMA (RMA)", "WMA", "VWMA"], group="MA Settings")
maLengthInput = input.int(14, title="MA Length", group="MA Settings")
bbMultInput = input.float(2.0, minval=0.001, maxval=50, title="BB StdDev", group="MA Settings")
showDivergence = input.bool(false, title="Show Divergence", group="RSI Settings")

up = ta.rma(math.max(ta.change(rsiSourceInput), 0), rsiLengthInput)
down = ta.rma(-math.min(ta.change(rsiSourceInput), 0), rsiLengthInput)
rsi = down == 0 ? 100 : up == 0 ? 0 : 100 - (100 / (1 + up / down))
rsiMA = ma(rsi, maLengthInput, maTypeInput)
isBB = maTypeInput == "Bollinger Bands"

rsiPlot = plot(rsi, "RSI", color=#7E57C2)
plot(rsiMA, "RSI-based MA", color=color.yellow)
rsiUpperBand = hline(70, "RSI Upper Band", color=#787B86)
midline = hline(50, "RSI Middle Band", color=color.new(#787B86, 50))
rsiLowerBand = hline(30, "RSI Lower Band", color=#787B86)
fill(rsiUpperBand, rsiLowerBand, color=color.rgb(126, 87, 194, 90), title="RSI Background Fill")

//cci
ma = ta.sma(src, length)
cci = (src - ma) / (0.015 * ta.dev(src, length))
plot(cci, "CCI", color=#2962FF)
band1 = hline(100, "Upper Band", color=#787B86, linestyle=hline.style_dashed)
hline(0, "Middle Band", color=color.new(#787B86, 50))
band0 = hline(-100, "Lower Band", color=#787B86, linestyle=hline.style_dashed)
fill(band1, band0, color=color.rgb(33, 150, 243, 90), title="Background")

typeMA = input.string(title = "Method", defval = "SMA", options=["SMA", "EMA", "SMMA (RMA)", "WMA", "VWMA"], group="Smoothing")
smoothingLength = input.int(title = "Length", defval = 5, minval = 1, maxval = 100, group="Smoothing")

smoothingLine = ma(cci, smoothingLength, typeMA)
plot(smoothingLine, title="Smoothing Line", color=#f37f20, display=display.none)


longCBB= close < lower
shortCBB = close>upper
longBRSI = rsi < 33
shortBRSI = rsi > 70
longcci = cci < -215
shortcci = cci > 250

strategy.entry("LONG", strategy.long, when = longCBB and longBRSI and longcci)
strategy.exit("Exit ", profit = 600)
strategy.entry("SHORT", strategy.short, when = shortCBB and shortBRSI and shortcci)
strategy.exit("Exit ", profit = 600)
- Interaktive Modellbasierte Kerzenhandelsstrategie
- DEMA-MACD-Kombinationsstrategie
- Ichimoku Yin Yang Candlestick Breakout-Strategie
- Liquiditätsgetriebene Trendstrategie - Eine Quantengeschäftsstrategie auf der Grundlage von Stromtrendanzeigen
- EMA-Crossover-Strategie mit Trailing Stop Loss
- SMA RSI & Plötzliche Kauf-Verkauf-Strategie
- Doppelfaktorische Strategie zur quantitativen Rückkehrverfolgung
- Ehlers Instantaneous Trendline Strategie
- Doppelte EMA-Goldene Kreuz-Durchbruchstrategie
- Bull- und Bear Power Moving Average Handelsstrategie
- Die Strategie zur Verfolgung von Ausbrüchen im VWAP
- Handelsstrategie zur Umkehrung der Dynamik
- Momentum-Tracking-Handelsstrategie
- Trendstrategie für mehrfache gewichtete gleitende Durchschnitte
- Handelsstrategie auf der Grundlage von Bollinger-Bändern und MACD
- Macd Blau Rot Hebelwirtschaftsstrategie
- Momentum-Erfassung Kanalstrategie
- Absicherungsstrategie zur Umkehrung von Schwingungen
- Quantitative Handelsstrategie auf der Grundlage von Bollinger-Bändern und RSI
- Die Strategie für den Indikator für das relative Volumen