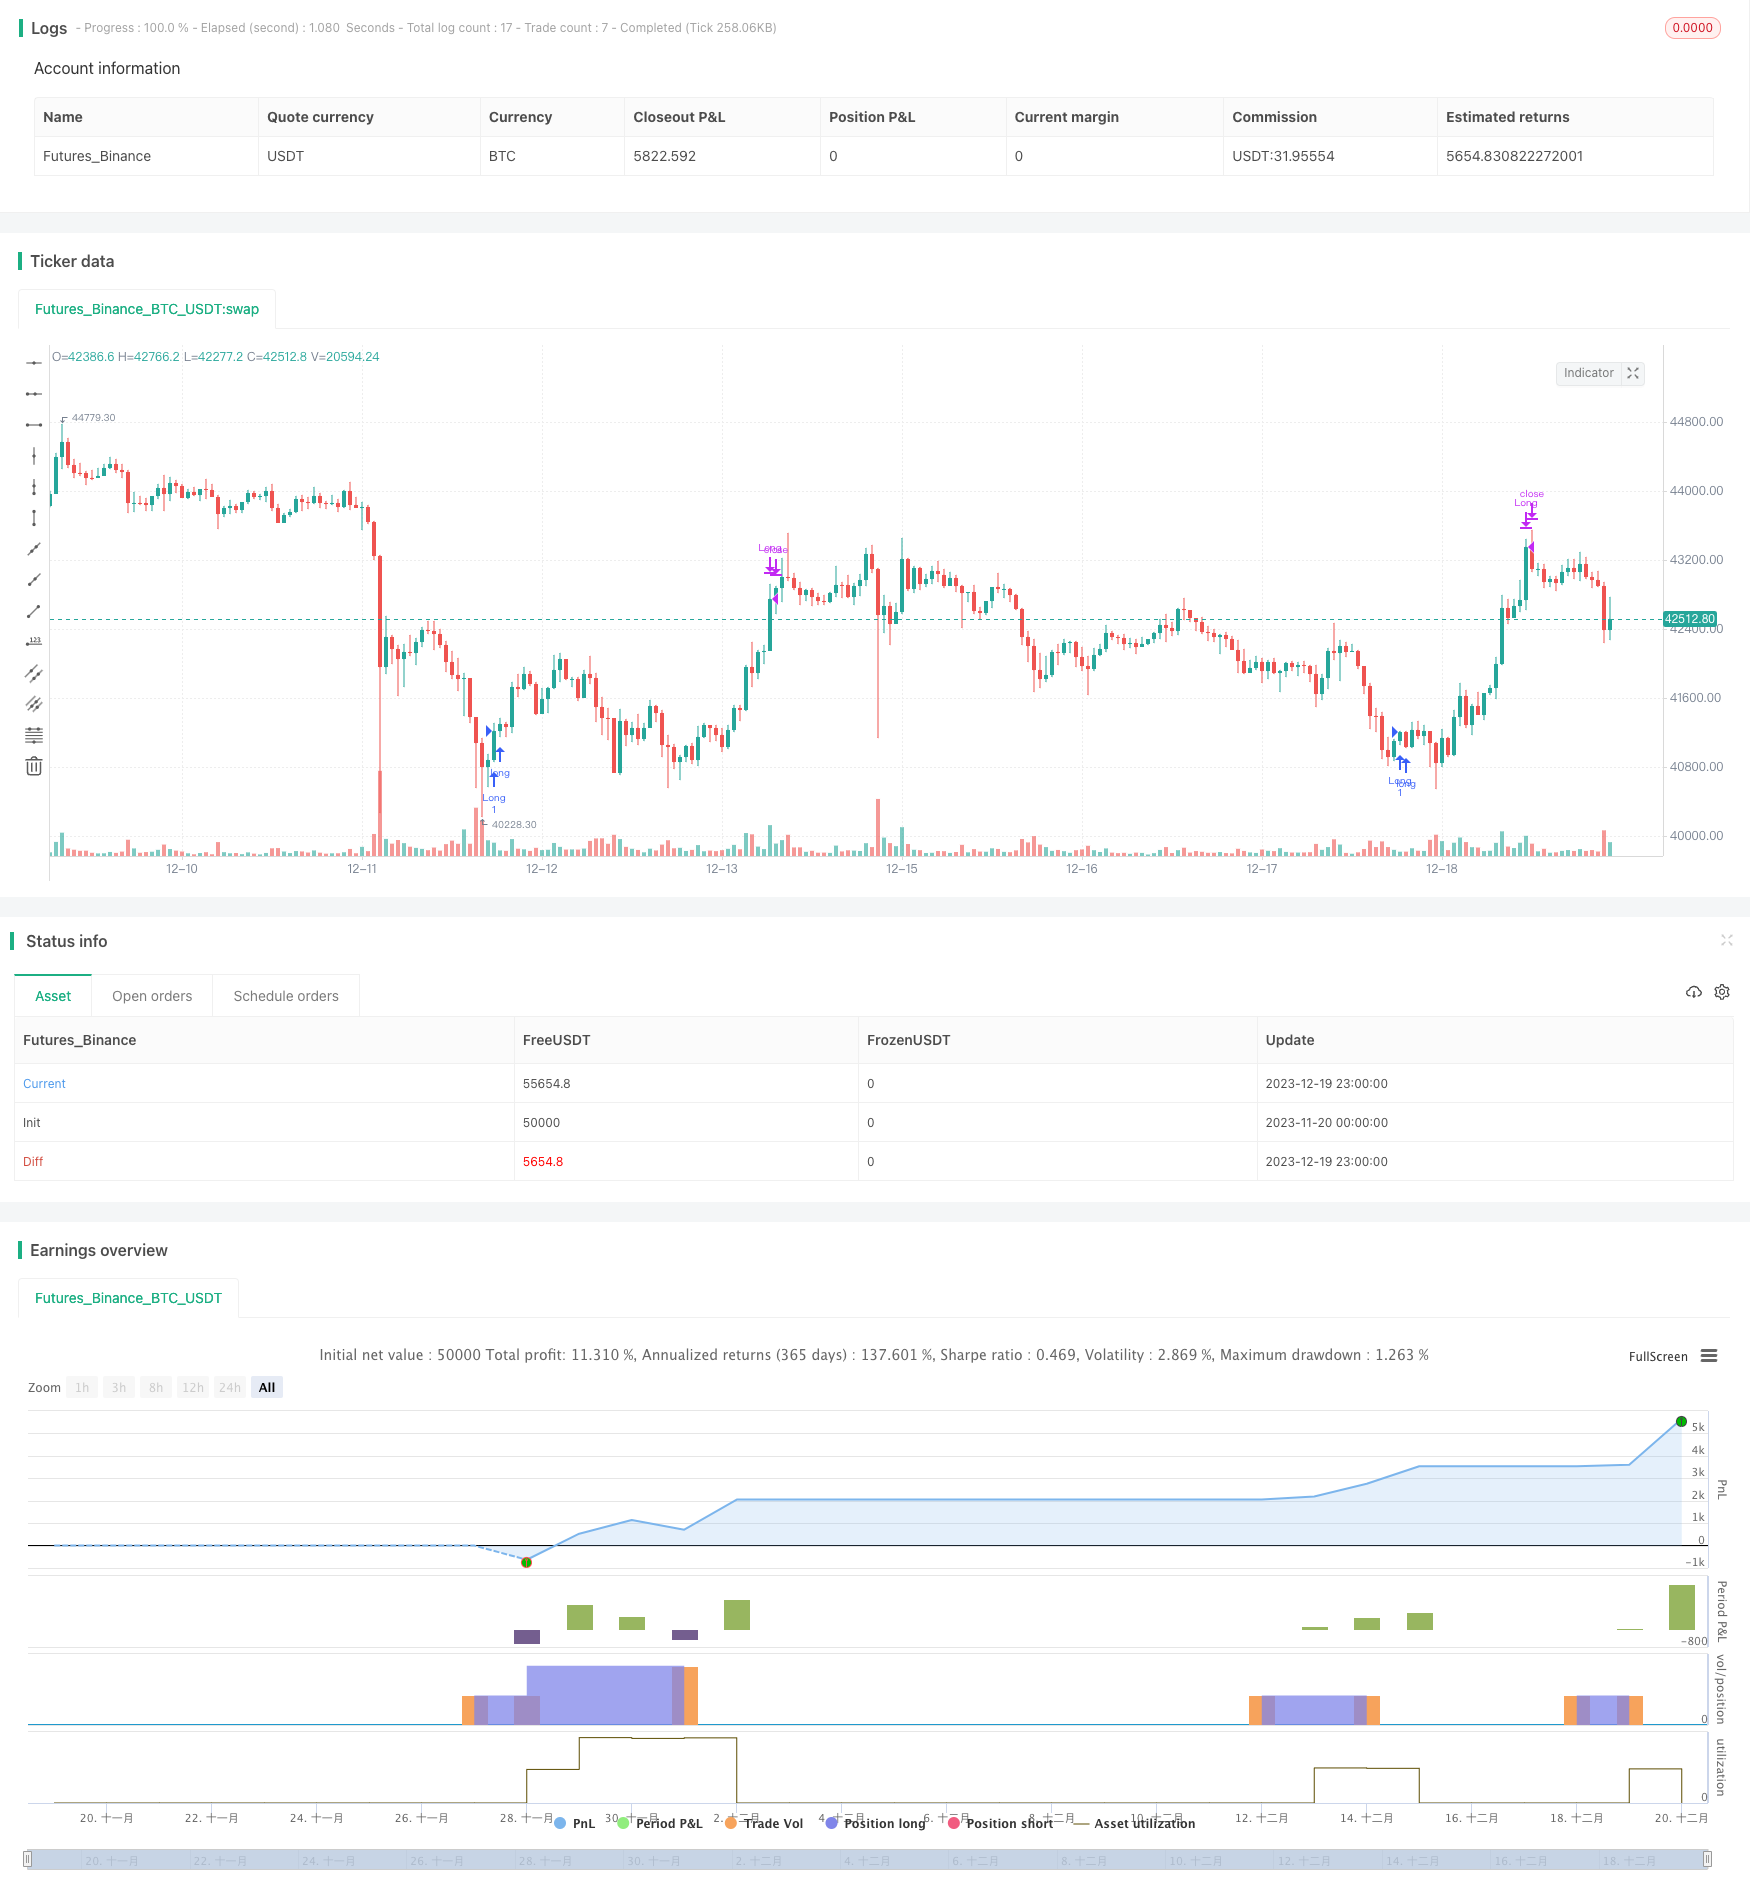
Die auf dem Volatilitätsindex und dem Stochastischen Oszillator basierende mehrjährige Handelsstrategie
Schriftsteller:ChaoZhang, Datum: 2023-12-21 14:34:42Tags:

Übersicht Diese Strategie kombiniert den Volatilitätsindex VIX und den stochastischen Oszillator RSI durch eine Zusammensetzung von Indikatoren über verschiedene Zeiträume hinweg, um effiziente Breakout-Eingänge und Überkauf/Überverkaufsausgänge zu erzielen.
Grundsätze
-
Berechnen Sie den VIX-Volatilitätsindex: Nehmen Sie die höchsten und niedrigsten Preise der letzten 20 Tage, um die Volatilität zu berechnen.
-
Berechnen Sie den RSI-Oszillator: Nehmen Sie die Preisänderungen in den letzten 14 Tagen.
-
Verknüpfen Sie die beiden Indikatoren. Gehen Sie lang, wenn VIX das obere Band oder den höchsten Perzentil überschreitet. Schließen Sie lange, wenn der RSI über 70 geht.
Vorteile
- Integriert mehrere Indikatoren für eine umfassende Bewertung des Marktzeitpunkts.
- Indikatoren über Zeiträume hinweg überprüfen sich gegenseitig und verbessern die Entscheidungsgenauigkeit.
- Anpassbare Parameter können für verschiedene Handelsinstrumente optimiert werden.
Risiken
- Eine falsche Einstellung der Parameter kann mehrere falsche Signale verursachen.
- Ein einzelner Exit-Indikator kann Preisumkehrungen verpassen.
Optimierungsvorschläge
- Mehr bestätigende Indikatoren wie gleitende Durchschnitte und Bollinger-Bänder in die Zeiteinträge integrieren.
- Hinzufügen von mehr Exit-Indikatoren wie Umkehr-Candlestick-Muster.
Zusammenfassung Diese Strategie nutzt den VIX, um Marktzeit und Risikoniveaus zu messen, und filtert ungünstige Trades anhand von Überkauf-/Überverkaufswerte aus dem RSI aus, um zu geeigneten Momenten einzutreten und rechtzeitig mit Stops auszutreten.
/*backtest
start: 2023-11-20 00:00:00
end: 2023-12-20 00:00:00
period: 1h
basePeriod: 15m
exchanges: [{"eid":"Futures_Binance","currency":"BTC_USDT"}]
*/

//@version=5
// This source code is subject to the terms of the Mozilla Public License 2.0 at https://mozilla.org/MPL/2.0/
// © timj

strategy('Vix FIX / StochRSI Strategy', overlay=true, pyramiding=9, margin_long=100, margin_short=100)

Stochlength = input.int(14, minval=1, title="lookback length of Stochastic")
StochOverBought = input.int(80, title="Stochastic overbought condition")
StochOverSold = input.int(20, title="Stochastic oversold condition")
smoothK = input(3, title="smoothing of Stochastic %K ")
smoothD = input(3, title="moving average of Stochastic %K")
k = ta.sma(ta.stoch(close, high, low, Stochlength), smoothK)
d = ta.sma(k, smoothD)

///////////// RSI
RSIlength = input.int( 14, minval=1 , title="lookback length of RSI")
RSIOverBought = input.int( 70  , title="RSI overbought condition")
RSIOverSold = input.int( 30  , title="RSI oversold condition")
RSIprice = close
vrsi = ta.rsi(RSIprice, RSIlength)

///////////// Double strategy: RSI strategy + Stochastic strategy

pd = input(22, title="LookBack Period Standard Deviation High")
bbl = input(20, title="Bolinger Band Length")
mult = input.float(2.0    , minval=1, maxval=5, title="Bollinger Band Standard Devaition Up")
lb = input(50  , title="Look Back Period Percentile High")
ph = input(.85, title="Highest Percentile - 0.90=90%, 0.95=95%, 0.99=99%")
new = input(false, title="-------Text Plots Below Use Original Criteria-------" )
sbc = input(false, title="Show Text Plot if WVF WAS True and IS Now False")
sbcc = input(false, title="Show Text Plot if WVF IS True")
new2 = input(false, title="-------Text Plots Below Use FILTERED Criteria-------" )
sbcFilt = input(true, title="Show Text Plot For Filtered Entry")
sbcAggr = input(true, title="Show Text Plot For AGGRESSIVE Filtered Entry")
ltLB = input.float(40, minval=25, maxval=99, title="Long-Term Look Back Current Bar Has To Close Below This Value OR Medium Term--Default=40")
mtLB = input.float(14, minval=10, maxval=20, title="Medium-Term Look Back Current Bar Has To Close Below This Value OR Long Term--Default=14")
str = input.int(3, minval=1, maxval=9, title="Entry Price Action Strength--Close > X Bars Back---Default=3")
//Alerts Instructions and Options Below...Inputs Tab
new4 = input(false, title="-------------------------Turn On/Off ALERTS Below---------------------" )
new5 = input(false, title="----To Activate Alerts You HAVE To Check The Boxes Below For Any Alert Criteria You Want----")
sa1 = input(false, title="Show Alert WVF = True?")
sa2 = input(false, title="Show Alert WVF Was True Now False?")
sa3 = input(false, title="Show Alert WVF Filtered?")
sa4 = input(false, title="Show Alert WVF AGGRESSIVE Filter?")

//Williams Vix Fix Formula
wvf = ((ta.highest(close, pd)-low)/(ta.highest(close, pd)))*100
sDev = mult * ta.stdev(wvf, bbl)
midLine = ta.sma(wvf, bbl)
lowerBand = midLine - sDev
upperBand = midLine + sDev
rangeHigh = (ta.highest(wvf, lb)) * ph

//Filtered Bar Criteria
upRange = low > low[1] and close > high[1]
upRange_Aggr = close > close[1] and close > open[1]
//Filtered Criteria
filtered = ((wvf[1] >= upperBand[1] or wvf[1] >= rangeHigh[1]) and (wvf < upperBand and wvf < rangeHigh))
filtered_Aggr = (wvf[1] >= upperBand[1] or wvf[1] >= rangeHigh[1]) and not (wvf < upperBand and wvf < rangeHigh)

//Alerts Criteria
alert1 = wvf >= upperBand or wvf >= rangeHigh ? 1 : 0
alert2 = (wvf[1] >= upperBand[1] or wvf[1] >= rangeHigh[1]) and (wvf < upperBand and wvf < rangeHigh) ? 1 : 0
alert3 = upRange and close > close[str] and (close < close[ltLB] or close < close[mtLB]) and filtered ? 1 : 0
alert4 = upRange_Aggr and close > close[str] and (close < close[ltLB] or close < close[mtLB]) and filtered_Aggr ? 1 : 0

//Coloring Criteria of Williams Vix Fix
col = wvf >= upperBand or wvf >= rangeHigh ? color.lime : color.gray

isOverBought = (ta.crossover(k,d) and k > StochOverBought) ? 1 : 0
isOverBoughtv2 = k > StochOverBought ? 1 : 0
filteredAlert = alert3 ? 1 : 0
aggressiveAlert = alert4 ? 1 : 0


if (filteredAlert or aggressiveAlert)
    strategy.entry("Long", strategy.long)

if (isOverBought)
    strategy.close("Long")
- Kurzfristige Handelsstrategie auf Basis des Chaikin Volatilitätsindikators
- Strategie zur Verfolgung von Trendüberschreitungen mit doppelter MA
- Super-Trend-Dreifachstrategie
- Dynamische Strategie zur Verringerung von Verlusten
- Bewegliche Durchschnitts-Crossover-Strategie mit Stop-Loss und Take-Profit
- Umgekehrte Strategie zur Umkehrung der Mittelwerte basierend auf gleitenden Durchschnitten
- Bollinger-Band-basierte Hochfrequenzhandelsstrategie
- Eine quantitative Ichimoku-Cloud-Handelsstrategie
- Momentum-Strategie auf der Grundlage des Modells des doppelten Bottom Breakouts
- Stochastische Stromwirbelstrategie
- Erweiterte anpassungsfähige Handelsstrategie der CCI für die Grundfischerei in Rohstoffen
- Momentum-Strategie auf Basis von LazyBear's Squeeze
- Gewinnausfallstop-Strategie auf Basis eines gleitenden Durchschnitts
- Dynamische gewichtete gleitende Durchschnittshandelsstrategie
- Letzte Kerzenstrategie
- Quantitative Strategie zur Umkehrung des negativen Volumenindex
- Triple Supertrend Breakout-Strategie
- MACD der Strategie der relativen Stärke
- Drei Drachen-System
- Top-Handel nur auf Basis der wöchentlichen EMA8-Strategie