Glätteter gleitender Durchschnitt - Strategie zur Portfoliooptimierung
Überblick
Die Strategie basiert auf einer Kombination aus glatten Moving Averages und Stochastic Indicators mit dem Ziel, mehr Chancen in einem Trend zu erfassen. Sie verwendet hauptsächlich Indikator-Moving Averages aus zwei verschiedenen Perioden, um Strategie-Signale zu erzeugen, kombiniert mit der Kreuzung der K- und D-Linien in Stochastic Indicators als Einstiegsmomente, um eine höhere Gewinnrate in einem Trend zu erhalten.
Strategieprinzip
Die Strategie verwendet zwei glatte Moving Averages mit 12 und 26 Perioden. Wenn die schnelle Linie die langsame Linie von unten durchquert, machen Sie mehr; Wenn die schnelle Linie die langsame Linie von oben durchquert, machen Sie eine Leere.
Wenn die K-Linie unterhalb der Überkauflinie die D-Linie überschreitet, macht man Plus; wenn die K-Linie unterhalb der Überverkaufszone die D-Linie überschreitet, macht man Negativ.
Der glatte Moving Average bestimmt die Richtung des Trends, der Stochastic Filter filtert die Noise und wählt den Einstiegsmoment. Ihre Kombination ermöglicht mehr Gewinnchancen im Trend.
Strategische Vorteile
- Die glatte Moving Average-Strategie ist von selbst beweglich und lässt sich leicht verfolgen
- Filterung von Noise mit Stochastic-Indikatoren zur Erhöhung der Gewinnwahrscheinlichkeit
- Schnelle und langsame Mittellinien-Kombination, wenn die Schnelle Linie zurück in die Nähe der langsamen Linie geschaltet wird, um eine bessere Spielmöglichkeit zu erhalten
- K- und D-Linien in Stochastic-Indikatoren werden kombiniert, um eine bessere Einstiegsposition zu wählen
Daher kann die Strategie schrittweise und selektiv Chancen ergreifen, die zu höheren Gewinnquoten führen.
Risikoanalyse
- Kurzfristige Abfahrtsrisiken. Bei Rückführung der Schnelllinie auf die Langspiellinie kann das Signal abgelehnt oder eingeklemmt werden
- Aufgrund seiner dynamischen Eigenschaften kann er sich nicht schnell an eine heftige Kehrtwende anpassen und kann zu größeren Verlusten führen.
Um diese Risiken zu verringern, können wir Stop-Losses einstellen oder eine lockere Kombination von Moving-Average-Parametern verwenden.
Optimierungsrichtung
Die Strategie kann in folgenden Bereichen weiter optimiert werden:
- Versuche verschiedene Kombinationen von Moving Average Parametern, um die besseren zu finden
- Verschiedene Kombinationen von stochastischen Parametern testen
- Erhöhung der Stop-Loss-Strategie
- Erhöhung des dynamischen Stop-Losses auf Basis der Volatilität
- Kombinationsoptimierung für verschiedene Varianten mit unterschiedlichen Periodenparametern
- Optimierungsparameter für Tests mit Machine Learning-Algorithmen
Durch das Testen verschiedener Kombinationen von Parametern können stärkere Parameter gefunden werden; gleichzeitig kann die Einrichtung einer Stop-Loss-Strategie das Risiko effektiv reduzieren und die Strategie-Stabilität verbessern.
Zusammenfassen
Die Strategie integriert die Vorteile von glatten Moving Averages und Stochastic Indicators, um Trends nach und nach zu verfolgen und bessere Einstiegsmomente zu wählen. Sie ist einfach zu bedienen, Risiken sind kontrollierbar und haben einen großen praktischen Wert. Durch kontinuierliche Tests und Optimierungen kann ihre Leistung weiter verbessert werden.
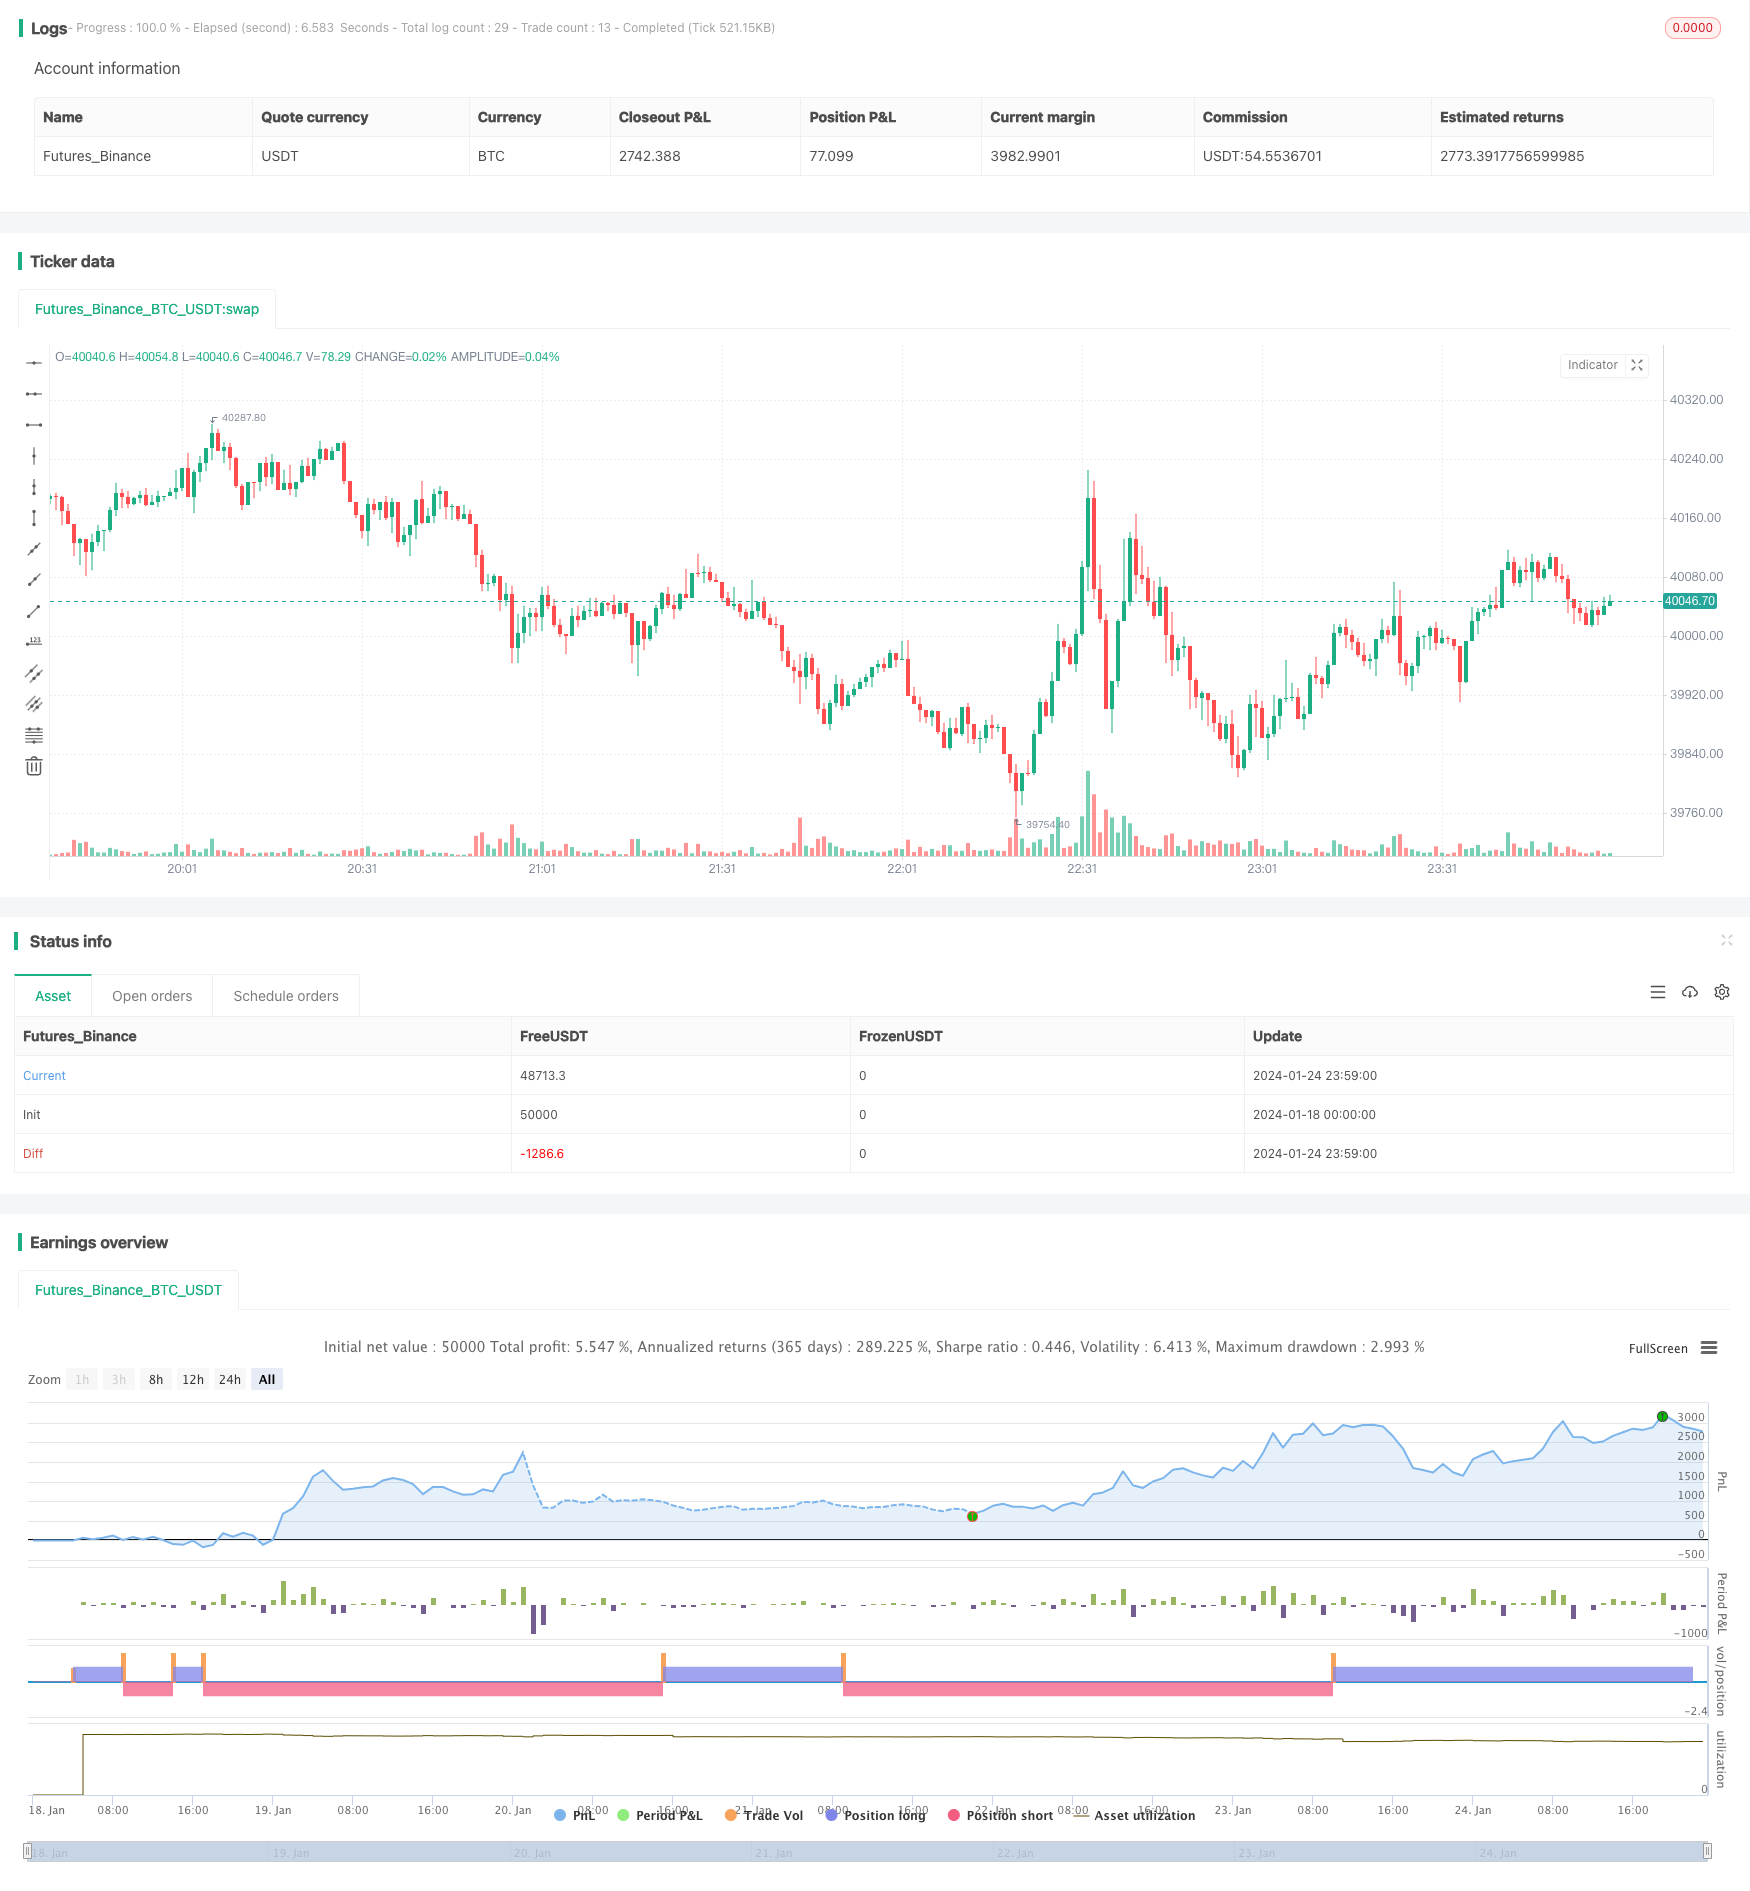
/*backtest
start: 2024-01-18 00:00:00
end: 2024-01-25 00:00:00
period: 1m
basePeriod: 1m
exchanges: [{"eid":"Futures_Binance","currency":"BTC_USDT"}]
*/

//@version=4
// author SoftKill

strategy(title="Price EMA with stock", shorttitle="EMA STOCH", overlay=true)
src = input(title="Source", type=input.source, defval=close)

src_0 = src[0]
src_1 = src[1]
src_2 = src[2]
src_3 = src[3]
src_4 = src[4]

len50 = input(50, minval=1, title="Length")
src50 = input(close, title="Source")
out50 = ema(src50, len50)
len100 = input(100)
src100 = input(close, title="Source")
out100 = ema(src100, len100)

len1 = input(1, minval=1, title="Length")
src1 = input(close, title="Source")
out1 = sma(src1, len1)

length = input(5, minval=1)
OverBought = input(80)
OverSold = input(20)
smoothK = 3
smoothD = 3

k = sma(stoch(close, high, low, length), smoothK)
d = sma(k, smoothD)
cu = crossover(k,OverSold)
co = crossunder(k,OverBought)

sma_down = crossunder(out1, out50)
sma_up = crossover(out1,out50)

//if (not na(k) and not na(d))
  //  if (co and k < OverSold)
    //    strategy.entry("StochLE", strategy.long, comment="StochLE")
    //if (cu and k > OverBought)
     //   strategy.entry("StochSE", strategy.short, comment="StochSE")

crossCandle_4 = crossover(src[4],out50)
crossCandleUnder_4= cross(src[4],out50)
crossCandle_3 = crossover(src[3],out50)
crossCandleUnder_3= crossunder(src[3],out50)
crossCandle_2 = crossover(src[2],out50)
crossCandleUnder_2= crossunder(src[2],out50)
crossCandle_1 = crossover(src[1],out50)
crossCandleUnder_1= crossunder(src[1],out50)
crossCandle_0 = crossover(src[0],out50)
crossCandleUnder_0= crossunder(src[0],out50)

conditionOver = (crossCandle_4 or crossCandle_3 or crossCandle_2 or crossCandle_1 or crossCandle_0)
conditionUnder =(crossCandleUnder_4 or crossCandleUnder_3 or crossCandleUnder_2 or crossCandleUnder_1 or crossCandleUnder_0)

touch4 = (cross(low[4],out50) or cross(high[4],out50))
touch3 = (cross(low[3],out50) or cross(high[3],out50))
touch2 = (cross(low[2],out50) or cross(high[2],out50))
touch1 = (cross(low[1],out50) or cross(high[1],out50))

touch = touch1 or touch2 or touch3 or touch4

//and sma_up
//and sma_down

// Getting inputs
fast_length = input(title="Fast Length", type=input.integer, defval=12)
slow_length = input(title="Slow Length", type=input.integer, defval=26)
src_macd = input(title="Source", type=input.source, defval=close)
signal_length = input(title="Signal Smoothing", type=input.integer, minval = 1, maxval = 50, defval = 9)
sma_source = input(title="Simple MA(Oscillator)", type=input.bool, defval=false)
sma_signal = input(title="Simple MA(Signal Line)", type=input.bool, defval=false)

// Plot colors
col_grow_above = #26A69A
col_grow_below = #FFCDD2
col_fall_above = #B2DFDB
col_fall_below = #EF5350
col_macd = #0094ff
col_signal = #ff6a00

// Calculating
fast_ma = sma_source ? sma(src_macd, fast_length) : ema(src_macd, fast_length)
slow_ma = sma_source ? sma(src_macd, slow_length) : ema(src_macd, slow_length)
macd = fast_ma - slow_ma
signal = sma_signal ? sma(macd, signal_length) : ema(macd, signal_length)
hist = macd - signal

//plot(hist, title="Histogram", style=plot.style_columns, color=(hist>=0 ? (hist[1] < hist ? col_grow_above : col_fall_above) : (hist[1] < hist ? col_grow_below : col_fall_below) ), transp=0 )
//plot(macd, title="MACD", color=col_macd, transp=0)
//plot(signal, title="Signal", color=col_signal, transp=0)


// plot((conditionOver or conditionUnder or touch)  and src[0] >= out50 and close >= out50 and  (cu) and out50 > out100 and hist>=0 , title="Buy", style=plot.style_columns, color=color.lime)
// plot((conditionOver or conditionUnder or touch)  and src[0] <= out50 and close <= out50 and  (co) and out50< out100 and hist<=0 , title="sell", style=plot.style_columns, color=color.red)


long_cond = ((conditionOver or conditionUnder or touch)  and src[0] >= out50 and close > out50 and  (cu) and out50 > out100 and hist>=0)
short_cond = ((conditionOver or conditionUnder or touch)  and src[0] <= out50 and close < out50 and  (co) and out50< out100 and hist<=0)

tp=input(0.1)
sl=input(0.1)

strategy.entry("long",strategy.long, when=long_cond)
strategy.entry("short",strategy.short, when=short_cond)

strategy.exit("X_long", "long", profit=close * tp / syminfo.mintick,  loss=close * sl / syminfo.mintick, when=touch  )
strategy.exit("x_short", "short",profit=close * tp / syminfo.mintick,loss=close * sl / syminfo.mintick,when = touch )

// //tp = input(0.0003, title="tp")
// tp = 0.0003
// //sl = input(1.0 , title="sl")
// sl = 1.0
// strategy.exit("closelong", "long" , profit = close * tp / syminfo.mintick, loss = close * sl / syminfo.mintick, alert_message = "closelong")
// strategy.exit("closeshort", "short" , profit = close * tp / syminfo.mintick, loss = close * sl / syminfo.mintick, alert_message = "closeshort")