Überblick
Die Strategie ist ein Handelssystem, das auf der Analyse mehrerer Zeiträume basiert und die Erzeugung von Handelssignalen in Kombination mit Bollinger Bands, Hull Moving Averages und Gewichteten Moving Averages ermöglicht. Die Strategie arbeitet hauptsächlich auf einem 1-Stunden-Zeitrahmen und kombiniert Marktdaten aus drei Zeiträumen von 5 Minuten, 1 Stunde und 3 Stunden, um die Handelschancen durch eine Kombination aus mehreren technischen Indikatoren zu bestätigen. Die Strategie verwendet einen dynamischen Stop-Loss-Mechanismus und passt die Positionsgröße automatisch an die Rechte und Interessen der Konten an, um die Risiken effektiv zu kontrollieren.
Strategieprinzip
Die Kernlogik der Strategie basiert auf der Kreuzbestätigung mehrerer technischer Indikatoren. Die Beziehung zwischen den Preisen und den verschiedenen Gleichungen wird über mehrere Zeiträume hinweg gleichzeitig überwacht, einschließlich der gewichteten gleitenden Durchschnittswerte für 5-Minuten-Perioden (VWMA), der gewichteten gleitenden Durchschnittswerte für 1-Stunden-Perioden und der Hull-gleitenden Durchschnittswerte für 3-Stunden-Perioden (HMA).
Strategische Vorteile
- Mehrfache Zeitzyklusanalyse reduziert das Risiko von False Breaks und erhöht die Zuverlässigkeit von Handelssignalen
- Dynamische Stop-Loss-Einstellungen, die sich an unterschiedliche Marktbedingungen anpassen
- Positionsverwaltung auf Basis von Kontozinsen gewährleistet eine vernünftige Verwendung der Mittel
- Die Auswahl von mehreren Ausstiegsmechanismen erhöht die Anpassungsfähigkeit der Strategie
- Die grafische Oberfläche bietet eine klare Darstellung der Handelssignale, die zur Analyse und Beurteilung beitragen
- Integration mehrerer erfahrener technischer Indikatoren zur Erhöhung der Genauigkeit von Handelsentscheidungen
Strategisches Risiko
- Die Verwendung von mehreren Indikatoren kann zu einer Verzögerung der Handelssignale führen.
- In einem volatilen Markt können häufig falsche Ausbruchssignale auftreten
- Ein fester Stop-Loss-Ratio ist möglicherweise nicht für alle Marktbedingungen geeignet.
- Datenverarbeitung mit mehreren Zeiträumen kann die Komplexität der Strategie erhöhen
- Ein möglicherweise höheres Risiko für einen Ausrutscher in einem hochvolatilen Markt
Richtung der Strategieoptimierung
- Einführung von Volatilitätsindikatoren zur dynamischen Anpassung von Take-Profit- und Stop-Loss-Niveaus
- Erweiterte Marktreife-Erkennung, mit unterschiedlichen Parameter-Einstellungen für verschiedene Marktsituationen
- Optimierung der Signalfiltermechanismen zur Verringerung der Verluste durch falsche Durchbrüche
- Um die Zuverlässigkeit von Durchbruchsignalen zu erhöhen, wird die Analyse der Transaktionsmengen hinzugefügt.
- Entwicklung von Adaptive Parameter-Optimierungsmechanismen zur Steigerung der Stabilität von Strategien
Zusammenfassen
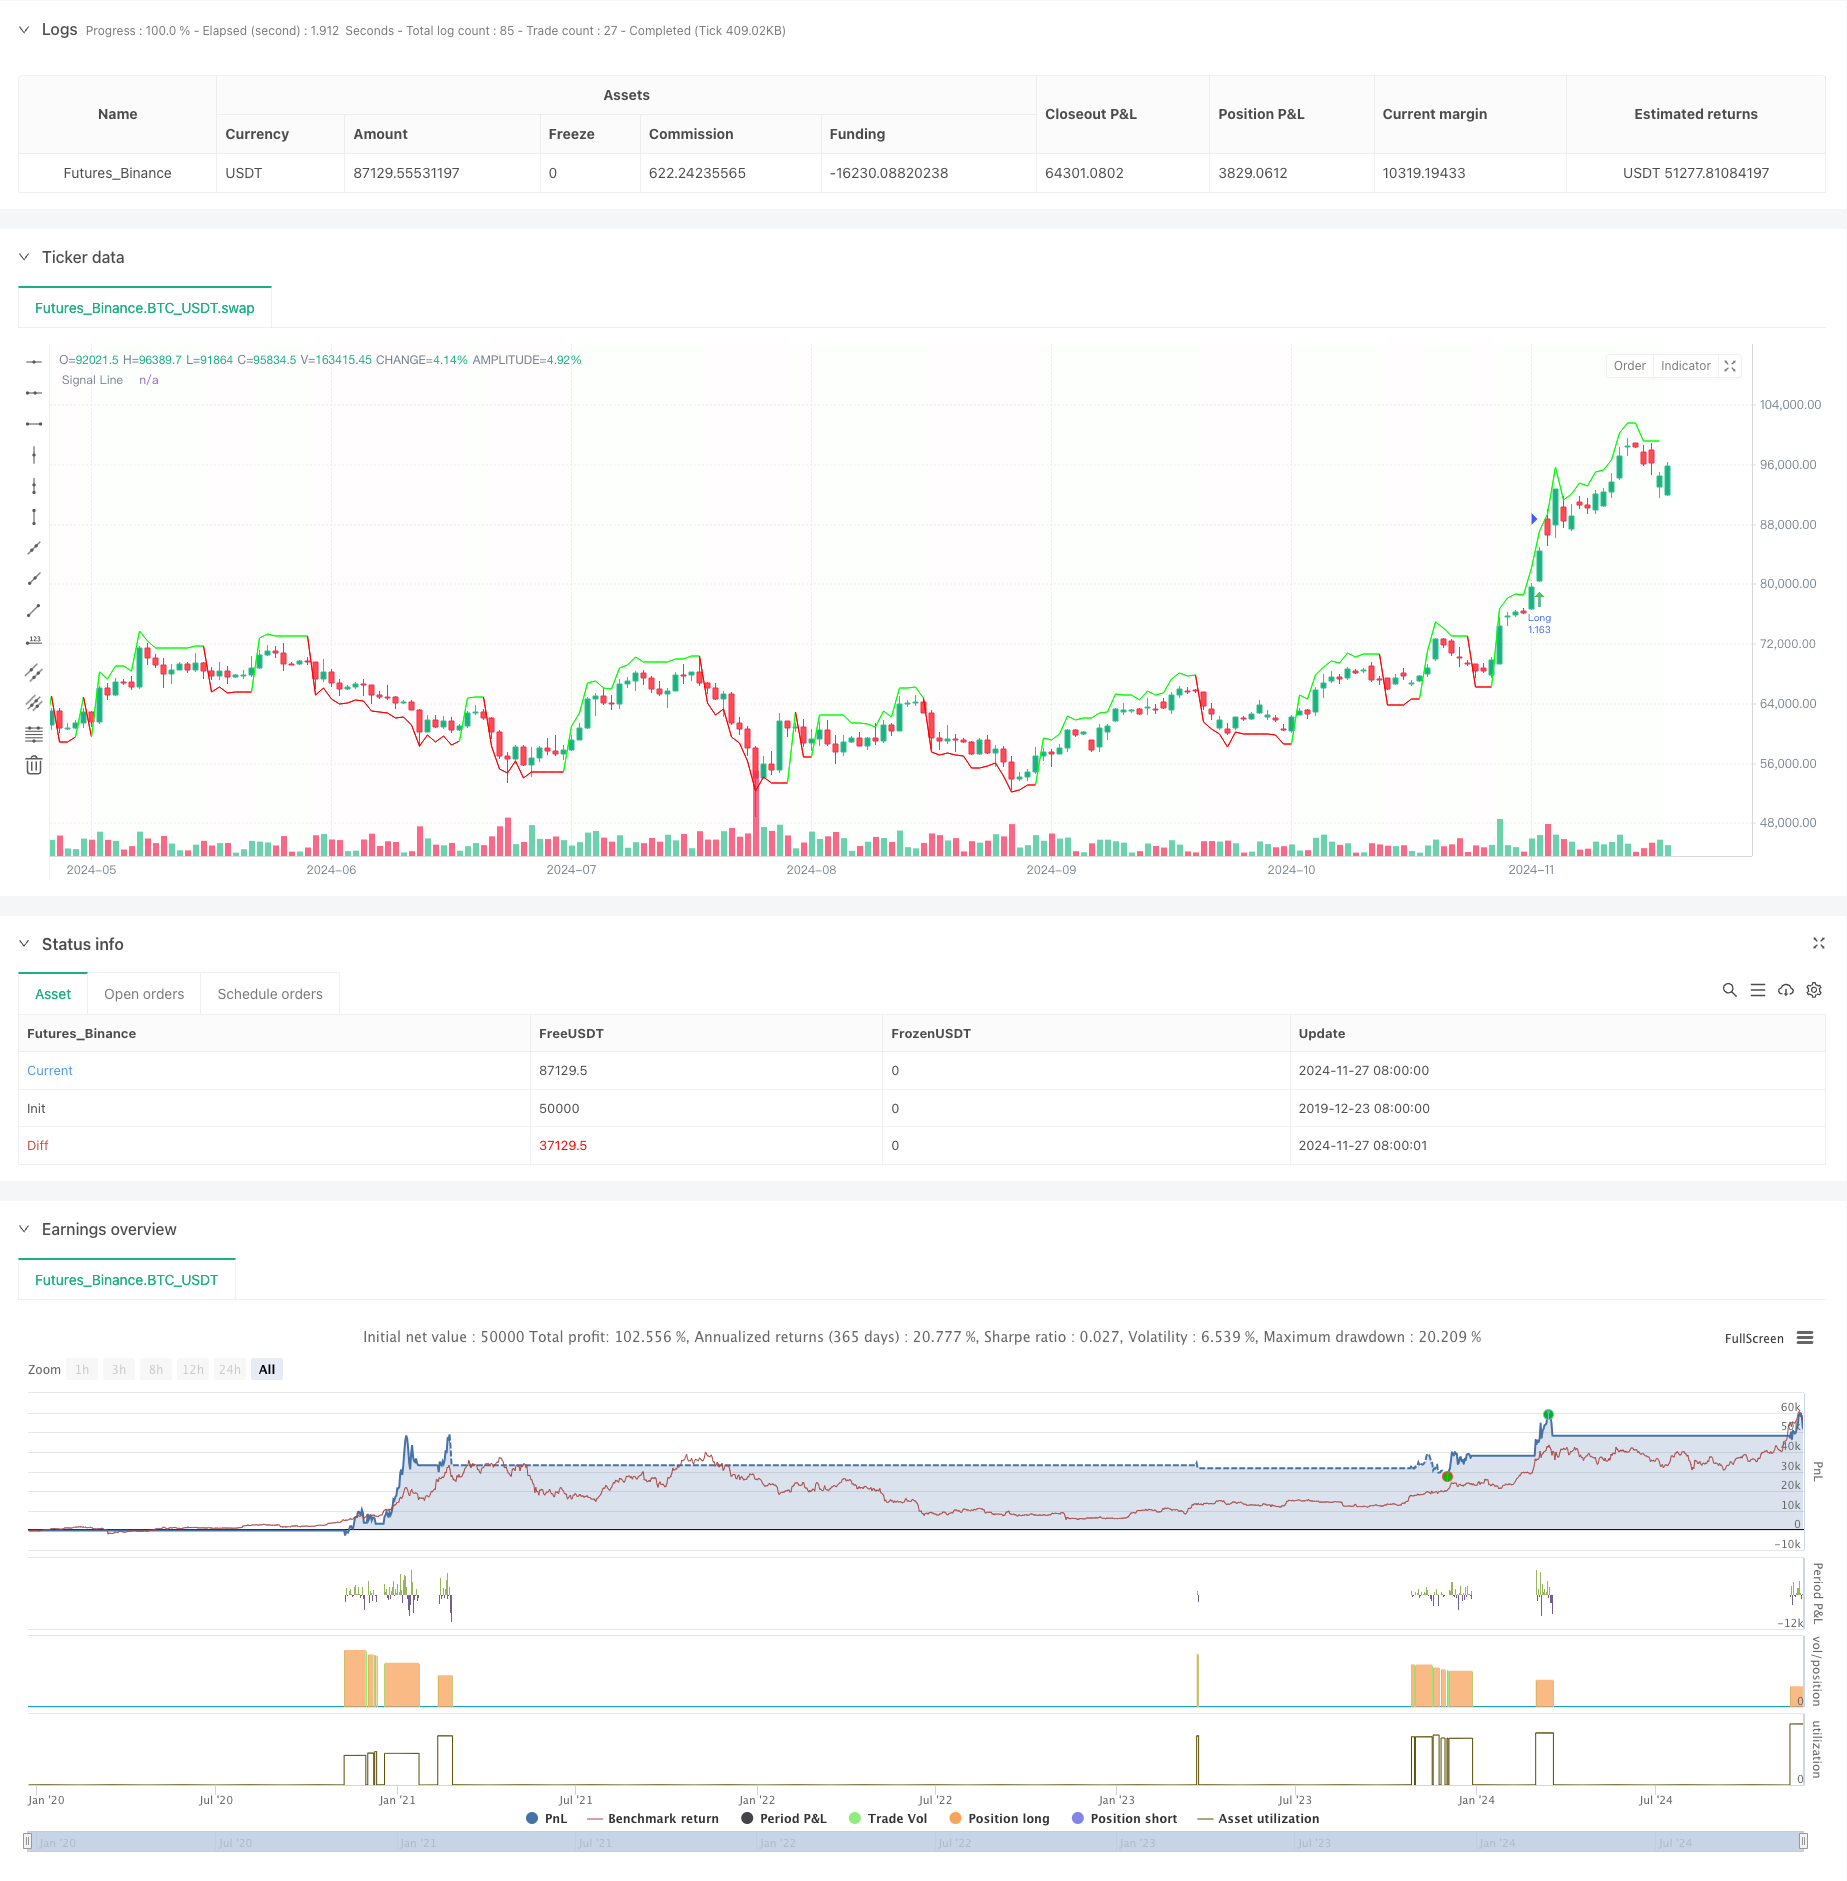
Die Strategie baut durch die Kombination von mehreren Zeitzyklus-Analysen und mehreren technischen Indikatoren ein relativ vollständiges Handelssystem auf. Die Vorteile der Strategie liegen in der Zuverlässigkeit der Signale und der Wirksamkeit des Risikomanagements, aber es gibt auch Probleme wie Signalverzögerung und Parameteroptimierung. Durch kontinuierliche Optimierung und Verbesserung wird erwartet, dass die Strategie in verschiedenen Marktumgebungen stabil bleibt.
/*backtest
start: 2019-12-23 08:00:00
end: 2024-11-28 00:00:00
period: 1d
basePeriod: 1d
exchanges: [{"eid":"Futures_Binance","currency":"BTC_USDT"}]
*/

//@version=5
strategy("1H- 280, 2.7", overlay=true)


// Fetch the indicator values from different timeframes
vwma5 = request.security(syminfo.tickerid, "5", ta.wma(close, 233), lookahead = barmerge.lookahead_off)
vwma_hourly = request.security(syminfo.tickerid, "60", ta.wma(close, 89), lookahead = barmerge.lookahead_off)
hullma155_3h = request.security(syminfo.tickerid, "180", ta.hma(close, 155), lookahead = barmerge.lookahead_off)


// Calculate the deviation value
deviation = close * 0.032


// Initialize the signal variables
var float signalLine = na
var color lineColor = na


// Long Entry Conditions
longCondition_5min = close > vwma5
longCondition_hourly = close > vwma_hourly
longCondition_3h = close > hullma155_3h


// Short Entry Conditions
shortCondition_5min = close < vwma5
shortCondition_hourly = close < vwma_hourly
shortCondition_3h = close < hullma155_3h


// Long Entry
if longCondition_5min and longCondition_hourly and longCondition_3h
    signalLine := close + deviation
    lineColor := color.rgb(0, 255, 0, 1)


// Short Entry
if shortCondition_5min and shortCondition_hourly and shortCondition_3h
    signalLine := close - deviation
    lineColor := color.rgb(255, 0, 0, 1)


// Plotting the connecting line
plot(signalLine, title="Signal Line", color=lineColor, linewidth=1, style=plot.style_line)


// Colorize the signal line
bgcolor(signalLine > close ? color.rgb(0, 255, 0, 99) : color.rgb(255, 0, 0, 99), transp=90)


// Strategy settings
useTPSL = input(true, "Use TP/SL for closing long positions?")
useDownbreakOutbreak = input(false, "Use Downbreak and Outbreak for closing positions?")
useM7FClosing = input(false, "Use M7F Signal for closing positions?")


length1 = input.int(280, minval=1)
src = input(close, title="Source")
mult = input.float(2.7, minval=0.001, maxval=50, title="StdDev")


basis = ta.vwma(src, length1)
dev = mult * ta.stdev(src, length1)
upper = basis + dev
lower = basis - dev


offset = input.int(0, "Offset", minval = -500, maxval = 500)


length2 = input.int(55, minval=1)
src2 = input(close, title="Source")
hullma = ta.wma(2 * ta.wma(src2, length2 / 2) - ta.wma(src2, length2), math.floor(math.sqrt(length2)))


hullmacrosslower = ta.crossover(hullma, lower)
hullmacrossupper = ta.crossunder(hullma, upper)


breakout = ta.crossover(ohlc4, upper)
breakdown = ta.crossunder(ohlc4, upper)
outbreak = ta.crossover(ohlc4, lower)
downbreak = ta.crossunder(ohlc4, lower)


// Calculate position size and leverage
margin_pct = 1
leverage = 1
position_size = strategy.equity * margin_pct
qty = position_size / close / leverage


// Define take profit and stop loss levels
take_profit = 0.14
stop_loss = 0.06


// Opening a long position
if breakout
    strategy.entry("Long", strategy.long, qty, limit=close*(1+take_profit), stop=close*(1-stop_loss))


// Opening a short position
if downbreak
    strategy.entry("Short", strategy.short, qty, limit=close*(1-take_profit), stop=close*(1+stop_loss))


// Closing positions based on chosen method
if useTPSL
    // Using TP/SL for closing long positions
    if strategy.position_size > 0 and breakdown
        strategy.close("Long", comment="Breakdown")
else if useDownbreakOutbreak
    // Using Downbreak and Outbreak for closing positions
    if strategy.position_size > 0 and (breakdown or downbreak)
        strategy.close("Long", comment="Breakdown")
    if strategy.position_size < 0 and (outbreak or downbreak)
        strategy.close("Short", comment="Outbreak")
else if useM7FClosing
    // Using M7F Signal for closing positions
    if strategy.position_size > 0 and (signalLine < close)
        strategy.close("Long", comment="M7F Signal")
    if strategy.position_size < 0 and (signalLine > close)
        strategy.close("Short", comment="M7F Signal")


// Plotting entry signals
plotshape(hullmacrosslower, title="High Bear Volatility", style=shape.arrowup, text="^^^^^", color=color.rgb(75, 202, 79), location=location.belowbar)
plotshape(hullmacrossupper, title="High Bull Volatility", style=shape.arrowdown, text="-----", color=color.rgb(215, 72, 72), location=location.abovebar)
plotshape(breakout ? 1 : na, title="Breakout", style=shape.arrowup, text="", color=color.rgb(75, 202, 79), location=location.belowbar, size=size.tiny)
plotshape(breakdown ? 1 : na, title="Breakdown", style=shape.arrowdown, text="", color=color.rgb(201, 71, 71), location=location.abovebar, size=size.tiny)
plotshape(outbreak ? 1 : na, title="Outbreak", style=shape.arrowup, text="", color=color.rgb(0, 110, 255), location=location.belowbar, size=size.tiny)
plotshape(downbreak ? 1 : na, title="Downbreak", style=shape.arrowdown, text="", color=color.rgb(255, 111, 0), location=location.abovebar, size=size.tiny)