Überblick
Die Strategie ist ein auf der technischen Analyse basierendes Trend-Tracking-System, das durch Multiple-Signal-Verifizierung die Handelschancen durch eine Kombination aus einem Mittellinien-System, einem RSI-Dynamik-Indikator und einem ATR-Volatilitätsindikator bestätigt. Die Strategie nutzt eine Kreuzung von mehreren Perioden, um die Markttrends zu bestimmen, während die RSI-Dynamik in Verbindung mit der Bestätigung der Preisstärke verwendet wird.
Strategieprinzip
Die Kernlogik der Strategie besteht aus drei wichtigen Teilen:
- Trendbeurteilung: Die Richtung des Markttrends wird durch die Verwendung eines Index-Moving-Averages (EMA) mit einer Kreuzung von 100 und 200 Zyklen bestätigt. Wenn ein kurzfristiger EMA über einem langfristigen EMA liegt, ist der Markt im Aufwärtstrend.
- Eintrittssignale: Auf der Grundlage von Trendbestätigungen sucht die Strategie nach bullish-swallowing Formen als spezifische Eintrittspunkte und filtert die Signale mit dem RSI-Indikator. Wenn der RSI-Wert größer als 50 ist, zeigt dies, dass der Markt ausreichend Aufwärtsdynamik hat.
- Positionsmanagement: Die 14-Zyklus-ATR wird verwendet, um die Marktvolatilität zu messen und die Stop-Loss- und Profit-Levels entsprechend dynamisch einzustellen. Die Stop-Loss-Einstellung beträgt 1,1 mal die ATR und die Profit-Ziel 2,0 mal die ATR, was eine Gewinn-Loss-Rate von mehr als 1 garantiert.
Strategische Vorteile
- Multiple Signal Validation: Durch die Kombination von Trends, Preisformationen und dynamischen Indikatoren wird die Wirkung von Falschsignalen erheblich reduziert.
- Dynamisches Risikomanagement: Die Stop- und Take-Loss-Einstellungen basieren auf dem ATR und können an die Volatilität des Marktes angepasst werden, wodurch die Einschränkungen der Fixed Point-Position vermieden werden.
- Trend-Tracking-Funktion: Durch die Einschätzung von Trends durch ein Linear-System wird ein unnötiger Handel in einem Quer- oder Fallmarkt vermieden.
- Vollständiger Handelsrahmen: umfasst ein vollständiges Strategie-System für die Verwaltung von Einstieg, Ausstieg und Position.
Strategisches Risiko
- Trendverzögerung: Die EMA als Rückstandsindikator kann zu einem verspäteten Eintritt führen und kann den besten Eintrittspunkt in einem schnell schwankenden Markt verpassen.
- Marktrisiken: Häufige Durchschnittskreuzungen können zu Überhändlungen führen.
- Falsche Durchbruchrisiken: False Durchbruchrisiken sind möglich und müssen durch strenge Risikokontrollen verwaltet werden.
- Stop-Loss-Risiken: Eine zu kleine ATR-Multiplikation kann zu häufigen Stop-Losses führen, während eine zu große Multiplikation ein zu hohes Risiko darstellt.
Richtung der Strategieoptimierung
- Einführung von Verkehrsmesswerten: Die Signalsicherheit kann durch Hinzufügen von Verkehrsbestätigung verbessert werden.
- Optimierung des Durchschnittszyklus: Der Durchschnittszyklus kann je nach Markteigenschaften angepasst werden, um besser an die Marktdynamik anzupassen.
- Verbesserte Stop-Loss-Mechanismen: Erwägen Sie, mobile Stop-Loss-Mechanismen hinzuzufügen, die bei anhaltenden Trends profitabel sind.
- Erhöhung der Marktumfeld-Filterung: Einführung von Volatilitätsberechnungen, um die Handelsfrequenz in einem übermäßig volatilen Marktumfeld zu reduzieren.
- Optimierung der RSI-Parameter: Die Optimierung der RSI-Temperature und -Zyklen kann anhand von historischen Daten zurückverfolgt werden.
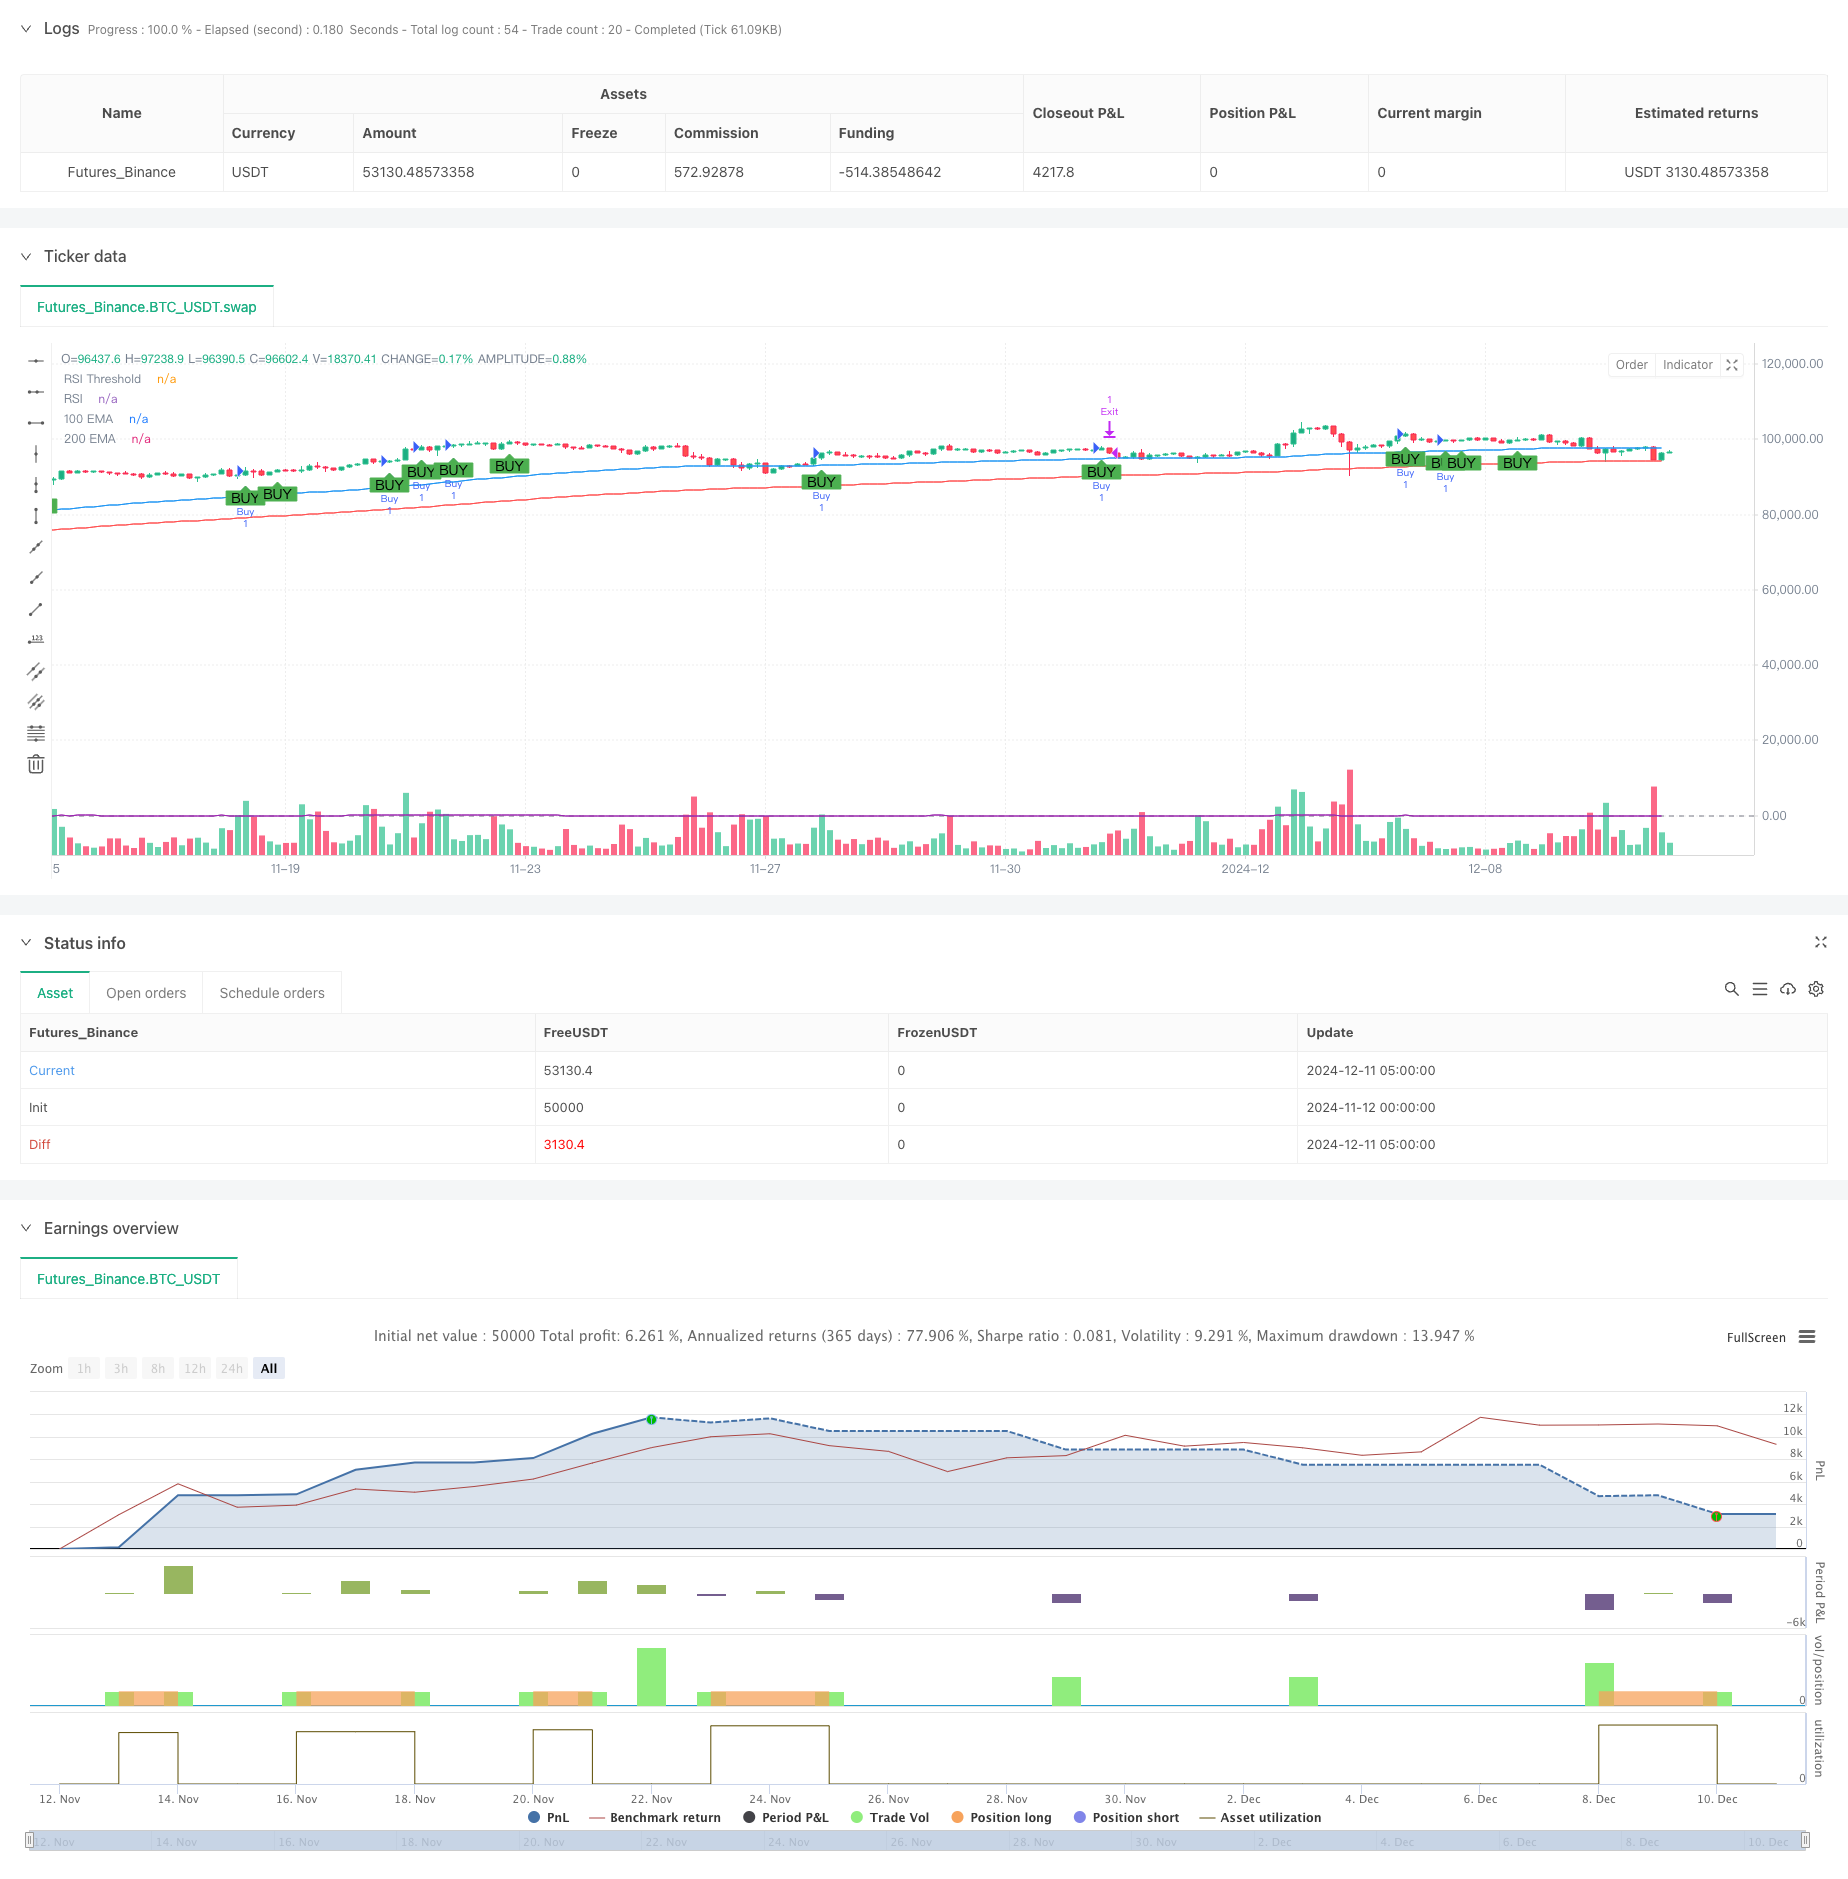
Zusammenfassen
Durch die Integration mehrerer technischer Indikatoren baut die Strategie ein logisch vollständiges Trend-Tracking-System auf. Die Vorteile der Strategie liegen in der Mehrfachsignal-Verifizierung und dem dynamischen Risikomanagement, aber auch in der Beachtung von Risiken wie Trendverzögerungen und Falschbrüchen. Die Strategie kann durch die Hinzufügung von Verkehrsbestätigung, Optimierung der Parameter-Einstellungen usw. noch erheblich verbessert werden.
/*backtest
start: 2024-11-12 00:00:00
end: 2024-12-11 08:00:00
period: 3h
basePeriod: 3h
exchanges: [{"eid":"Futures_Binance","currency":"BTC_USDT"}]
*/

//@version=5
strategy("Bullish Engulfing with EMA Crossover and ATR-Based SL/TP with RSI Filter", overlay=true)

// Inputs for moving averages
short_ema_length = input.int(100, title="Short EMA Length")
long_ema_length = input.int(200, title="Long EMA Length")

// RSI Input
rsi_length = input.int(14, title="RSI Length")
rsi_threshold = input.float(50, title="RSI Threshold")

// Calculate the Exponential Moving Averages (EMAs)
short_ema = ta.ema(close, short_ema_length)
long_ema = ta.ema(close, long_ema_length)

// Plot EMAs on the chart
plot(short_ema, color=color.blue, title="100 EMA")
plot(long_ema, color=color.red, title="200 EMA")

// Calculate RSI
rsi_value = ta.rsi(close, rsi_length)

// Plot RSI on a separate panel
hline(rsi_threshold, "RSI Threshold", color=color.gray)
plot(rsi_value, color=color.purple, title="RSI")

// Bullish Engulfing Pattern
bullish_engulfing = close > open[1] and open < close[1] and close > open

// Define strategy entry condition with RSI filter
long_condition = bullish_engulfing and short_ema > long_ema and rsi_value > rsi_threshold

// Plot a buy signal when conditions are met
plotshape(long_condition, style=shape.labelup, location=location.belowbar, color=color.green, title="Buy Signal", text="BUY")

// ATR Calculation
atr_length = input.int(14, title="ATR Length")
atr_value = ta.atr(atr_length)

// Define Stop Loss and Take Profit as levels
stop_loss_level = 1.1 * atr_value
take_profit_level = 2.0 * atr_value

// Execute Strategy Entry
if (long_condition)
    strategy.entry("Buy", strategy.long)

// Adjust SL and TP levels using the entry price
if (strategy.position_size > 0)
    // Calculate SL and TP relative to the entry price
    stop_price = strategy.position_avg_price - stop_loss_level
    limit_price = strategy.position_avg_price + take_profit_level

    // Exit strategy with SL and TP
    strategy.exit("Exit", from_entry="Buy", stop=stop_price, limit=limit_price)