Dynamische Trendverfolgungsstrategie mit mehreren Indikatoren basierend auf EMA und SMA
EMA SMA ATR PP supertrend
Strategieübersicht
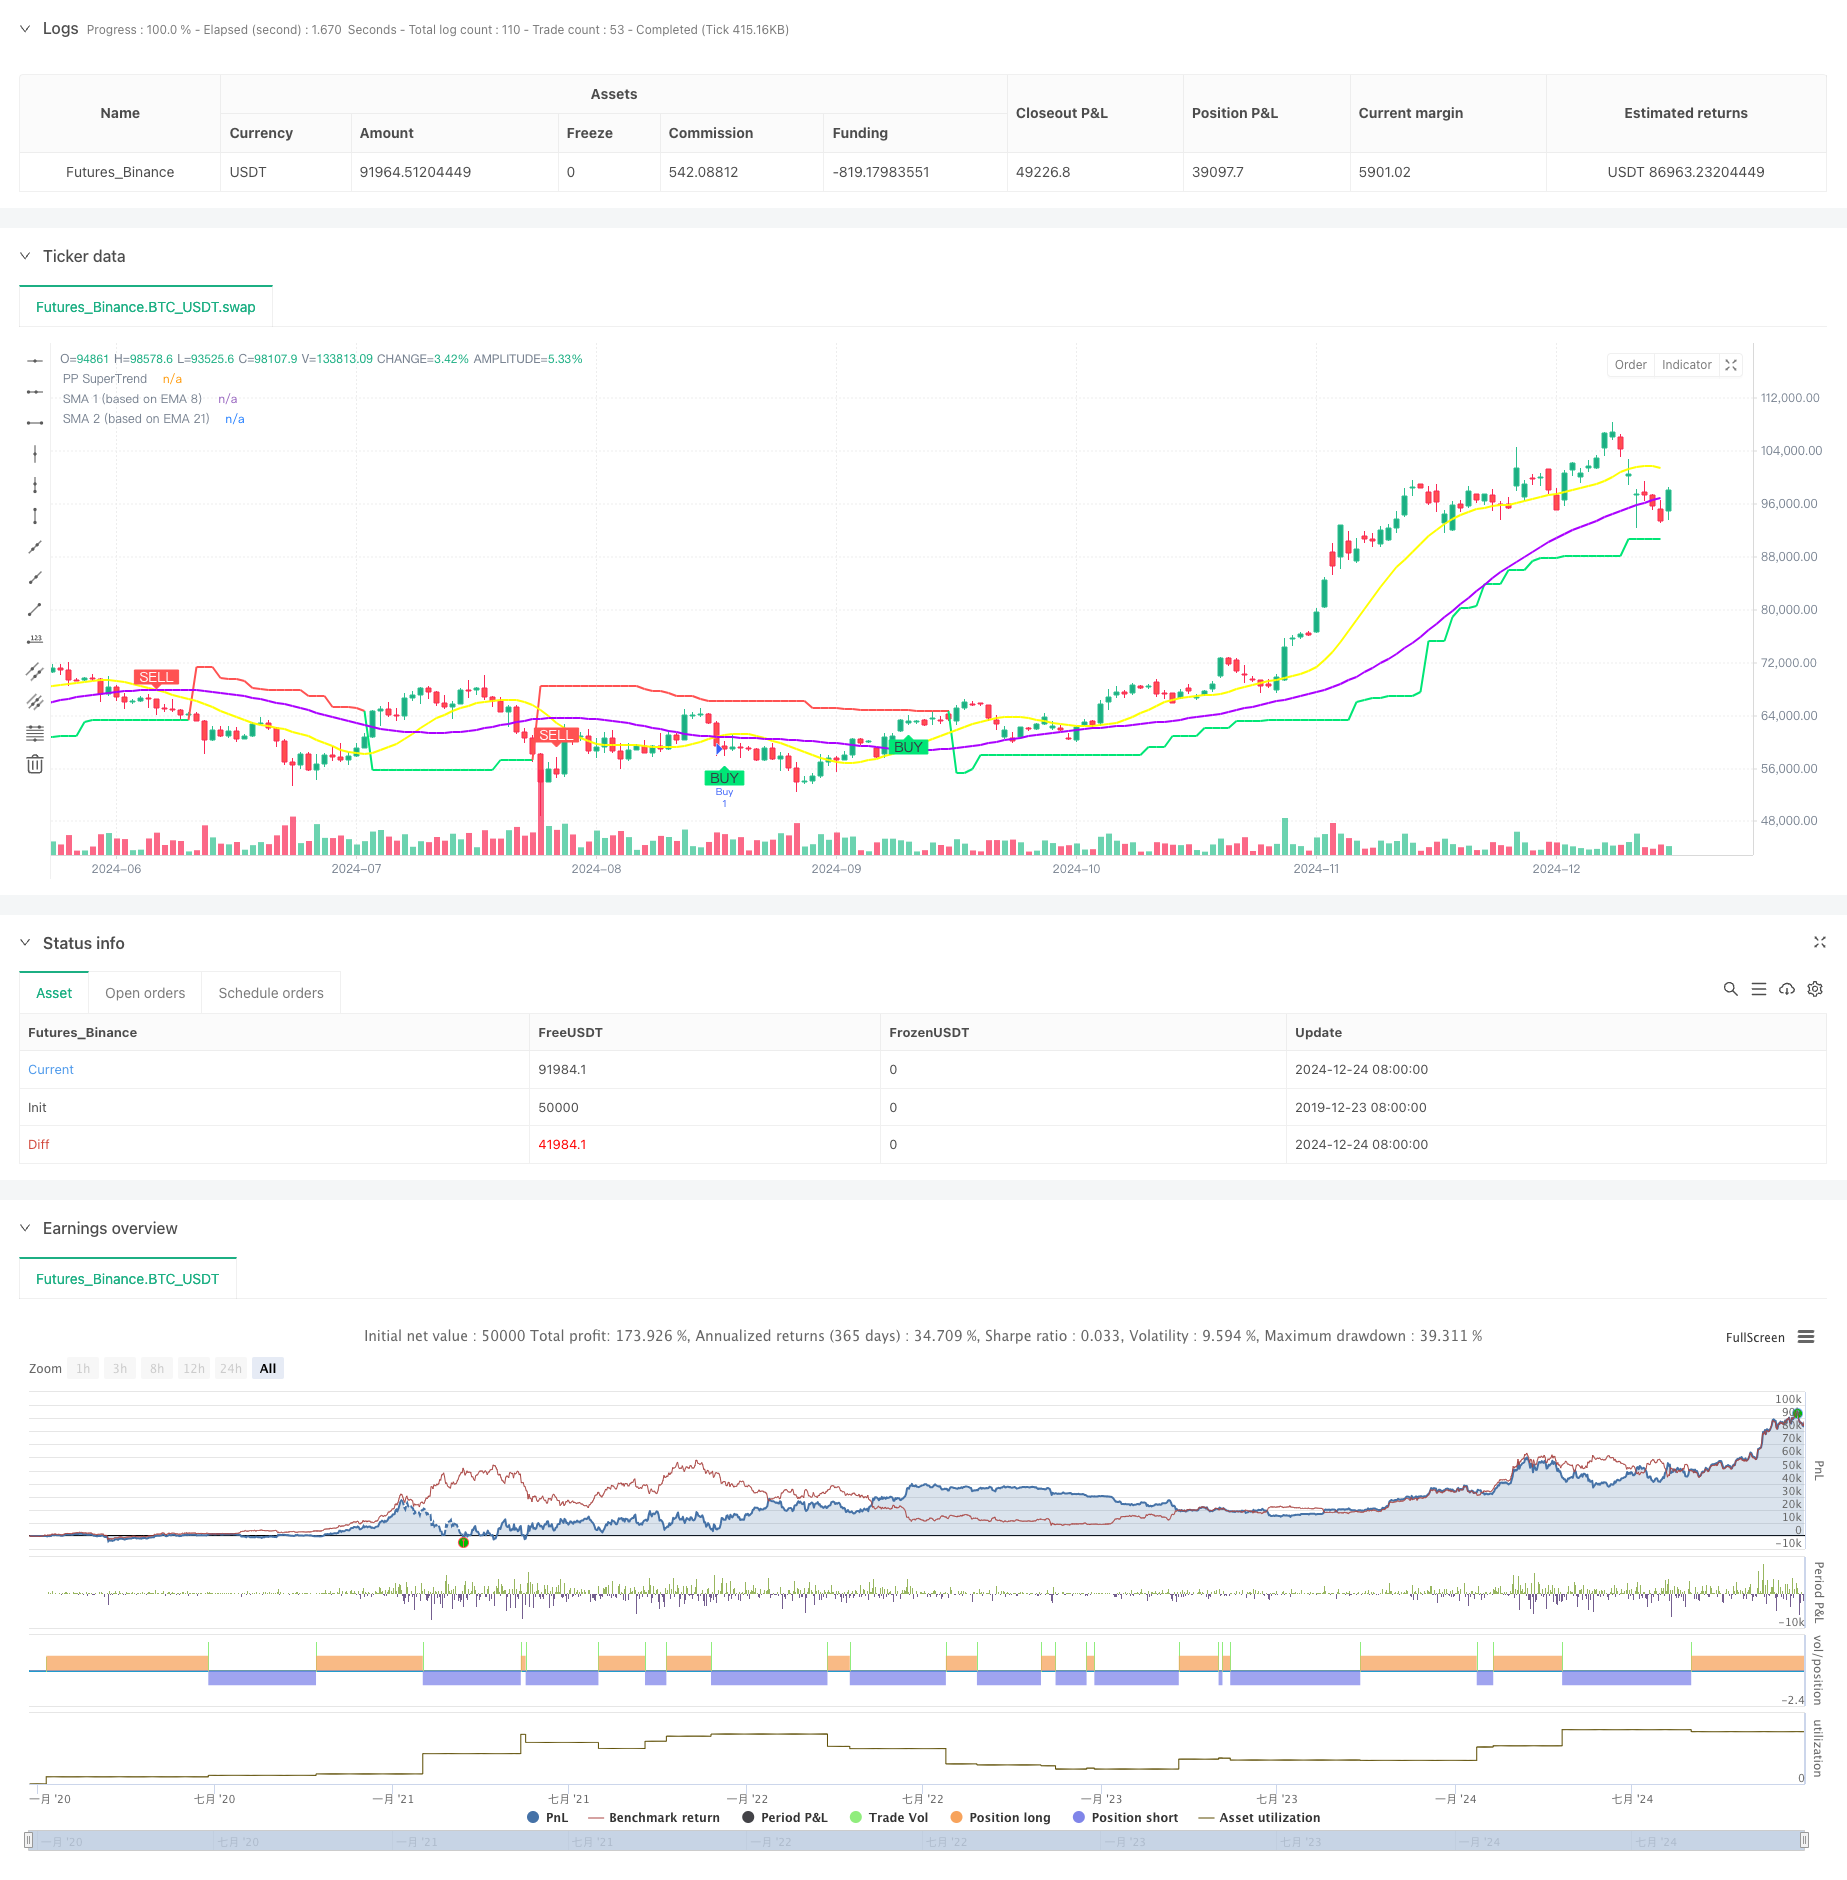
Die Strategie ist ein dynamisches Trend-Tracking-System, das mehrere technische Indikatoren kombiniert. Es identifiziert Markttrends und Handelsmöglichkeiten durch die Integration von Pivot Points, SuperTrend-Indikatoren und Kreuzsignale von Moving Averages. Die Kernmerkmale der Strategie sind die Verwendung von Analysemethoden in festen Zeiträumen, um die Einheitlichkeit der Signale zu gewährleisten und gleichzeitig die Zuverlässigkeit der Handelssignale durch die Überprüfung der Pivot-Punkte zu verbessern.
Strategieprinzip
Die Strategie basiert auf den folgenden Kernmechanismen:
- Die Analyse erfolgt über die Verwendung von Preisdaten in festen Zeitabschnitten, um Störungen durch unterschiedliche Zeiträume zu vermeiden.
- Berechnung von SMAs über 8- und 21-Zyklen EMAs als Basis für Trend-Tracking
- Der SuperTrend-Indikator wird in Kombination mit dem ATR und den Basispunkten berechnet, um die Richtung des Trends zu bestimmen
- Nur SMA-Kreuzsignale, die innerhalb von 3 Phasen auftreten, werden als gültig angesehen
- Dynamische Berechnung und Verfolgung von Unterstützungs-/Widerstandspunkten als Referenz für Handelsentscheidungen
Strategische Vorteile
- Mehrfache Kennziffer-Cross-Verifizierung zur Erhöhung der Signalsicherheit
- Fixed-Time-Cycle-Analyse zur Verringerung von Falschsignal-Störungen
- Bottom-up-Verifizierungsmechanismen, um sicherzustellen, dass die Transaktionen bei den wichtigsten Preisniveaus stattfinden
- Dynamische Tracking unterstützt Widerstandsposten, um die Stop-Loss-Stoppposition zu bestimmen
- Die Verwendung von SuperTrend-Indikatoren bietet zusätzliche Bestätigung der Trendrichtung
- Flexible Parameter-Einstellungen, die sich an unterschiedliche Marktbedingungen anpassen lassen
Strategisches Risiko
- Mehrere Anzeigen können zu Signalverzögerungen führen
- In den Horizontalmärkten könnten zu viele falsche Signale entstehen
- Die Analyse der festen Zeiträume kann wichtige Signale anderer Perioden übersehen
- Die Punkt-zu-Punkt-Verifizierung könnte zu wichtigen Handelschancen führen
- Übermäßige Optimierung der Parameter kann zu einer Überpassung führen
Richtung der Strategieoptimierung
- Einführung eines Volatilitätsfiltermechanismus, um die Handelsfrequenz während der niedrigen Volatilität zu verringern
- Zunahme der Trendstärken durch Indikatoren wie ADX oder MACD
- Entwicklung eines Anpassungsparametersystems, das die Parameter dynamisch an die Marktlage anpasst
- Fügen Sie eine Handelsvolumenanalyse hinzu, um die Signalzuverlässigkeit zu verbessern
- Implementierung eines dynamischen Stop-Loss-Mechanismus, der die Stop-Loss-Position an Marktschwankungen anpasst
Zusammenfassen
Die Strategie baut durch die Kombination von mehreren technischen Indikatoren ein relativ vollständiges Trend-Tracking-Trading-System auf. Ihr zentraler Vorteil besteht darin, die Signalzuverlässigkeit durch Fixed-Time-Cycle-Analyse und Basiswert-Verifizierung zu verbessern. Obwohl ein gewisses Rückstandsrisiko besteht, kann es durch Parameteroptimierung und Risikomanagementmaßnahmen wirksam kontrolliert werden.
/*backtest
start: 2019-12-23 08:00:00
end: 2024-12-25 08:00:00
period: 1d
basePeriod: 1d
exchanges: [{"eid":"Futures_Binance","currency":"BTC_USDT"}]
*/

//@version=6
strategy("Buy Sell Pivot Point", overlay=true)

// Input Parameters
prd = input.int(defval=2, title="Periodo Pivot Point", minval=1, maxval=50)
Factor = input.float(defval=3, title="Fator ATR", minval=1, step=0.1)
Pd = input.int(defval=10, title="Periodo ATR", minval=1)
showpivot = input.bool(defval=false, title="Mostrar Pivot Points")
showlabel = input.bool(defval=true, title="Mostrar Buy/Sell Labels")
showcl = input.bool(defval=false, title="Mostrar PP Center Line")
showsr = input.bool(defval=false, title="Mostrar Support/Resistance")
sma1_length = input.int(defval=8, title="SMA 1")
sma2_length = input.int(defval=21, title="SMA 2")
timeframe_fix = input.timeframe("D", title="Timeframe Fixo")

// Request data from the fixed timeframe
fix_close = request.security(syminfo.tickerid, timeframe_fix, close)
fix_high = request.security(syminfo.tickerid, timeframe_fix, high)
fix_low = request.security(syminfo.tickerid, timeframe_fix, low)
fix_ph = request.security(syminfo.tickerid, timeframe_fix, ta.pivothigh(prd, prd))
fix_pl = request.security(syminfo.tickerid, timeframe_fix, ta.pivotlow(prd, prd))
fix_atr = request.security(syminfo.tickerid, timeframe_fix, ta.atr(Pd))

// Convert Pivot High/Low to valid boolean for conditions
ph_cond = not na(fix_ph)
pl_cond = not na(fix_pl)

// Draw Pivot Points
plotshape(ph_cond and showpivot, title="Pivot High", text="H", style=shape.labeldown, color=color.red, textcolor=color.red, location=location.abovebar, offset=-prd)
plotshape(pl_cond and showpivot, title="Pivot Low", text="L", style=shape.labelup, color=color.lime, textcolor=color.lime, location=location.belowbar, offset=-prd)

// Calculate the Center line using pivot points
var float center = na
lastpp = ph_cond ? fix_ph : pl_cond ? fix_pl : na
if not na(lastpp)
    center := na(center) ? lastpp : (center * 2 + lastpp) / 3

// Upper/Lower bands calculation
Up = center - (Factor * fix_atr)
Dn = center + (Factor * fix_atr)

// Get the trend
var float TUp = na
var float TDown = na
var int Trend = 0
TUp := na(TUp[1]) ? Up : fix_close[1] > TUp[1] ? math.max(Up, TUp[1]) : Up
TDown := na(TDown[1]) ? Dn : fix_close[1] < TDown[1] ? math.min(Dn, TDown[1]) : Dn
Trend := fix_close > TDown[1] ? 1 : fix_close < TUp[1] ? -1 : nz(Trend[1], 1)
Trailingsl = Trend == 1 ? TUp : TDown

// Plot the trend
linecolor = Trend == 1 ? color.lime : Trend == -1 ? color.red : na
plot(Trailingsl, color=linecolor, linewidth=2, title="PP SuperTrend")

// Plot Center Line
plot(showcl ? center : na, color=showcl ? (center < fix_close ? color.blue : color.red) : na, title="Center Line")

// Calculate Base EMAs
ema_8 = ta.ema(fix_close, 8)
ema_21 = ta.ema(fix_close, 21)

// Calculate SMAs based on EMAs
sma1 = ta.sma(ema_8, sma1_length)
sma2 = ta.sma(ema_21, sma2_length)

// Plot SMAs
plot(sma1, color=#ffff00, linewidth=2, title="SMA 1 (based on EMA 8)")
plot(sma2, color=#aa00ff, linewidth=2, title="SMA 2 (based on EMA 21)")

// Initialize variables to track pivot points
var float last_pivot_time = na

// Update the pivot time when a new pivot is detected
if (ph_cond)
    last_pivot_time := bar_index
if (pl_cond)
    last_pivot_time := bar_index

// Calculate the crossover/crossunder signals
buy_signal = ta.crossover(sma1, sma2)  // SMA 8 crossing SMA 21 upwards
sell_signal = ta.crossunder(sma1, sma2)  // SMA 8 crossing SMA 21 downwards

// Ensure signal is only valid if it happens within 3 candles of a pivot point
valid_buy_signal = buy_signal and (bar_index - last_pivot_time <= 3)
valid_sell_signal = sell_signal and (bar_index - last_pivot_time <= 3)

// Plot Buy/Sell Signals
plotshape(valid_buy_signal and showlabel, title="Buy Signal", text="BUY", style=shape.labelup, color=color.lime, textcolor=color.black, location=location.belowbar)
plotshape(valid_sell_signal and showlabel, title="Sell Signal", text="SELL", style=shape.labeldown, color=color.red, textcolor=color.white, location=location.abovebar)

// Get S/R levels using Pivot Points
var float resistance = na
var float support = na
support := pl_cond ? fix_pl : support[1]
resistance := ph_cond ? fix_ph : resistance[1]

// Plot S/R levels
plot(showsr and not na(support) ? support : na, color=showsr ? color.lime : na, style=plot.style_circles, offset=-prd)
plot(showsr and not na(resistance) ? resistance : na, color=showsr ? color.red : na, style=plot.style_circles, offset=-prd)

// Execute trades based on valid signals
if valid_buy_signal
    strategy.entry("Buy", strategy.long)
if valid_sell_signal
    strategy.entry("Sell", strategy.short)

// Alerts
alertcondition(valid_buy_signal, title="Buy Signal", message="Buy Signal Detected")
alertcondition(valid_sell_signal, title="Sell Signal", message="Sell Signal Detected")
alertcondition(Trend != Trend[1], title="Trend Changed", message="Trend Changed")