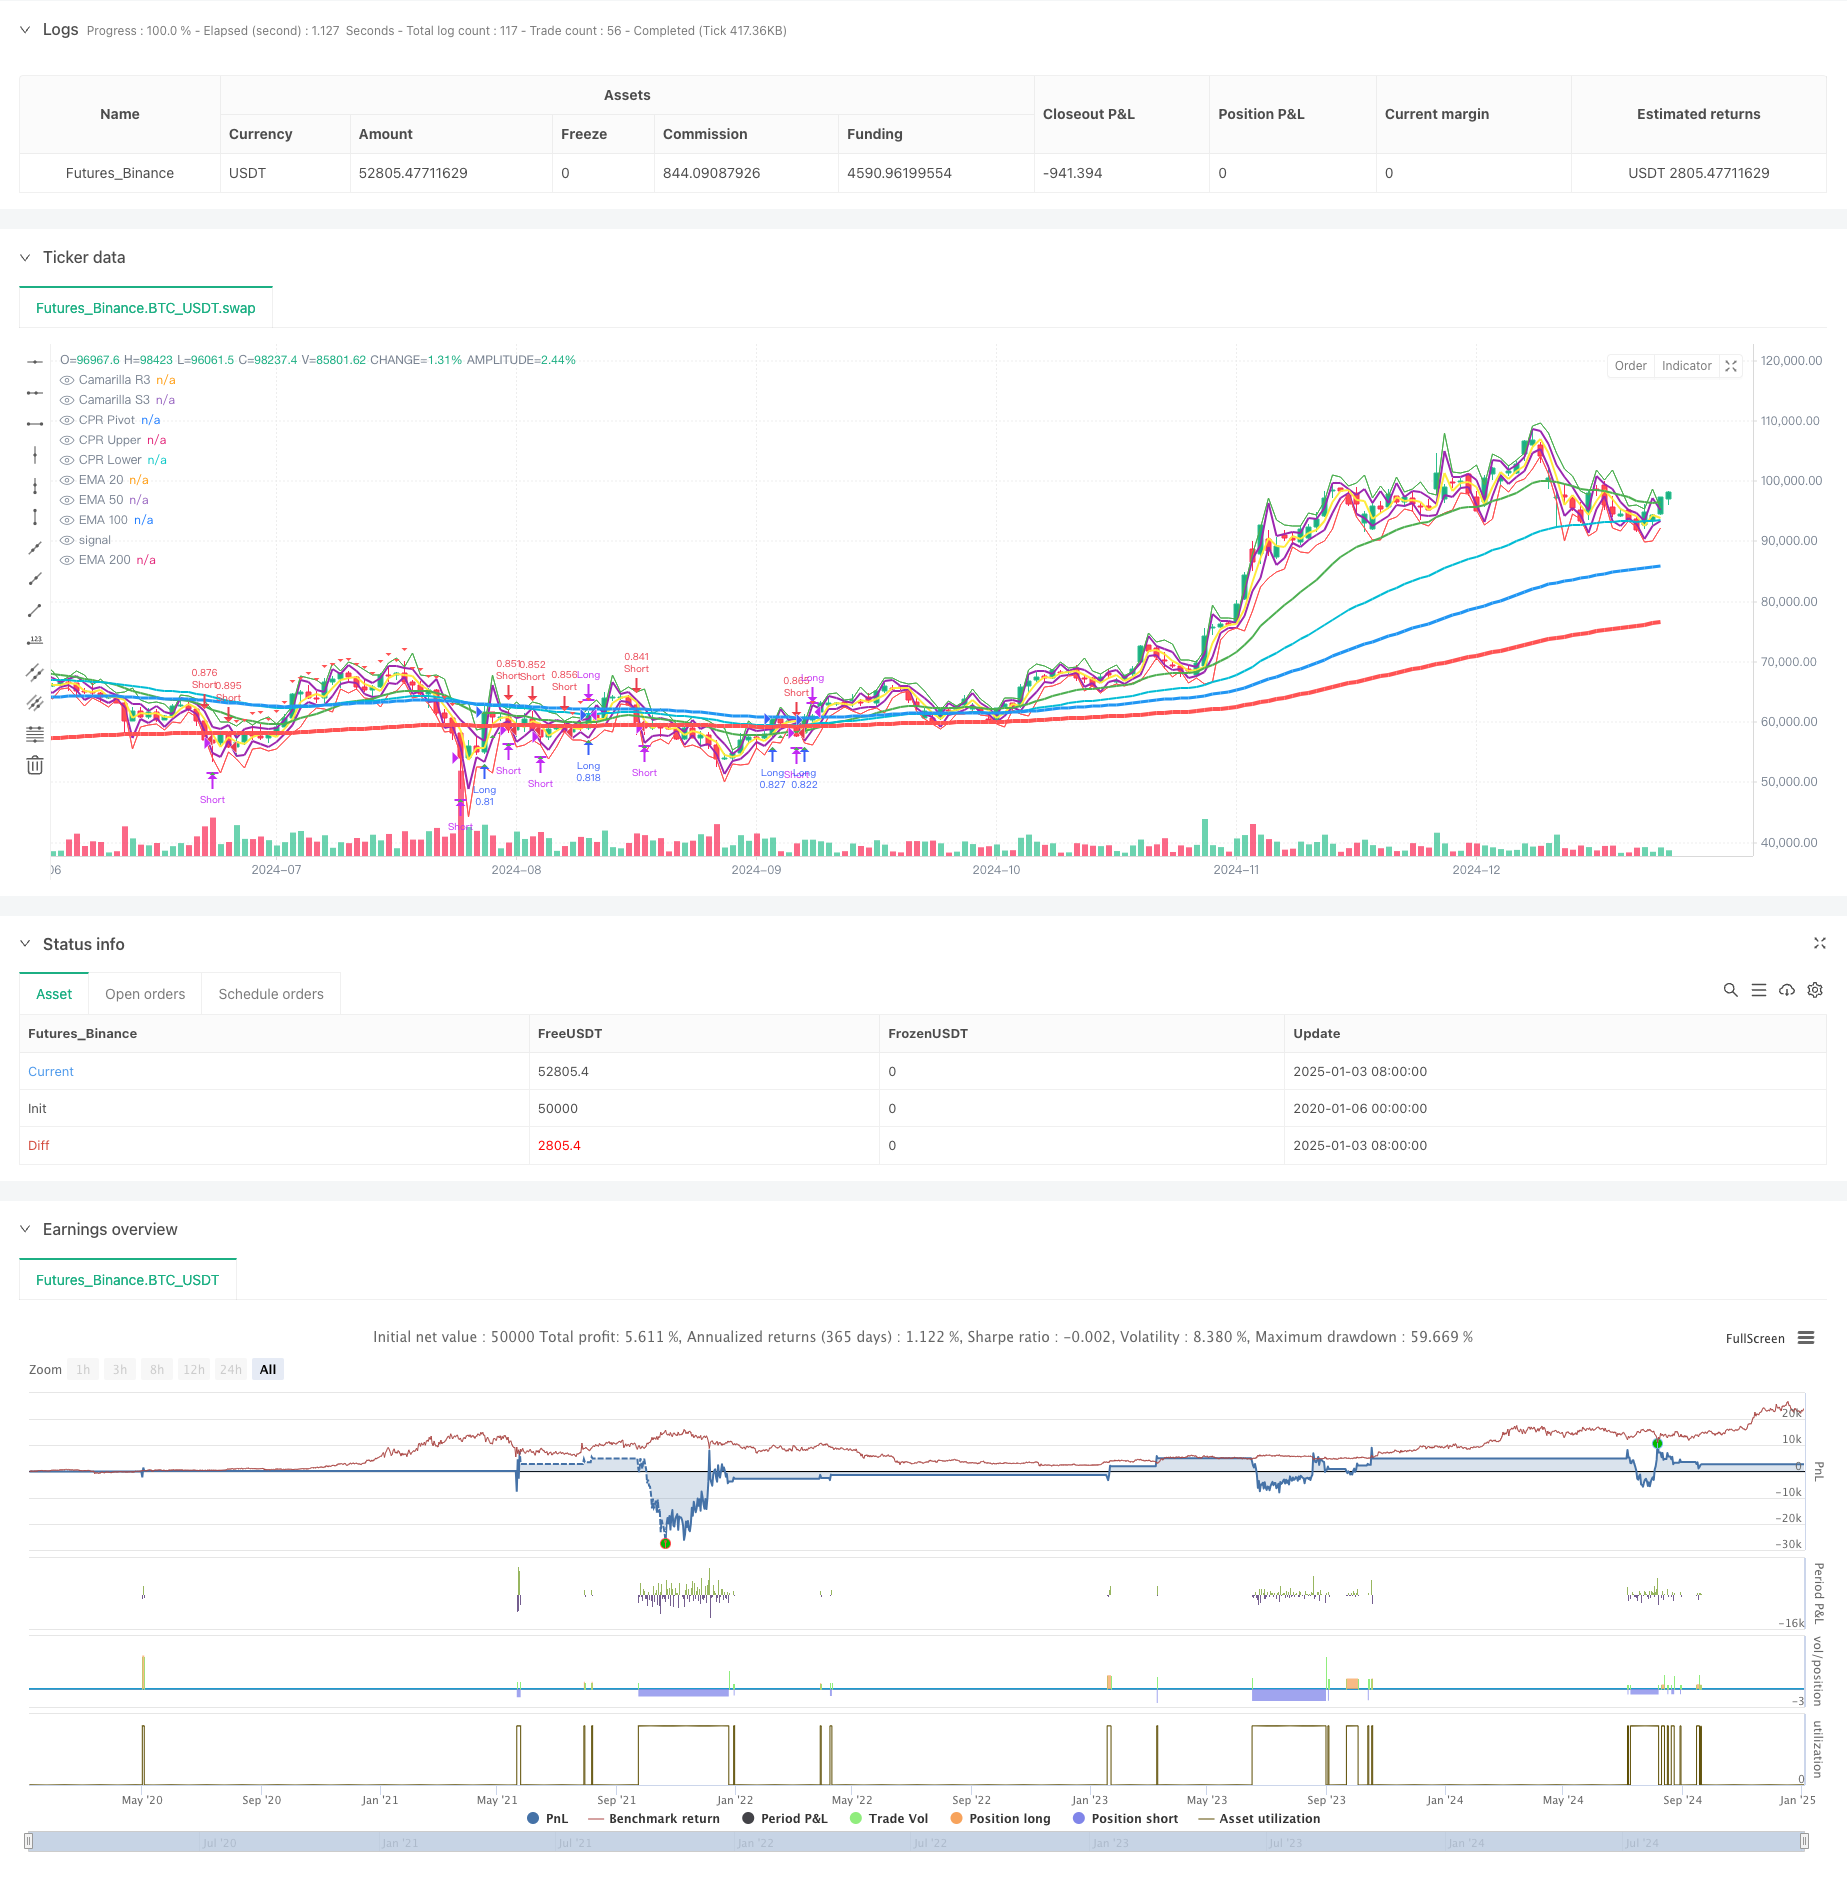
Überblick
Bei dieser Strategie handelt es sich um ein trendfolgendes Handelssystem, das mehrere exponentielle gleitende Durchschnitte (EMA), Unterstützungs- und Widerstandsniveaus von Camarilla sowie die Central Pivotal Range (CPR) kombiniert. Die Strategie identifiziert Markttrends und potenzielle Handelsmöglichkeiten, indem sie den Preis im Verhältnis zu mehreren gleitenden Durchschnitten und wichtigen Preisspannen analysiert. Das System wendet strenge Maßnahmen zur Fondsverwaltung und Risikokontrolle an, darunter prozentuale Positionsgrößen und diversifizierte Ausstiegsmechanismen.
Strategieprinzip
Die Strategie basiert auf folgenden Kernkomponenten:
- Das System mit mehreren gleitenden Durchschnittswerten (EMA20/50/100/200) wird zur Bestätigung der Trendrichtung und -stärke verwendet.
- Camarilla-Unterstützungs- und Widerstandsniveaus (R3/S3) werden verwendet, um wichtige Preisniveaus zu identifizieren
- Der Central Price Range (CPR) wird verwendet, um die Intraday-Handelsspanne zu bestimmen.
- Einstiegssignale basieren auf der Kreuzung des Preises mit EMA200 und der Bestätigung durch EMA20
- Ausstiegsstrategien umfassen Fixpunkte und prozentuale Bewegungsmodi
- Das Fondsmanagementsystem passt die Positionsgröße dynamisch an die Kontogröße an
Strategische Vorteile
- Die Kombination mehrdimensionaler technischer Indikatoren liefert zuverlässigere Handelssignale
- Flexibler Exit-Mechanismus zur Anpassung an unterschiedliche Marktumgebungen
- Perfektes Fondsmanagementsystem kontrolliert Risiken effektiv
- Trendfolgefunktionen helfen dabei, große Bewegungen zu erfassen
- Visualisierungskomponenten erleichtern Händlern das Verständnis der Marktstruktur
Strategisches Risiko
- In volatilen Märkten können falsche Signale auftreten
- Mehrere Indikatoren können zu verzögerten Handelssignalen führen
- Feste Ausstiegspunkte könnten in volatilen Märkten keine gute Leistung bringen
- Um Rückgängen standzuhalten, ist ein größerer Fonds erforderlich
- Transaktionskosten können die Gesamtrendite der Strategie beeinträchtigen
Richtung der Strategieoptimierung
- Einführung von Volatilitätsindikatoren zur dynamischen Anpassung der Ein- und Ausstiegsparameter
- Fügen Sie ein Marktstatuserkennungsmodul hinzu, um sich an unterschiedliche Marktumgebungen anzupassen
- Optimieren Sie das Fondsmanagementsystem und fügen Sie ein dynamisches Positionsmanagement hinzu
- Handelszeitfilter hinzugefügt, um die Signalqualität zu verbessern
- Erwägen Sie die Hinzufügung einer Lautstärkeanalyse, um die Signalzuverlässigkeit zu verbessern
Zusammenfassen
Diese Strategie erstellt durch die Integration mehrerer klassischer technischer Analysetools ein vollständiges Handelssystem. Die Vorteile des Systems liegen in der mehrdimensionalen Marktanalyse und einem strikten Risikomanagement, allerdings muss auch auf die Anpassungsfähigkeit an unterschiedliche Marktumgebungen geachtet werden. Durch kontinuierliche Optimierung und Verbesserung soll die Strategie die Rentabilität steigern und gleichzeitig die Stabilität aufrechterhalten.
/*backtest
start: 2020-01-06 00:00:00
end: 2025-01-04 08:00:00
period: 1d
basePeriod: 1d
exchanges: [{"eid":"Futures_Binance","currency":"BTC_USDT"}]
*/

//@version=5
strategy("Pradeep Crude oil Entry and Exit", overlay=true)

// Input settings for EMAs
ema20_period = input.int(20, title="EMA 20 Period")
ema50_period = input.int(50, title="EMA 50 Period")
ema100_period = input.int(100, title="EMA 100 Period")
ema200_period = input.int(200, title="EMA 200 Period")

// Fixed line width settings for EMAs
ema20_width = 2  // EMA 20 Line Width
ema50_width = 2  // EMA 50 Line Width
ema100_width = 3 // EMA 100 Line Width
ema200_width = 4 // EMA 200 Line Width

// Backtesting inputs
initial_capital = input.float(50000, title="Initial Capital", minval=100)
position_size_percent = input.float(100, title="Position Size (% of Capital)", minval=0.1, maxval=100)
exit_mode = input.string("Price Movement", title="Exit Mode", options=["Price Movement", "Percentage Movement"])
exit_points = input.int(20, title="Exit After X Points", minval=1)
exit_percentage = input.float(1.0, title="Exit After X% Movement", minval=0.1, step=0.1)

// Calculate EMAs
ema20 = ta.ema(close, ema20_period)
ema50 = ta.ema(close, ema50_period)
ema100 = ta.ema(close, ema100_period)
ema200 = ta.ema(close, ema200_period)

// Signal conditions
long_entry_condition = close > ema200 and close > ema20 and close[1] <= ema200
long_exit_condition = (exit_mode == "Price Movement" and close - strategy.position_avg_price >= exit_points * syminfo.mintick) or
                      (exit_mode == "Percentage Movement" and (close - strategy.position_avg_price) / strategy.position_avg_price * 100 >= exit_percentage)
short_entry_condition = close < ema200 and close < ema20 and close[1] >= ema200
short_exit_condition = (exit_mode == "Price Movement" and strategy.position_avg_price - close >= exit_points * syminfo.mintick) or
                       (exit_mode == "Percentage Movement" and (strategy.position_avg_price - close) / strategy.position_avg_price * 100 >= exit_percentage)

// Plot EMAs with specified line widths
plot(ema20, color=color.green, title="EMA 20", linewidth=ema20_width)
plot(ema50, color=color.aqua, title="EMA 50", linewidth=ema50_width)
plot(ema100, color=color.blue, title="EMA 100", linewidth=ema100_width)
plot(ema200, color=color.red, title="EMA 200", linewidth=ema200_width)

// Camarilla Pivot Calculation
prev_high = request.security(syminfo.tickerid, "D", high[1])
prev_low = request.security(syminfo.tickerid, "D", low[1])
prev_close = request.security(syminfo.tickerid, "D", close[1])

R3 = prev_close + (prev_high - prev_low) * 1.1 / 2
S3 = prev_close - (prev_high - prev_low) * 1.1 / 2

// Central Pivot Range (CPR) Calculation
pivot = (prev_high + prev_low + prev_close) / 3
upper_cpr = pivot + (prev_high - prev_low)
lower_cpr = pivot - (prev_high - prev_low)

// Plot Camarilla R3, S3 and CPR levels
plot(R3, color=color.purple, title="Camarilla R3", linewidth=2)
plot(S3, color=color.purple, title="Camarilla S3", linewidth=2)
plot(pivot, color=color.yellow, title="CPR Pivot", linewidth=2)
plot(upper_cpr, color=color.green, title="CPR Upper", linewidth=1)
plot(lower_cpr, color=color.red, title="CPR Lower", linewidth=1)

// Backtesting: Capital and position size
capital = initial_capital
risk_per_trade = (position_size_percent / 100) * capital

// Long positions
if long_entry_condition
    strategy.entry("Long", strategy.long, qty=risk_per_trade / close)
    // Display entry price label
    label.new(bar_index, close, text="Entry: " + str.tostring(close), color=color.green, style=label.style_label_up, yloc=yloc.belowbar)

if long_exit_condition
    strategy.close("Long")
    // Display exit price label
    label.new(bar_index, close, text="Exit: " + str.tostring(close), color=color.red, style=label.style_label_down, yloc=yloc.abovebar)

// Short positions
if short_entry_condition
    strategy.entry("Short", strategy.short, qty=risk_per_trade / close)
    // Display entry price label
    label.new(bar_index, close, text="Entry: " + str.tostring(close), color=color.red, style=label.style_label_down, yloc=yloc.abovebar)

if short_exit_condition
    strategy.close("Short")
    // Display exit price label
    label.new(bar_index, close, text="Exit: " + str.tostring(close), color=color.green, style=label.style_label_up, yloc=yloc.belowbar)

// Plot signals
plotshape(long_entry_condition, style=shape.triangleup, location=location.belowbar, color=color.new(color.green, 0), size=size.small, title="Long Entry")
plotshape(long_exit_condition, style=shape.triangledown, location=location.abovebar, color=color.new(color.red, 0), size=size.small, title="Long Exit")
plotshape(short_entry_condition, style=shape.triangledown, location=location.abovebar, color=color.new(color.red, 0), size=size.small, title="Short Entry")
plotshape(short_exit_condition, style=shape.triangleup, location=location.belowbar, color=color.new(color.green, 0), size=size.small, title="Short Exit")