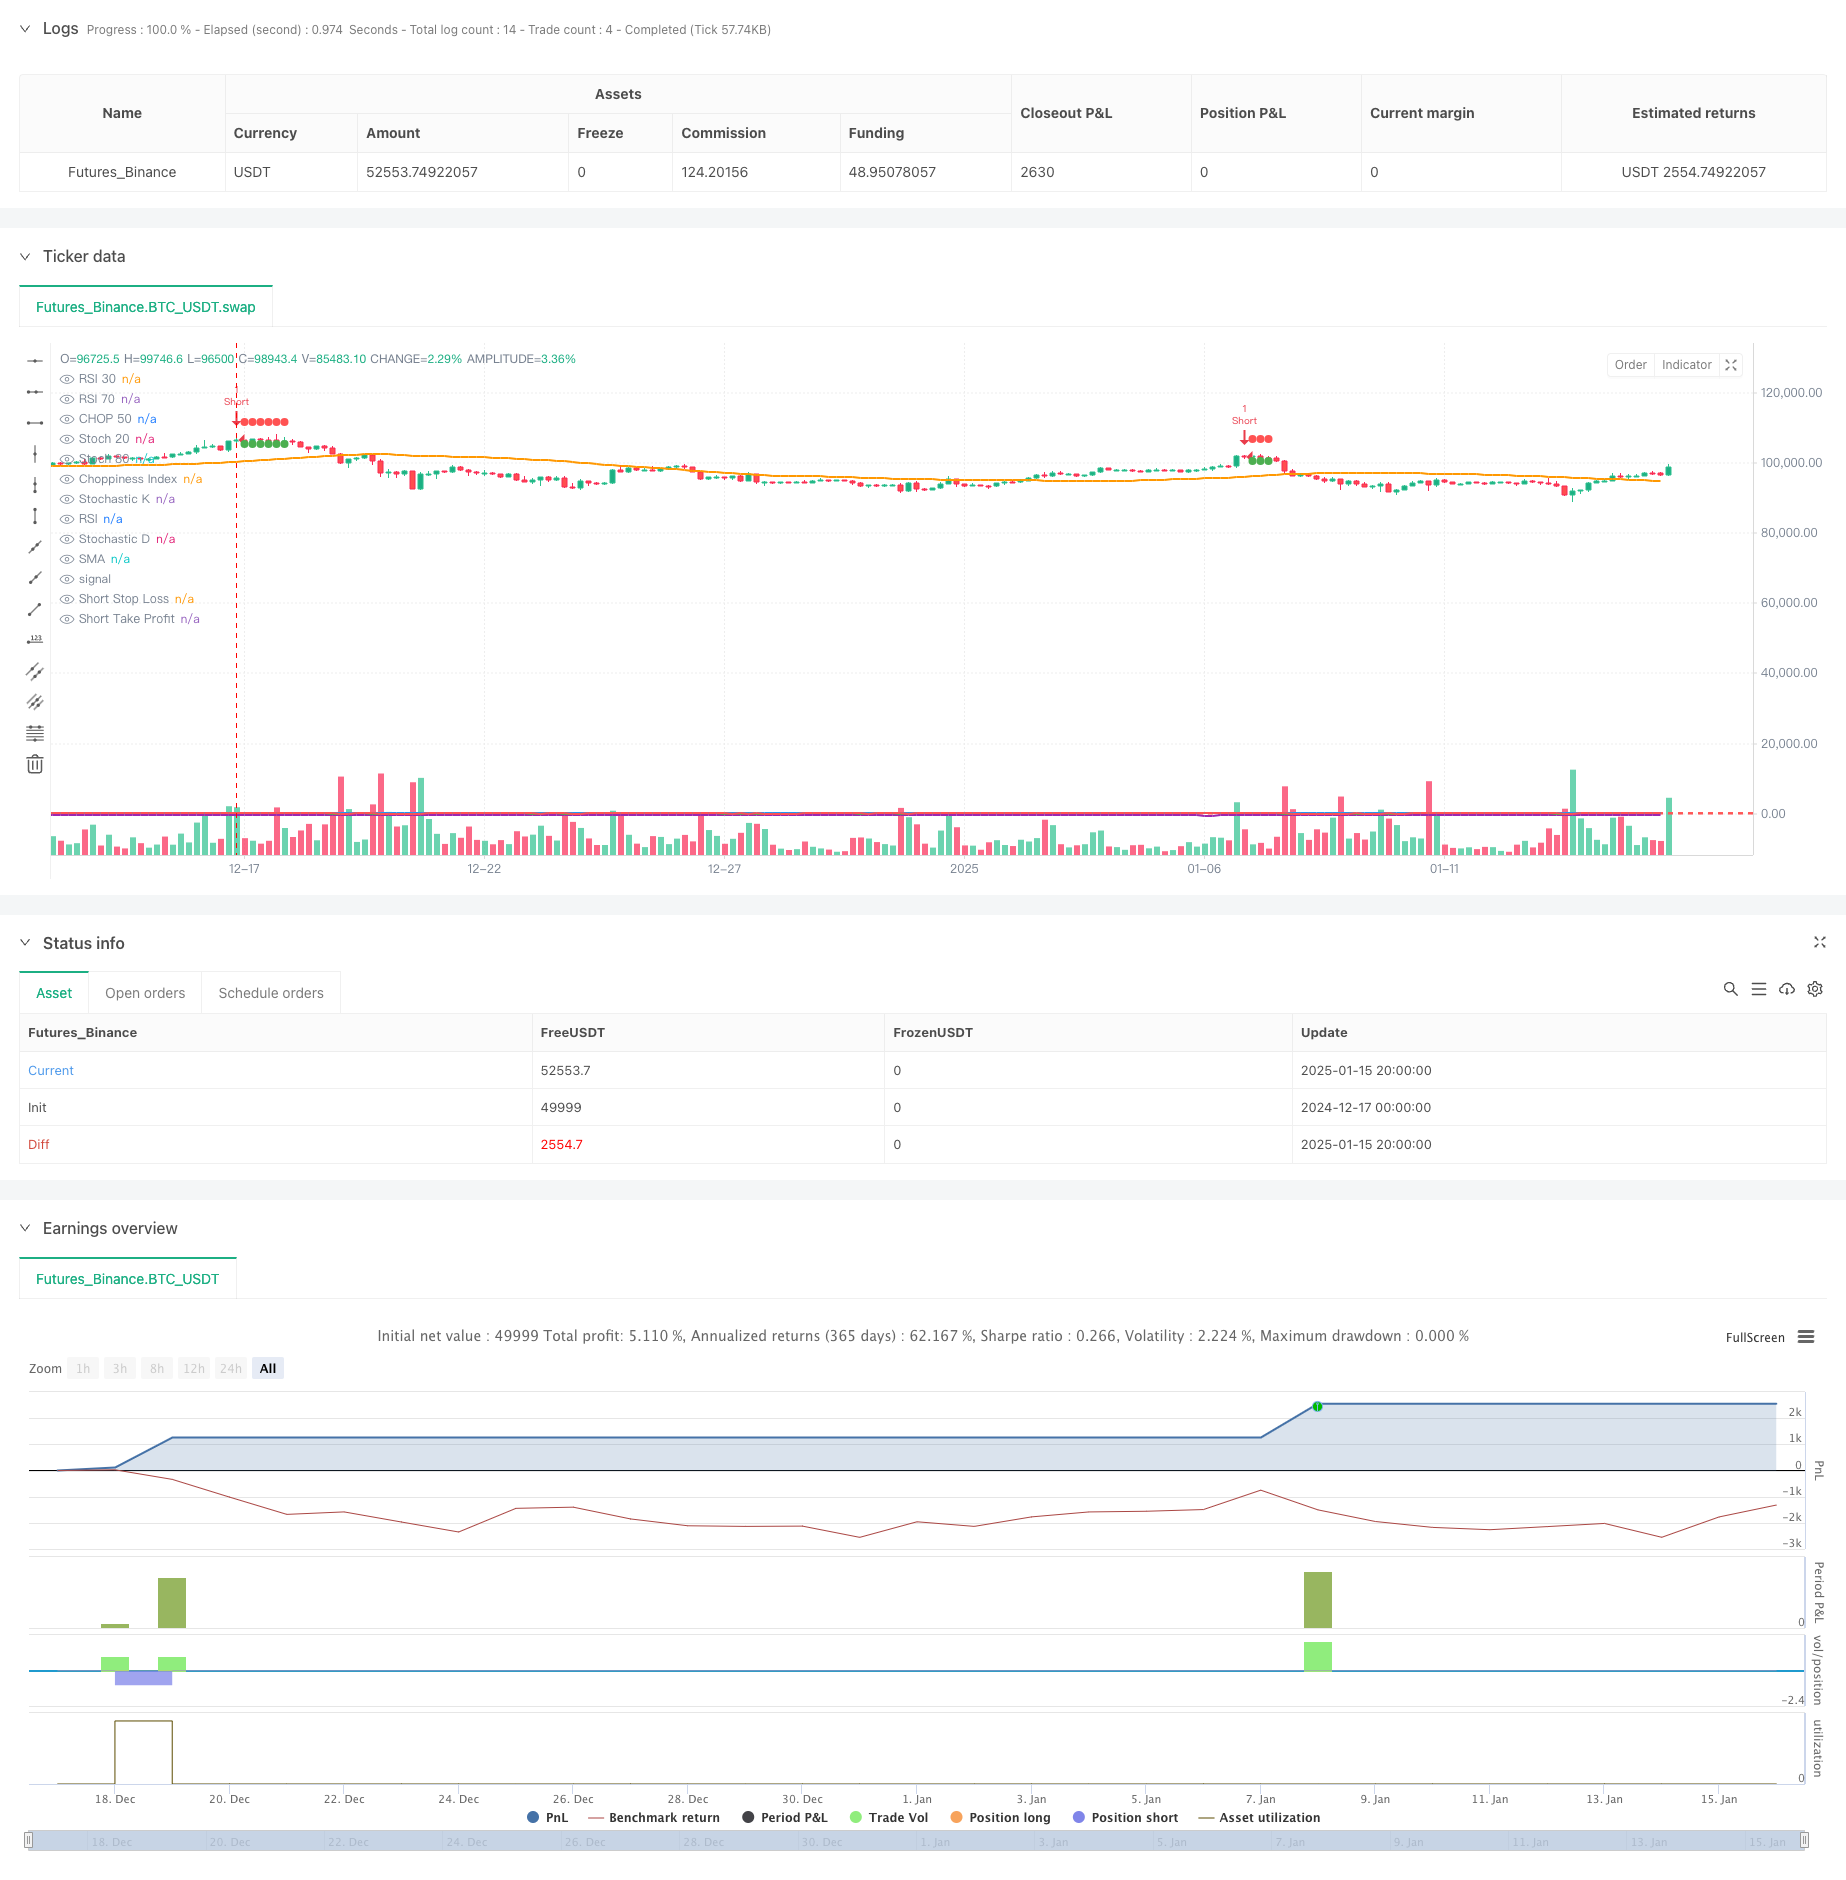
Überblick
Diese Strategie ist ein automatisiertes Handelssystem, das mehrere technische Indikatoren kombiniert. Es identifiziert hauptsächlich Markttrends durch die Koordination von RSI (Relative Strength Index), CHOP (Cross Oscillation Index) und Stochastic und verwendet dynamische Stop-Profit- und Stop-Loss-Methoden, um der Markt. Verlustmanagement-Transaktionsrisiko. Die Strategie verwendet einen 5-Minuten-Zeitraum für den kurzfristigen Handel und verbessert die Genauigkeit und Zuverlässigkeit der Transaktionen durch eine Kreuzvalidierung mehrerer Indikatoren.
Strategieprinzip
Die Strategie verwendet vier Kernindikatoren zur Trendbestimmung und Handelssignalgenerierung:
- RSI wird verwendet, um überkaufte und überverkaufte Bedingungen zu bestimmen. RSI < 30 gilt als überverkauft und > 70 gilt als überkauft.
- Mithilfe des CHOP-Index lässt sich feststellen, ob sich der Markt in einem Schockzustand befindet. <50 deutet auf einen klaren Trend hin.
- Der Übergang der K-Linie und der D-Linie des Stochastik-Indikators dient zur Bestätigung der Handelsmöglichkeit
- SMA (Simple Moving Average) wird verwendet, um den Gesamttrend zu bestimmen
Die Handelsregeln lauten wie folgt:
- Long-Bedingungen: RSI<30 + CHOP<50 + K-Linie kreuzt D-Linie
- Bedingungen für Leerverkäufe: RSI>70 + CHOP<50 + K-Linie kreuzt unter D-Linie Die Strategie erreicht eine Risikokontrolle durch die Festlegung dynamischer Take-Profit- und Stop-Loss-Positionen in Prozent.
Strategische Vorteile
- Multi-Indikator-Kreuzvalidierung verbessert die Signalzuverlässigkeit
- Filtern Sie den volatilen Markt durch den CHOP-Index, um falsche Signale zu reduzieren
- Dynamischer Stop-Profit- und Stop-Loss-Mechanismus, passt Risikomanagementpositionen automatisch an Einstiegspreise an
- Einführung eines 5-Minuten-Zyklus, geeignet für kurzfristigen Handel und Reduzierung des Positionsrisikos
- Die Indexparameter sind einstellbar und verfügen über eine starke Anpassungsfähigkeit
Strategisches Risiko
- Mehrere Indikatoren können dazu führen, dass Handelssignale hinterherhinken
- Sie könnten einige Handelsmöglichkeiten in sehr volatilen Märkten verpassen
- Feste prozentuale Stop-Loss- und Take-Profit-Bestimmungen sind möglicherweise nicht für alle Marktbedingungen geeignet.
- Kurzfristige Transaktionen sind stärker vom Marktrauschen betroffen Zur Risikominderung wird empfohlen, ein Geldmanagement und eine Positionskontrolle durchzuführen.
Richtung der Strategieoptimierung
- Einführung eines adaptiven Parametermechanismus zur dynamischen Anpassung der Indikatorparameter an die Marktvolatilität
- Fügen Sie eine Volumenindikatorüberprüfung hinzu, um die Effektivität von Handelssignalen zu verbessern
- Entwickeln Sie dynamische Stop-Profit- und Stop-Loss-Algorithmen, um die Risikokontrollstufen automatisch an die Marktvolatilität anzupassen.
- Trendstärkefilter hinzugefügt, um die Auswahl der Handelsmöglichkeiten weiter zu optimieren
- Erwägen Sie die Einführung einer Zeitfilterung, um Perioden hoher Volatilität zu vermeiden
Zusammenfassen
Diese Strategie baut durch eine Kombination mehrerer Indikatoren und einer strengen Risikokontrolle ein relativ vollständiges Handelssystem auf. Obwohl in einigen Bereichen Optimierungsbedarf besteht, ist die Gesamtdesignidee klar und hat einen praktischen Anwendungswert. Durch kontinuierliche Optimierung und Parameteranpassung können die Stabilität und Profitabilität der Strategie weiter verbessert werden.
/*backtest
start: 2024-12-17 00:00:00
end: 2025-01-16 00:00:00
period: 4h
basePeriod: 4h
exchanges: [{"eid":"Futures_Binance","currency":"BTC_USDT","balance":49999}]
*/

//@version=5
strategy("RSI + CHOP + Stochastic Strategy", overlay=true)

// Parametry wskaźników
rsiPeriod = input(14, title="RSI Period")
chopPeriod = input(14, title="Choppiness Period")
stochK = input(14, title="Stochastic K Period")
stochD = input(3, title="Stochastic D Period")
stochSmoothK = input(3, title="Stochastic Smooth K Period")
smaPeriod = input(50, title="SMA Period")

// Parametry Take Profit i Stop Loss
longTakeProfitPct = input.float(1.0, title="Long Take Profit %", minval=0.1, step=0.1) / 100
longStopLossPct = input.float(5.0, title="Long Stop Loss %", minval=0.1, step=0.1) / 100
shortTakeProfitPct = input.float(1.0, title="Short Take Profit %", minval=0.1, step=0.1) / 100
shortStopLossPct = input.float(5.0, title="Short Stop Loss %", minval=0.1, step=0.1) / 100

// Obliczenia wskaźników
rsiValue = ta.rsi(close, rsiPeriod)

highLowRange = ta.highest(high, chopPeriod) - ta.lowest(low, chopPeriod)
chopIndex = 100 * math.log10(highLowRange / ta.sma(close, chopPeriod)) / math.log10(2)

stoch = ta.stoch(close, high, low, stochK)
k = stoch[0]
d = stoch[1]

// Obliczenia SMA
smaValue = ta.sma(close, smaPeriod)

// Warunki kupna i sprzedaży
buyCondition = (rsiValue < 30) and (chopIndex < 50) and (ta.crossover(k, d))
sellCondition = (rsiValue > 70) and (chopIndex < 50) and (ta.crossunder(k, d))

var float longStopLevel = na
var float longTakeProfitLevel = na
var float shortStopLevel = na
var float shortTakeProfitLevel = na

// Wejście w pozycję długą
if (buyCondition and na(longStopLevel))
    strategy.entry("Long", strategy.long)
    longStopLevel := na // Zresetuj poziom Stop Loss
    longTakeProfitLevel := na // Zresetuj poziom Take Profit

// Wejście w pozycję krótką
if (sellCondition and na(shortStopLevel))
    strategy.entry("Short", strategy.short)
    shortStopLevel := na // Zresetuj poziom Stop Loss
    shortTakeProfitLevel := na // Zresetuj poziom Take Profit

// Ustaw poziomy Take Profit i Stop Loss na podstawie ceny wejścia w pozycję
if (strategy.position_size > 0 and na(longTakeProfitLevel))
    longStopLevel := strategy.position_avg_price * (1 - longStopLossPct)
    longTakeProfitLevel := strategy.position_avg_price * (1 + longTakeProfitPct)

if (strategy.position_size < 0 and na(shortTakeProfitLevel))
    shortStopLevel := strategy.position_avg_price * (1 + shortStopLossPct)
    shortTakeProfitLevel := strategy.position_avg_price * (1 - shortTakeProfitPct)

// Resetowanie poziomów po wyjściu z pozycji
if (strategy.position_size == 0)
    longStopLevel := na
    longTakeProfitLevel := na
    shortStopLevel := na
    shortTakeProfitLevel := na

// Wyjście z pozycji długiej
if (strategy.position_size > 0)
    strategy.exit("Take Profit", "Long", limit=longTakeProfitLevel, stop=longStopLevel)

// Wyjście z pozycji krótkiej
if (strategy.position_size < 0)
    strategy.exit("Take Profit", "Short", limit=shortTakeProfitLevel, stop=shortStopLevel)

// Oznaczenie poziomów stop loss i take profit na wykresie
plot(series=longStopLevel, title="Long Stop Loss", color=color.red, linewidth=1, style=plot.style_circles)
plot(series=longTakeProfitLevel, title="Long Take Profit", color=color.green, linewidth=1, style=plot.style_circles)
plot(series=shortStopLevel, title="Short Stop Loss", color=color.red, linewidth=1, style=plot.style_circles)
plot(series=shortTakeProfitLevel, title="Short Take Profit", color=color.green, linewidth=1, style=plot.style_circles)

// Wyświetlanie wskaźników na wykresie
plot(rsiValue, title="RSI", color=color.blue, linewidth=2)
hline(30, "RSI 30", color=color.red)
hline(70, "RSI 70", color=color.red)

plot(chopIndex, title="Choppiness Index", color=color.purple, linewidth=2)
hline(50, "CHOP 50", color=color.red)

plot(k, title="Stochastic K", color=color.green, linewidth=2)
plot(d, title="Stochastic D", color=color.red, linewidth=2)
hline(20, "Stoch 20", color=color.red)
hline(80, "Stoch 80", color=color.red)

// Wyświetlanie SMA na wykresie
plot(smaValue, title="SMA", color=color.orange, linewidth=2)