Inventor quantification The strategy The column diagram The drawing pattern
Author: Inventors quantify - small dreams, Created: 2017-07-21 18:12:00, Updated: 2019-07-31 18:29:03Column diagrams Example diagrams
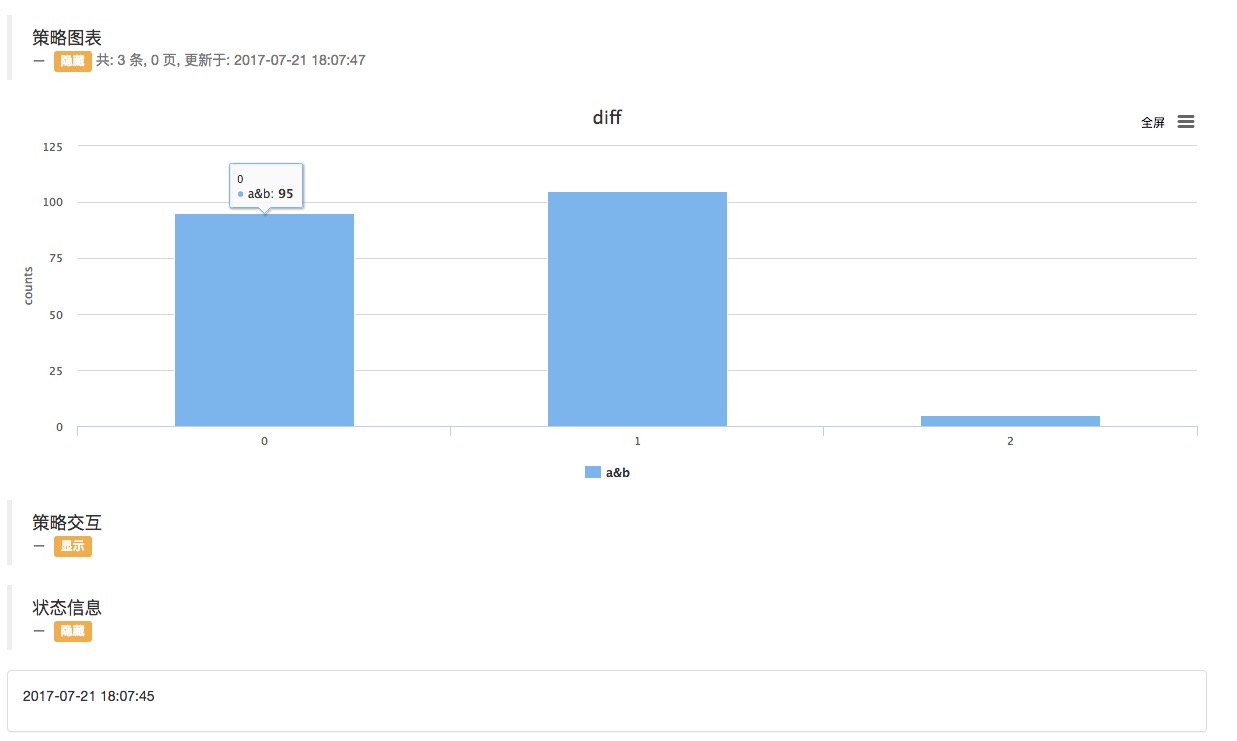
For those who do not know how to draw, here is an example.
- #### Source code: @mary_mary
var cfg = {
    __isStock: false,
    title : { text : 'diff'},
    chart : { type : 'column' },
    xAxis: { categories : []},           // cfg.xAxis.categories
    yAxis : {
        title : { text : "counts"}
    },
    series : [{
        type : "column",
        name : "a" + "&" + "b",
        data : [],                       // cfg.series.data
    }],
};

function changeNum(Num){
    if(Num > 100){
        return 0
    }
    Num += 5
    return Num
}

function main(){
    var chartObj = Chart(cfg)
    chartObj.reset()
    var a = 5
    var b = 15
    var c = 25

    chartObj.add(["a", 10])
    chartObj.add(["b", 20])
    chartObj.add(["c", 70])

    chartObj.add(["c", 55, -1])

    chartObj.update(cfg)

    while(true){
        a = changeNum(a)
        b = changeNum(b)
        c = changeNum(c)

        chartObj.add(["a", a, -3])
        chartObj.add(["b", b, -2])
        chartObj.add(["c", c, -1])
        chartObj.update(cfg)
        LogStatus(_D())
        Sleep(500)
    }
}
- #### The real disk is running:

More
- How to add bitfinex's coin exchange ETH_BTC?
- Editors problem: Some objects built in with strictly declared variables, the editor will return errors.
- Please ask how to use the futures interface to achieve a full-fledged liquidity market
- Coin Innovation District
- Newcomers ask if there is a silver lining to quantitative digital currency trading after the exchange charges a transaction fee.
- Now, when it comes to quantitative trading robots, the benefits are the least.
- How to filter the number of actual exchanges for multi-exchange objects in a multi-exchange strategy
- http://www.stevenwu.me/archives/871
- test
- How secure is it to retrieve an address as an external parameter?
- Can one server run multiple hosted processes?
- Quantified trading brainstorms are waiting for you!
- The K line is the car, the straight line is the road!
- Repeated balancing issues on some exchanges
- In a scientific and philosophical sense, how can we believe in a strategy that doesn't have logic?
- The multi-headed trend is backtracking strategy
- The root cause of the decentralization of the market to the extreme is found!
- A sustainable and efficient trading model
- Indices: Please ask about the market for OKEX contracts, is there an index?
- Multi-platform hedge stability of the leverage V2.1 (note)
The bride too.I'm going to edit /cfg.xAxis.categories, thank you.
The bride too.Can you change the underscore of each column diagram to a, b, c?
Inventors quantify - small dreamsI'm not being polite.
Inventors quantify - small dreamsYou can see the documentation of Highcharts.