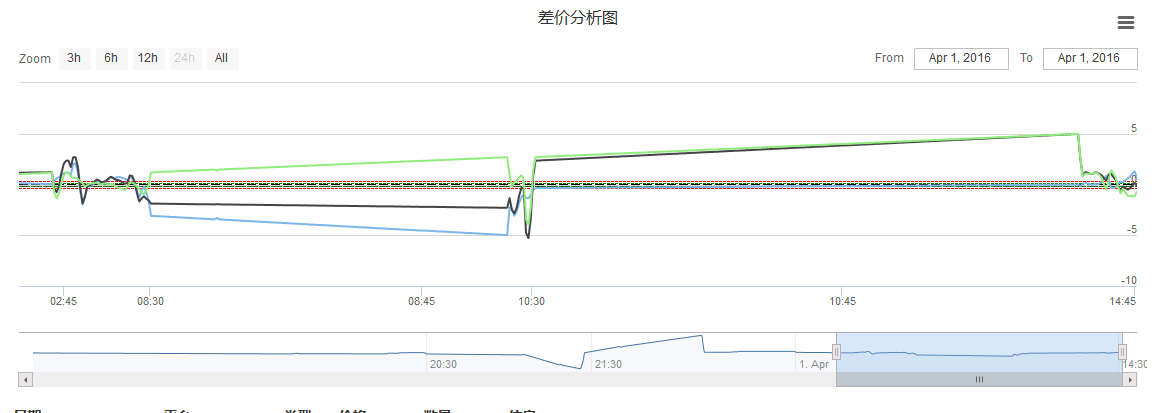
You can select the range of the graph when retesting, but it won't work after the real disk (apparently a problem after hosting 3.0)
Author: My mother-in-law, Created: 2016-04-01 19:34:44, Updated:range Selector: {
Button:
Type:
Using the system's retest, the range can be selected.
There is no range selection on the real disk.
Praying to the Great God
- Inventors quantify that after half a month of sharing a manual intervention strategy, the robot can capture the code of the manual operation information.
- It takes you into the world of quantization -- MACD two-way operation, sliding stop-loss code analysis.
- The retest chart adds indicator auto-suggestion, and indicators and parameters used by the strategy can be displayed directly in the chart after retesting is complete.
- Icebreaker (original version) code analysis, please correct if there are errors.
- Bitcoin futures hedging strategy discussed
- Quantified trading starting line
- On the future review
- The 30 lines of code take you into the world of quantitative investing.
- We've got a list of the most popular sites on Github, and we've got a list of the most popular sites on Github.
- 。。
- ddn
- Added exchanges, can, can, custom select trading currencies
- I'm going to suggest a retest system.
- A network error occurred while accessing the exchange API
- Host v3.0 release, one hard upgrade, compatible with older versions as of 2016/03/31
- And please, my goodness, my account, when reviewed, can't add up to profit or loss.
- Hedging in the cold winter
- Please help!
- Okcoin has a problem with international payments, is there a bug in the trustee?
- Inventor quantized retest, K line history records only one array ((resolved))
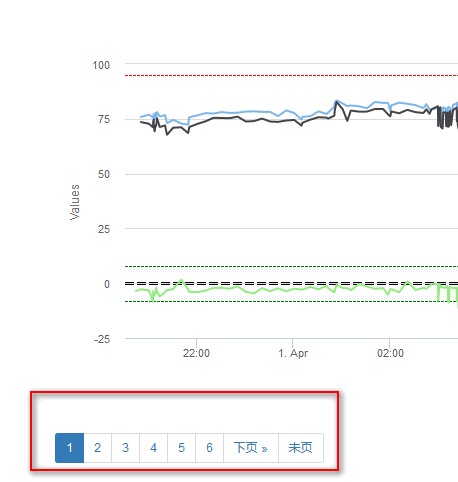
Zero 可能是数据太多了吧,新版本的图表会分页显示的如果数据过多的话.
allenfrostlineIt's good.
ZeroIf you load too much data at once, it will cause the page to crash. If you split a page into 1000 pieces of data at a time, try to limit the number of times the data is displayed, for example 300 days, 3 times a day, you can see a year's worth of data without splitting a page.
allenfrostlineIf you want a chart that doesn't have a page spread, how do you set it up? For example, I want to get an overall picture of the price trend.
My mother-in-lawThere's not a lot of new data, and there isn't.