Newcomer: Use _Cross ()) or custom method to judge macd gold forks and real discs, sometimes there are errors, please help!
Author: Quantify the new people, Created: 2018-12-21 20:06:47, Updated: 2018-12-21 20:07:32The following graph shows:
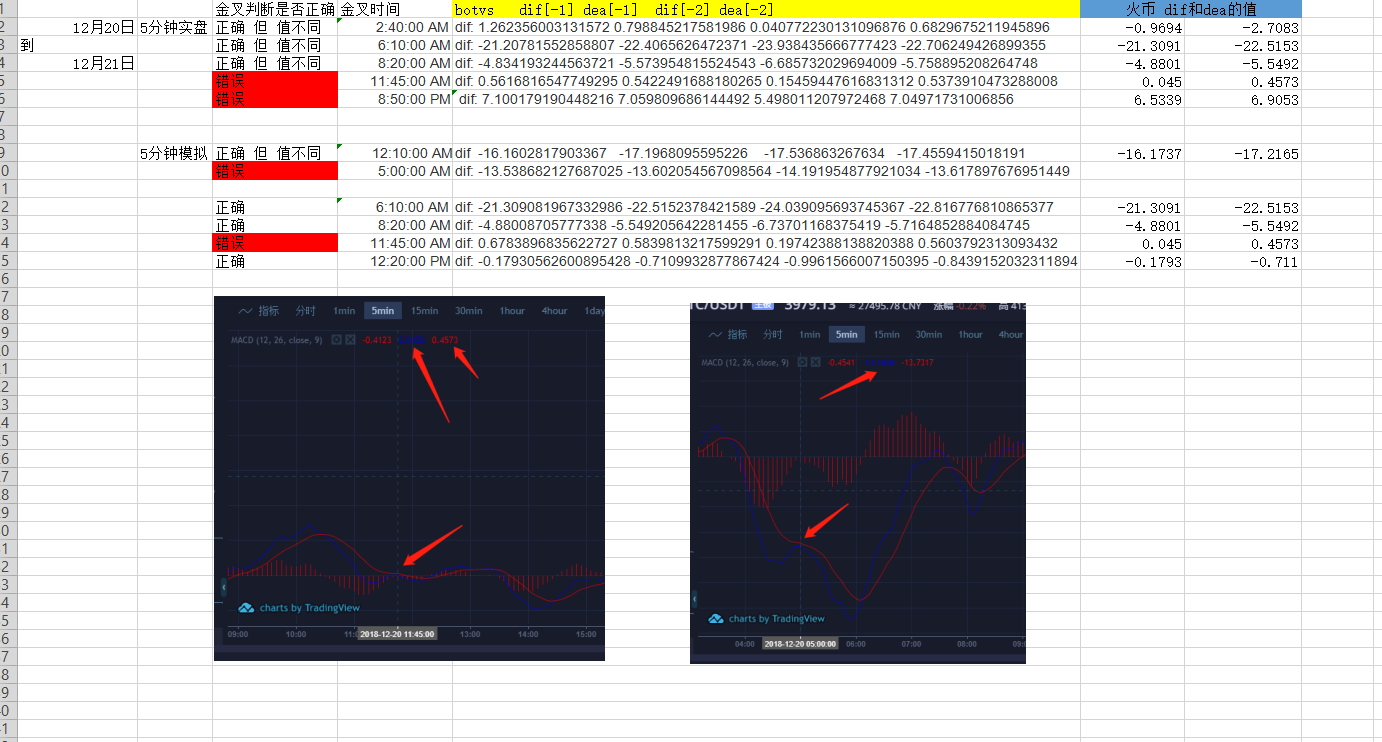
Using a retracement system: The time is set from December 20 to December 21, using 5 minutes of analogue and real-time tickers, respectively.
1. discovered at 11:45 a.m. and at 20:50 p.m. that the real-time Tickers appeared with a golden fork.
2. At 5:00 am and 11:45 am, the simulated Ticker also has a gold fork calculation error
3. Can correctly determine the golden fork at all other times.
The kid was always trying to figure it out, so he printed out the value of dif and dea separately, and finally found out 1. When the Golden Fork is wrong, the value of dif and dea are completely different from what is indicated on the coin k line. 2. When the forks are correct, the calculated value of dif and dea are sometimes not the same as the one indicated on the token k line (the different criteria are: accurate to a 4-digit decimal and then the four-fifths are still not the same)
I don't have to ask for a lot, I don't have to ask for the value of dif and dea to be the same as the value of the token on the K line chart, I just need to be able to judge the gold fork correctly, but often because of the difference in these two values, the gold fork judgement is wrong, and the gods who want to pass by are not sparing.
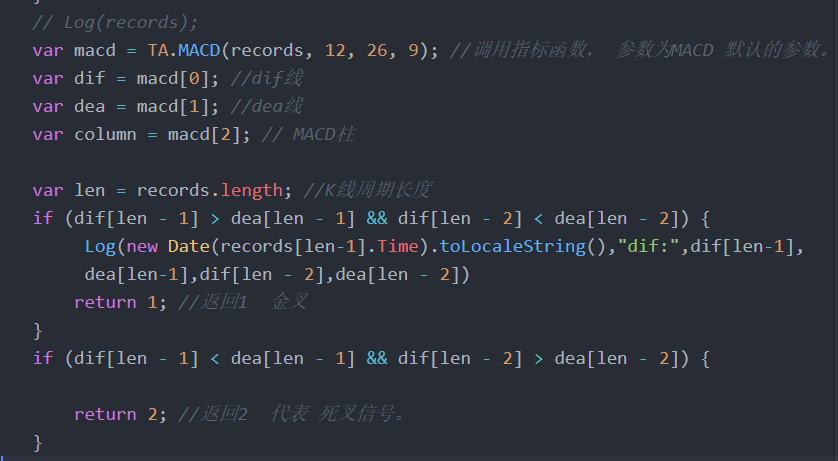
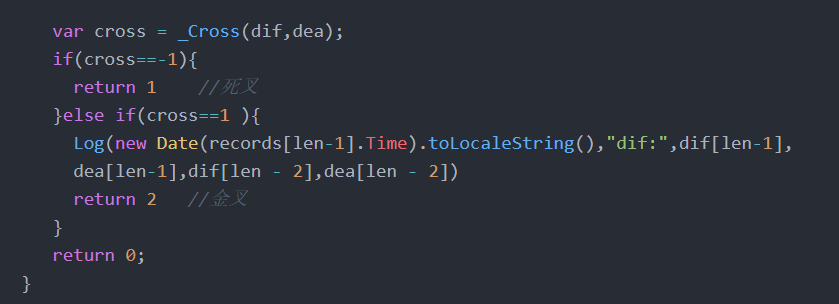
Using customized methods: Use the built-in function:
- Please, does FMZ support token futures? Please, does FMZ support OK perpetual contracts?
- In retesting, is it possible to get an updated ticker once per cycle? While the cycle of the cycle in the real disk and the cycle of the ticker update are not necessarily the same?
- About the relationship between futures exchange.SetDirection and exchange.Buy exchange.Sell
- Do you guys have any code for drawing k-lines, just draw a line, and every few tens of seconds, you'll get a paper that automatically draws a line.
- Sustainability: Can the OKEX Sustainability Contract be supported?
- Please ask when to support BCEX, thank you.
- We hope to update the contract API of GATE.
- Do you want to add a customized pair of coins to the simulated retest OKEX with only 9 coins?
- How did the super programmer who operates the digital currency get in?
- The same strategy, same scripting, js and Python, which one performs better?
- OK's lasting details: When will it go live?
- The newcomer can't come up with a TT, hoping to provide a general protocol plugin for a BBX exchange
- The GetOrder parameter problem
- We hope to launch a sync plugin for VScode
- k-line time in parameter configuration
- Can't the visualization policy set the leverage multiplier?
- How can i get the depth of the market when backtesting?
- ERR_INSUFFICIENT_ASSET from huobi
- Source code of < synthetic arbitrary period K line > on the strategy square The length of the aggregation is not correct
- Just finished and banned by Bitmex
Quantify the new peopleI see, thank you little dream big brother!
Inventors quantify - small dreamsYou use the last value of the indicator, which is the real-time value, and then when you look at the graph, the contrast is that the K line has been completed.
The grassI'm not sure I'm going to be able to do it, I'm not worried.