Chart chart. Questions about chart chart
Author: Number of investments 01, Created: 2019-08-09 05:35:29, Updated: 2019-08-09 05:39:52I'm not sure what to say.
I tried to create two chart objects, adding data, and then I tried to create a chart object, and then I tried to create a chart object. It's like it doesn't work, or it's shown in a graph.
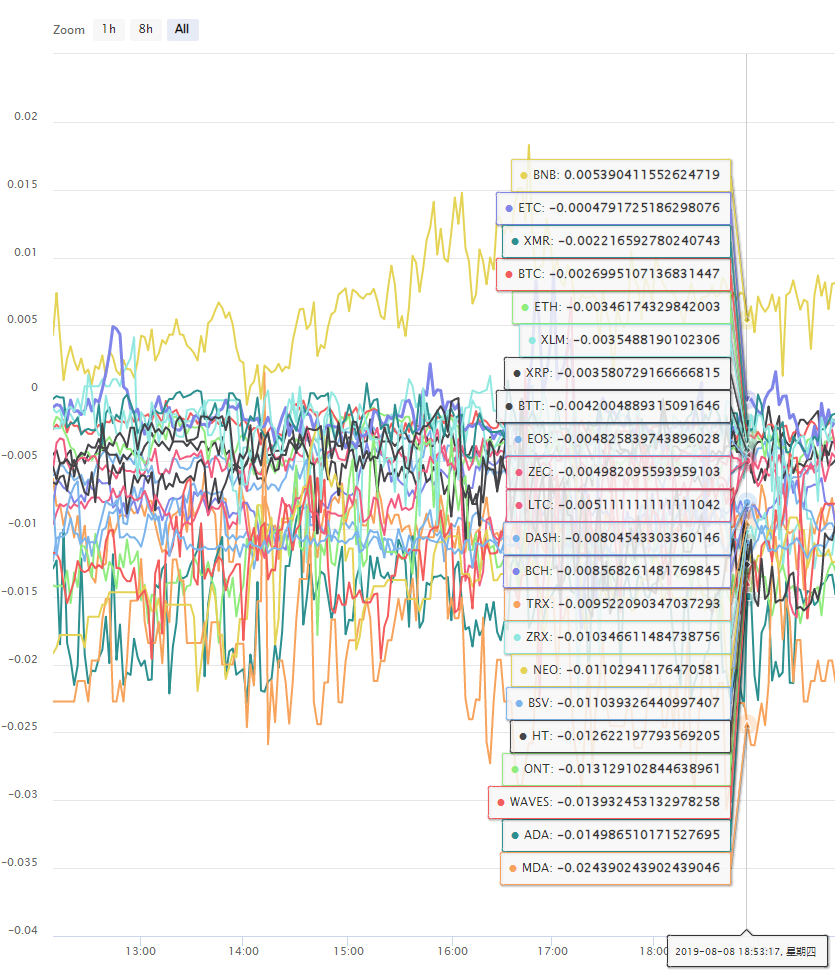
If a table displays many curves that are not visible (see figure below), can the selective switch on each curve be visible?
Thank you very much.

More
- GetAccount: 400: {"code":32002,"message":"Needed confirm futures exchange"}
- HttpQuery suspected bug feedback
- How to write a step-by-step tutorial for the FMZ Quantified Platform Strategy
- Can you create multiple files, a method in which one file calls another?
- How to use JavaScript to calculate trix pointers and ask for pointers
- Is it possible to import policies written in javascript into third-party libraries?
- Can you get a 1mK string of a certain length with GetRecords?
- FMZ Quantitative Platform Strategy Writing Tutorials for Beginners (must see)
- Using the _C function on a custom class member function does not get the correct this
- The FMZ Quantitative Platform is a must-see
- boll how to solve the return one-dimensional array problem
- A collection of exchanges that can be accessed by the network after switching the base address
- Why are the analogue and real-disc retest results different, the setup is Bitcoin's BTC_USDT, see the post
- Please teach me, how can the Ma language achieve the condition of binding a transaction?
- How do we quantify the description of common shapes like w, m?
- OKX websocket issue
- Strategy framework templates are not for empty trades
- Inventors quantify new feature "Send commands to WeChat/WeChat control disks"
- How to get a deal (paid)
- with IO, returns 4:invalid character
Number of investments 01Good luck. Thanks for the heads up!
Inventors quantify - small dreamsTwo graphs can be seen, with examples in Strategy Square: This is the first time I have seen this video. This is the first time I've seen this video.
Inventors quantify - small dreamsI'm not being polite.