How does a monkey talk about quantitative make-up roughly estimate the funding capacity of a strategy?
Author: Cousins, Created: 2020-10-05 19:10:38, Updated: 2020-10-05 19:15:30Each strategy has a different approach to calculating maximum capital capacity.
I'll give you an example of a digital currency marketing strategy:
For example, if you have a market-trading strategy and you are running a BTC/USD trading pair on an exchange, and the daily return is about 2 parts per thousand, you keep adding money, and when you increase to a certain value, the return starts to fall, say you increase from 2 million to 3 million, and the return is no longer 2 parts per thousand, then you can say that you have reached the capital capacity.
In other words, strategic capacity can be seen as a situation where 100% of the capital utilization can be maintained. When 100% of the capital utilization cannot be maintained, the strategy reaches the capacity ceiling.
So, well, how do we estimate its return with a small deviation? Here we have to analyze the model that does the marketer's strategy. We assume it is a simple spreadsheet strategy, and his model assumes that the next price of each price is 50% higher than the current price, with a probability of rise and probability of fall.
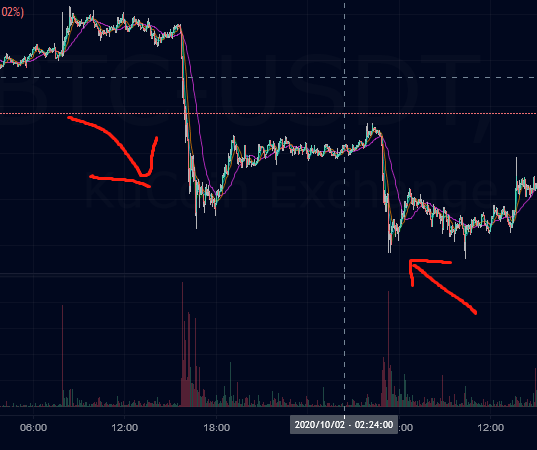
This assumption obviously doesn't hold when there are large fluctuations, so we assume that the strategy is effective for a short period of time with no large fluctuations (e.g. a fall in price relative to the current price, no more than 5% of the time can be maintained).
And then you look at the market and you find that the trading pair on this exchange is going to be around an hour to two days without any big fluctuations, and you do some statistics and you give a maximum probability value, which is four hours without any big fluctuations. (This is a typical fluctuation, for example.)
Looking at this hypothesis, it turns out that there is a 50% probability of both a buy and a sell transaction occurring on each transaction, in other words, there is a 50% probability of a no transaction and a freeze transaction occurring.
When all the funds are frozen, the transaction stops, at which point there is not enough available funds. In other words, the utilization rate of the invested funds reaches 100%.
In other words, we can roughly estimate the amount of money capacity by multiplying the number of times the amount is frozen, minus the amount of time the amount has been frozen, based on the statistical average of how long there has been no large fluctuation.
For example, if you do the math, you find $10,000, sometimes it freezes for five minutes, sometimes it freezes for half an hour, and then you calculate the most likely freezing time at about 10 minutes.
So 4 hours/10 minutes times 10,000, your strategy's capacity is roughly estimated to be around $240,000.
This estimation method is tricky, and you may have found that many of the parameters you use in your strategy here change, and this estimation method deviates greatly. For example, how much you set for each transaction is not mentioned here. Suppose you set $5,000 at once, and in one second your capital utilization is reached. You predict a very high opportunity.
Many similar forecasting methods involve quantifying the strategy and the information about the market, and then finding a correlation between the utilization rate and the change in the amount of capital based on the statistics of the information, and other parameters of the fixed strategy, such as time. Then using the market statistics, find a quantitative relationship and reverse the capacity ceiling.
From the example above, you might think that if the accuracy is high enough, it seems that it can be judged by retesting.
However, considering the volume of transactions, retrospective measurement ignores the iceberg of orders in the market, resulting in a lower estimated capacity.
Or retrospectively, simply judging whether to trade based on price without considering trading volume results in a huge strategic capacity for your forecast.
- Ask the gods, which futures order reads the unrealized loss or yield?
- Is there a way to run the underlying cycle for a minute without the system generating a tick simulation?
- A person who is familiar with tradingview's code and converts it into FMZ's platform for quantitative trading will be rewarded.
- How to get error reports
- How to export a k-string value
- What is the name of the rsi indicator on the exchange?
- Ask the following cryptocurrency exchange which historical data does not have sky-diving data, which is more accurate?
- Invalid symbol
- Bitcoin futures interface, how to deal with the ETH perpetual contract not found?
- Deployment hosts are required user string. Please see where
- Please allow the simulation to show the number of transactions: 0 - what if the maximum is 8000?
- How to set up a 10-fold leverage on BTC/USDT perpetual contracts
- Can FMZ support uniswap and balancer?
- Please update the FCOIN spot transaction
- Please tell me which currencies are supported by the OKEX Perpetual Contract?
- About websocket access and reconnection issues
- Please update the imtoken interface
- The public API of the exchange, through the ccxt library, or requests library, has been reporting errors.
- Please update the FCoin interface
- How do I get a native environment to write code? Online code tips are not supported, so writing isn't very convenient! I built a native review environment and many of the code tips don't work.