MACD, the king of the indicators, is the one who has the biggest household denomination indicator.
Author: Little white cabbage, Created: 2022-07-07 10:34:48, Updated:The Moving Average Convergence/Divergence (MACD) was proposed by Gerald Appel in the 1970s and was originally used to determine the strength, direction, energy, and trend cycle of stock price changes to identify support and pressure in order to capture the timing of stock buying and selling. It is now used in almost all other entry areas, such as the digital currency futures market, and is arguably the true king of indicators.
What do you mean?
First, get to know MACD.
What do you mean?
The MACD consists of three elements: DIF, DEA, and a red-green column chart. DIF is its fast line, DEA is its slow line, and the column chart is calculated by the DIF and DEA bias.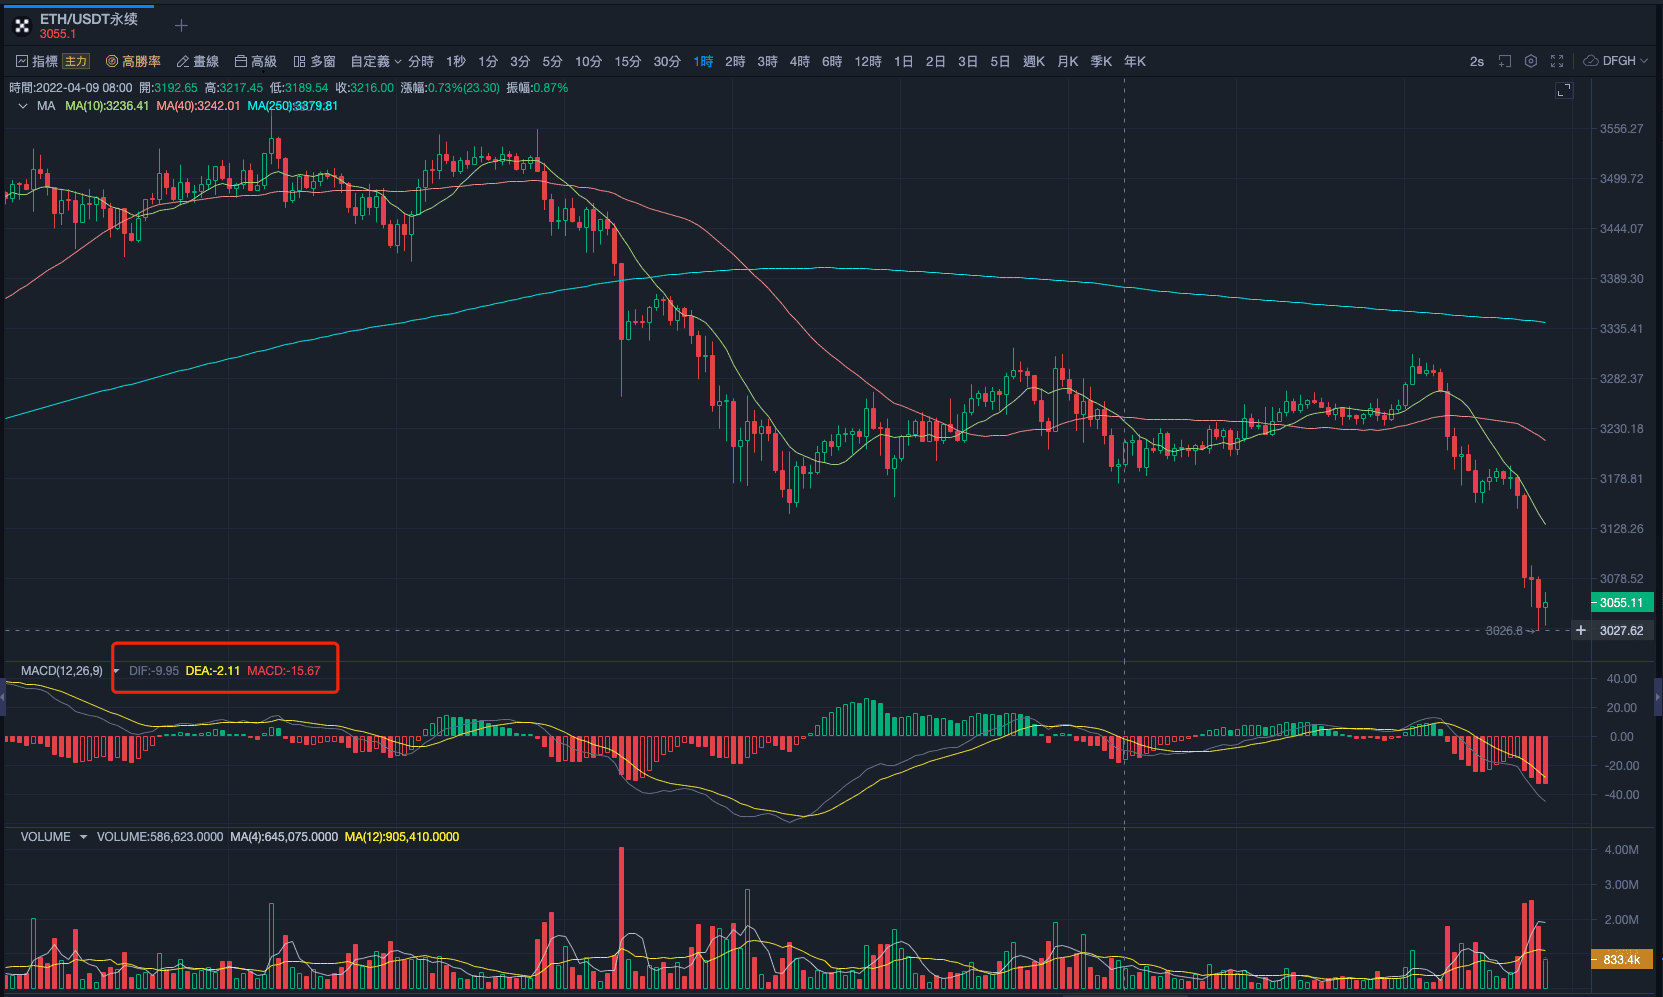
The MACD is more prominent in the medium-to-short-term trend analysis, which can be used to judge buying and selling opportunities.
What do you mean?
Second, the use of MACD1, Identify trends by the relation of the column graph to the 0 axis.For example: a k-hour chart with a green column (above the 0 axis) indicating a stronger trend for the k-line of the 1h cycle; a red column (below the 0 axis) indicating a stronger trend for the k-line of the 1h cycle.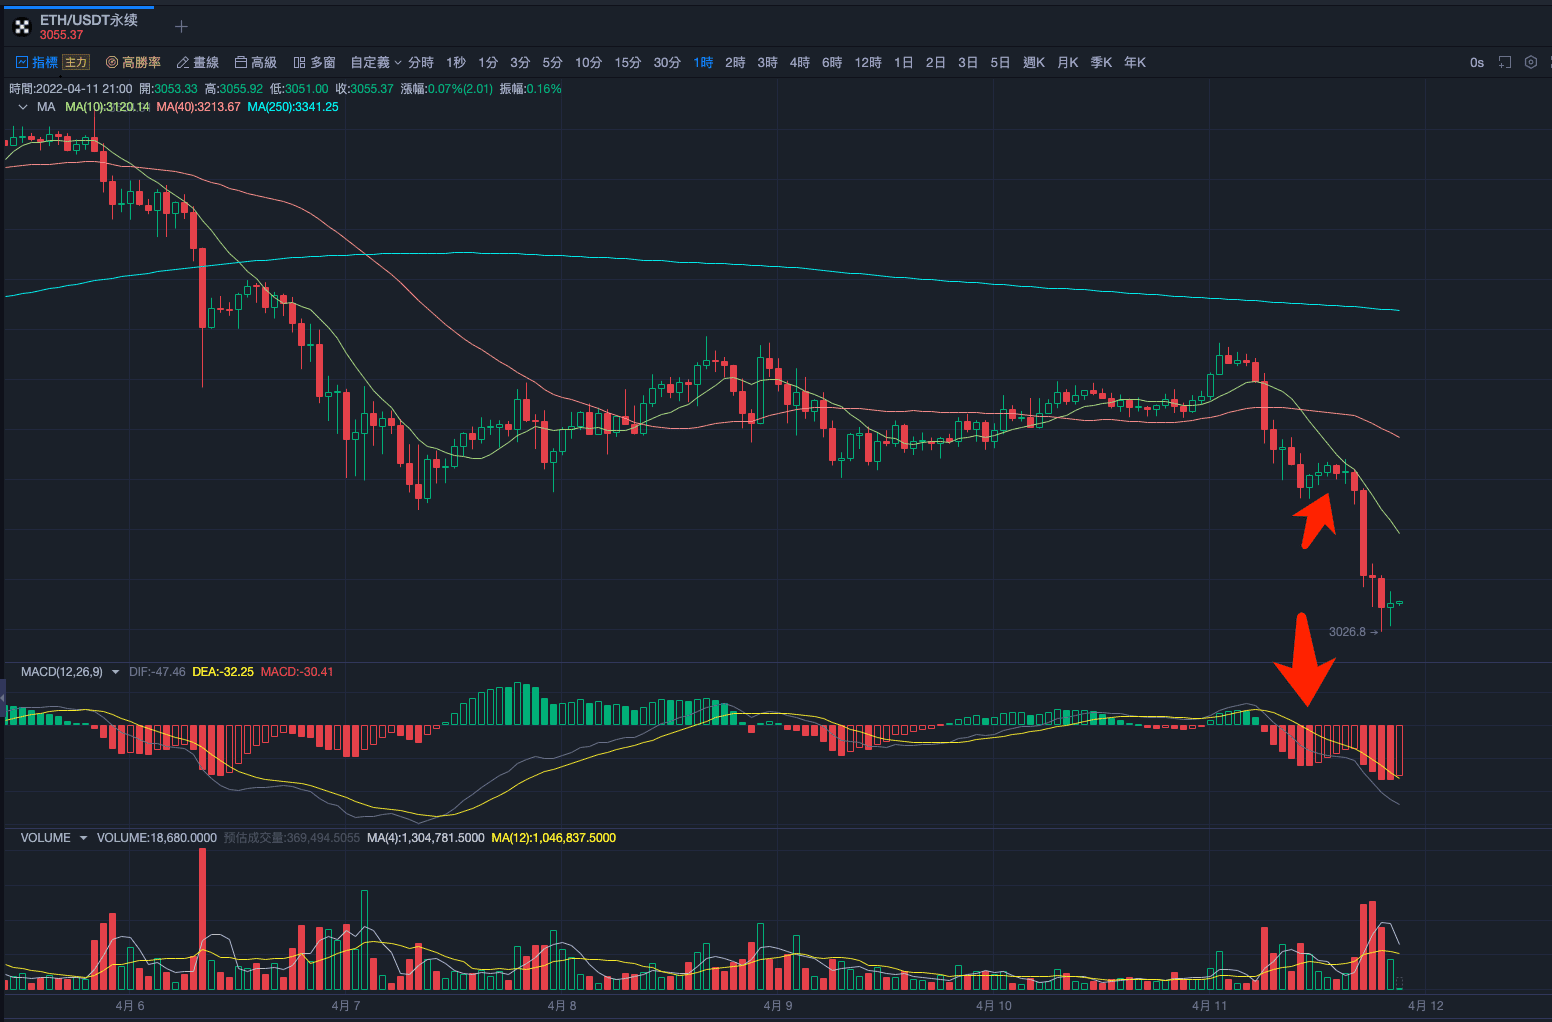
The red column in the graph, which is currently below the 0 axis, reflects the strong trend of doing nothing at this time.
What do you mean?
2 DIF and DEA's gold-forked dead-fork situation, which detects buying and selling signals under the trend.
What do you mean?
Signal 1: DIF with DEA gold forks above the zero axis, indicating a clear do-more signal under a multihead trend.
What do you mean?
Example: 1 hour k-line chart, after the gold fork above the zero axis, the price subsequently rises.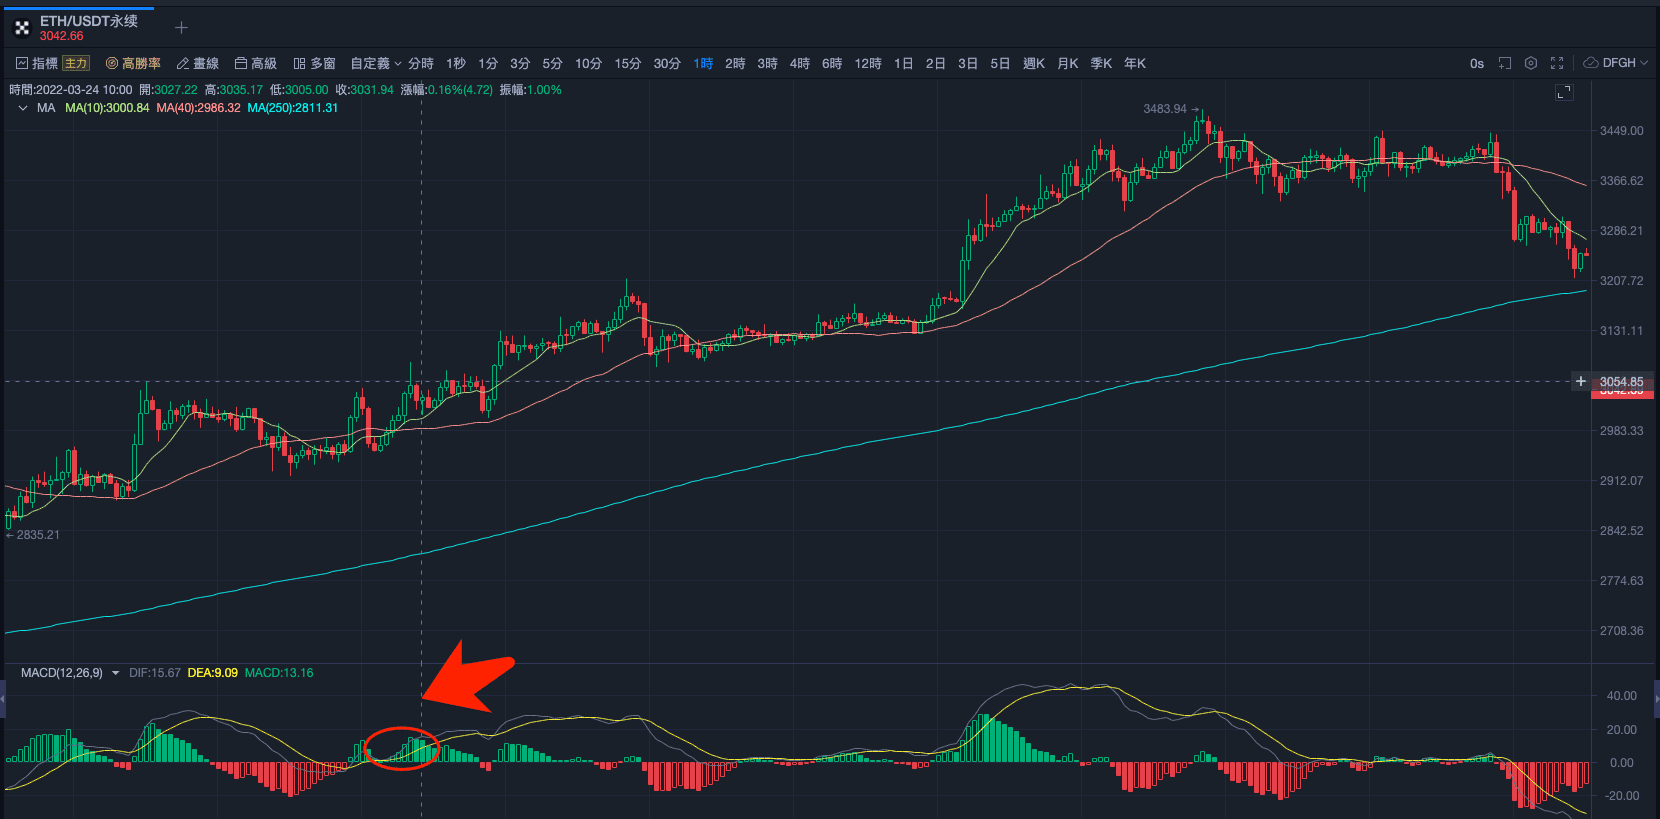
In contrast, a dead fork below the zero axis indicates a clear signal for a headless trend.
What do you mean?
Signal two: MACD's red-green column is not high, then DIF and DEA circle around the zero axis, indicating that the main force is being sucked up.
What do you mean?
Example: 10 minute k-string chart, DIF and DEA wrap around the zero axis, and after the suction is completed, the price is pulled up.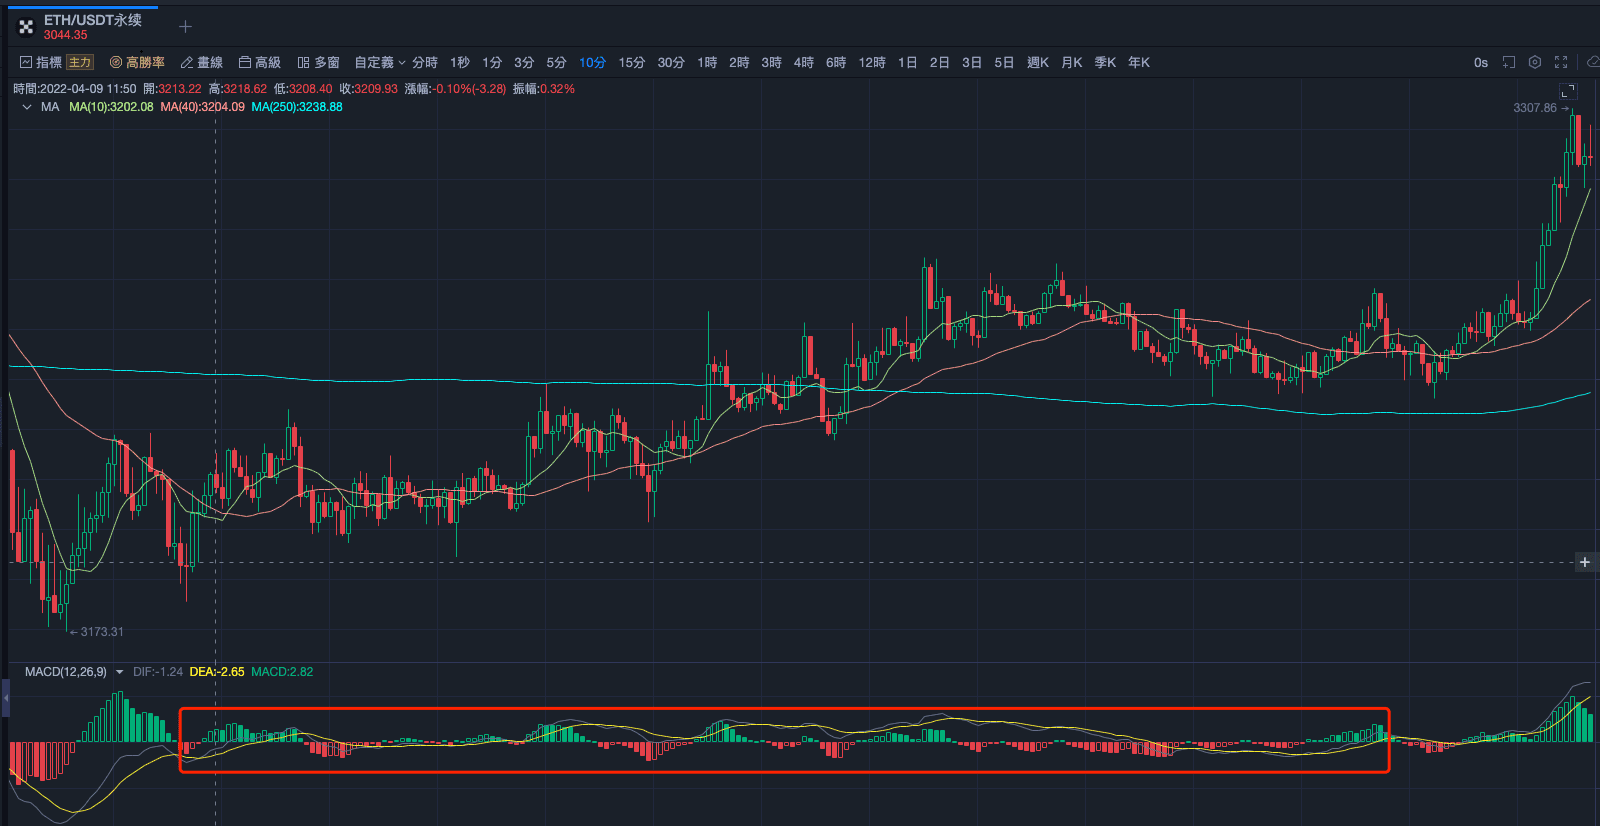
Signal 3: The MACD's DIF and DEA form an air refueling state, indicating that prices continue to move along the current trend strength.
What do you mean?
Example: The latest k-hour chart, in which the MACD's DIF and DEA converge after the spread, the volume of transactions is magnified, indicating that the trend is still continuing, is a good medium-term sell signal.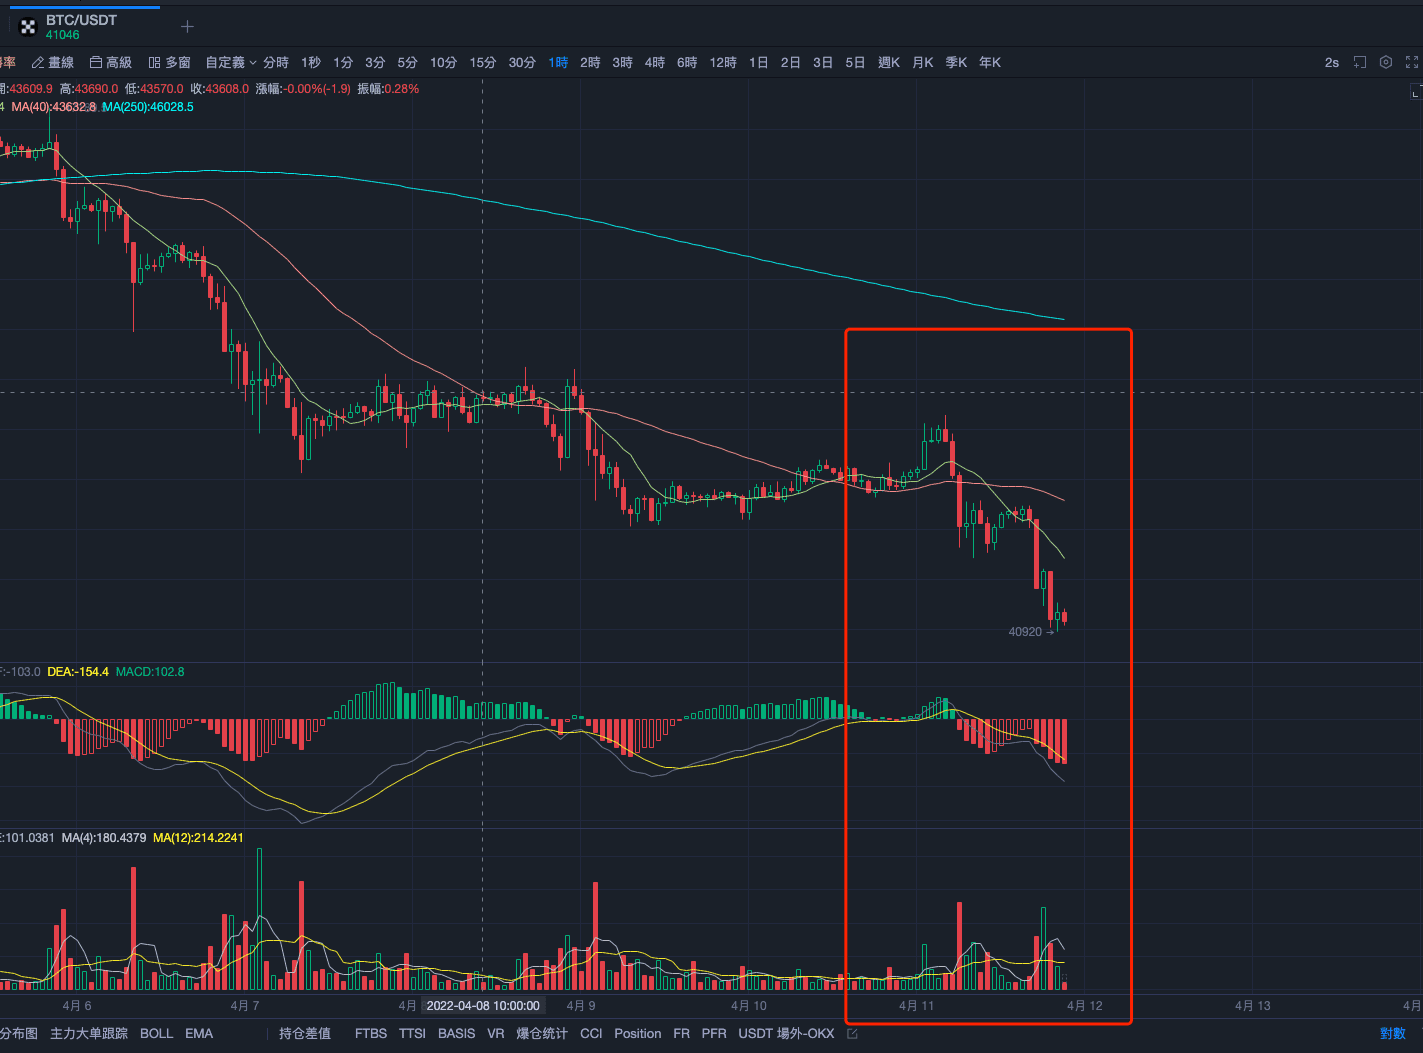
The air refueling state is more classic, the convergence finds support and then continues to disperse, in fact it is a process of back-stepping confirmation.
What do you mean?
3) Identify deviations and look for opportunities to reverse by comparing the highs and lows of the column chart with the highs and lows of the price.
What do you mean?
Key point: When the k-line is higher than the peak, the MACD is higher than the peak, and the MACD is lower than the peak, and the MACD is lower than the bottom.
What do you mean?
Conclusion: The bottom is off, look up; the top is off, look down.
What do you mean?
For example, a 4-hour k-line chart, where the price moves up, the MACD moves down, and the price drops after the top.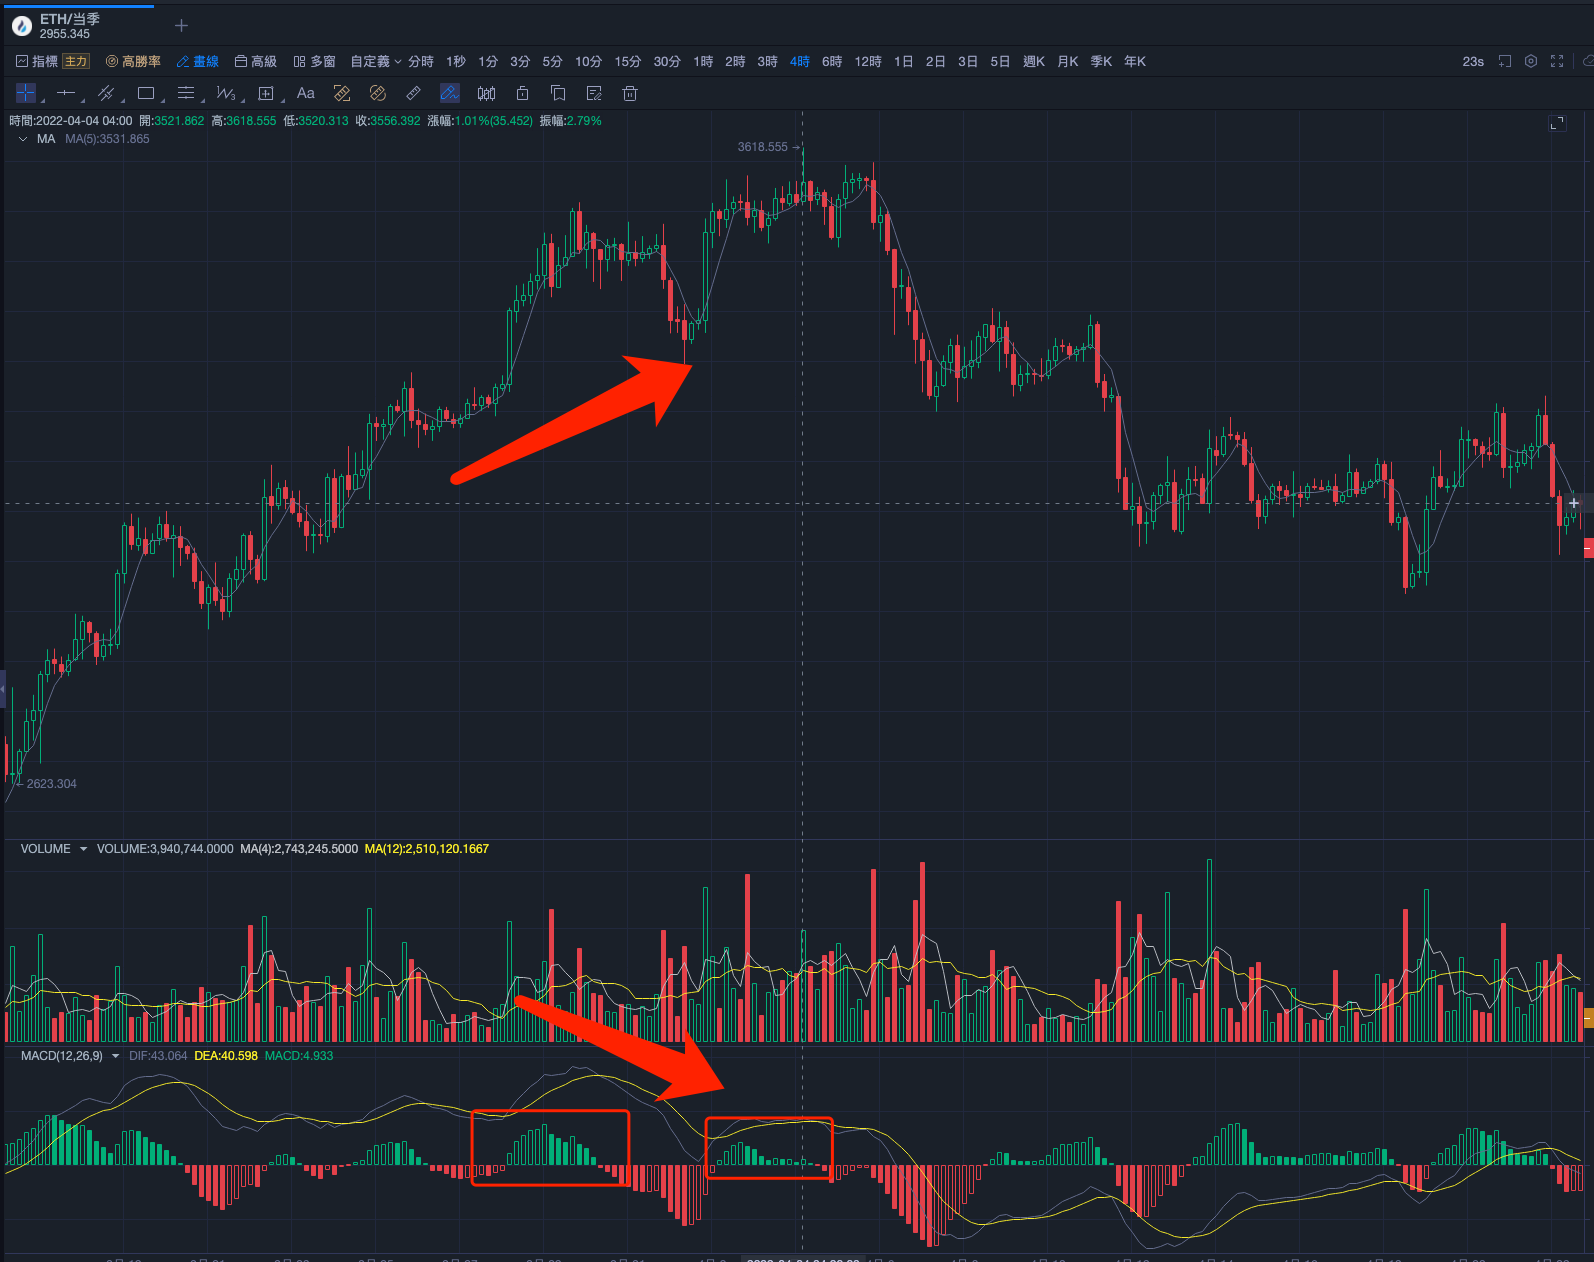
If the MACD is trending at the next major level of the current k-line cycle level, then this reversal of the deviation can only be seen as a small rebound in the current cycle, and there is still a greater chance of following the original trend, i.e. whether the bottom deviation can be successfully reversed, it needs to be seen whether the trend has crossed the major level.
What do you mean?
Three, MACD gold forks warning
What do you mean?
The following commonly used periods, such as the 5-minute, 30-minute, etc., are useful for short-term trading.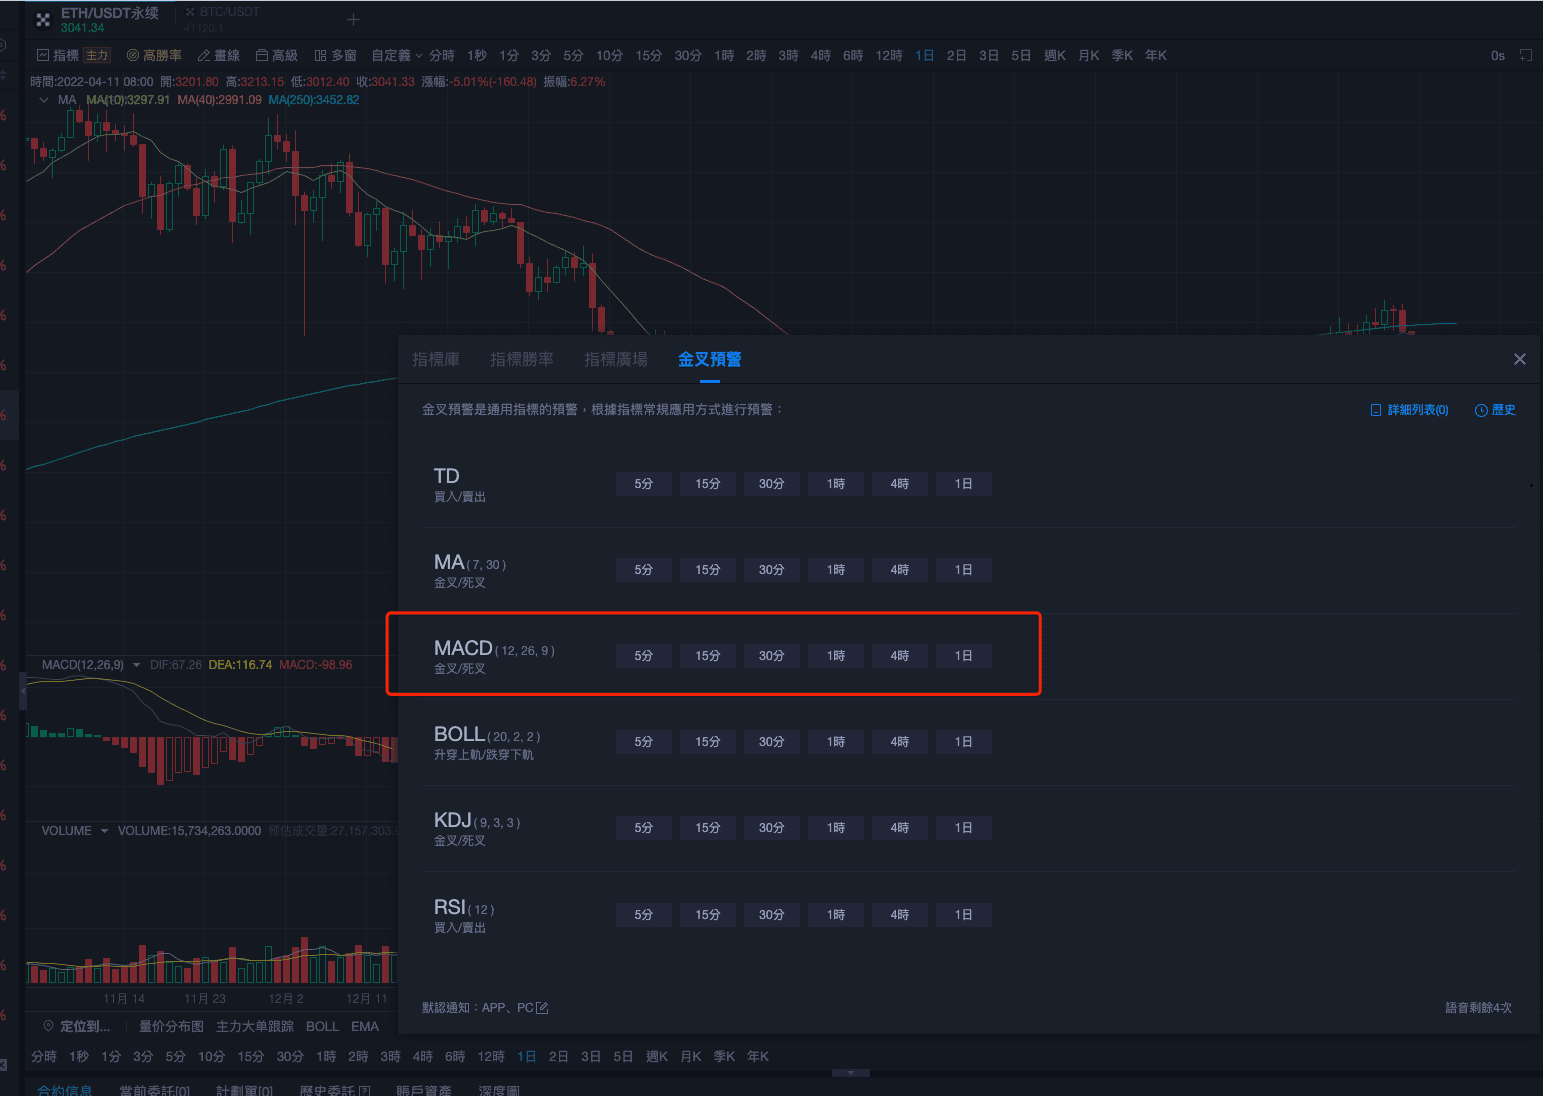
The MACD has always been known as the king of indicators among investors, with too many techniques to use, I hope this article will inspire you to build your own trading system based on the MACD indicator.
- A word addict who ignored my warning signs for 13 days has gone on the run.
- About the use of getorders
- Strategy: Red and black troops K-line shape (Naked K) Strategy review details
- calculation of ema slope
- High frequency trading problems
- New findings: Chain data + in-field transaction data = main entry and exit points
- Ask for help with procedural framework and multi-strategy combination
- Is pine script able to directly switch market data?
- The web page is full of questions.
- Do you think that the retracement graph can only show a few thousand data points?
- How to order through FMZ
- The new version of the TV reset icon is not convenient.
- MyLanguage Doc
- The most advanced way to trade: master the order wall!
- What is the unit of volume?
- Which of the following is the most recent year-over-year increase in the overhead and reverse overhead rates?
- Problems with tradingview: Always delay 1 to 2 seconds between signal to FMZ
- How to operate multiple accounts on one disk
- WeChat can't receive a policy alert?
- Quantity price distribution chart: Watch the distribution of the chips to get an insight into average costs
Black and white.666, I see you share a lot of posts.