Newcomer's Question. GetRecords obtained K-line data and the chart of the retest and the actual data are inconsistent.
Author: jeffreyhsu, Created: 2017-07-09 18:15:00, Updated: 2017-07-09 18:17:43使用talib.GetRecords获取历史k线数据,发现回测时获得的结果和绘制的图表以及同期的真实K线指标三者都不一样
records = exchange.GetRecords(PERIOD_H1)
Log('records:', records[-1])
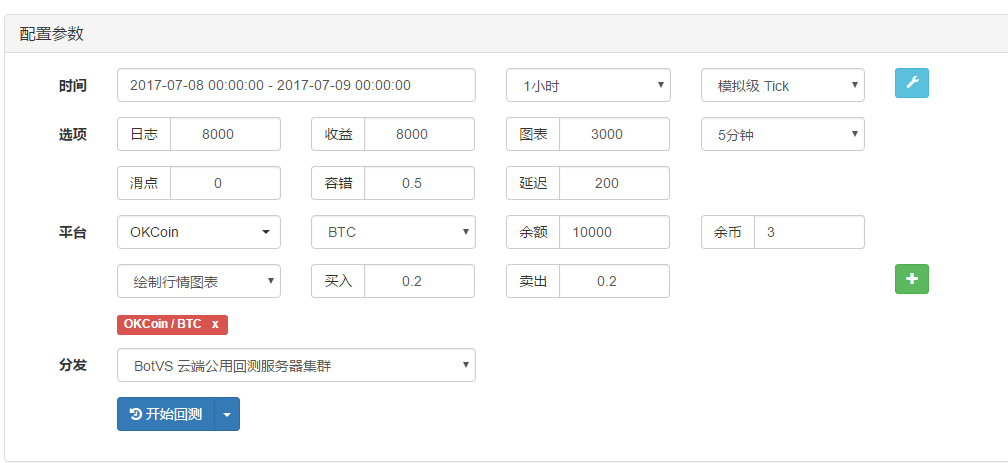
The settings of the retest, the option is Okcoin cash
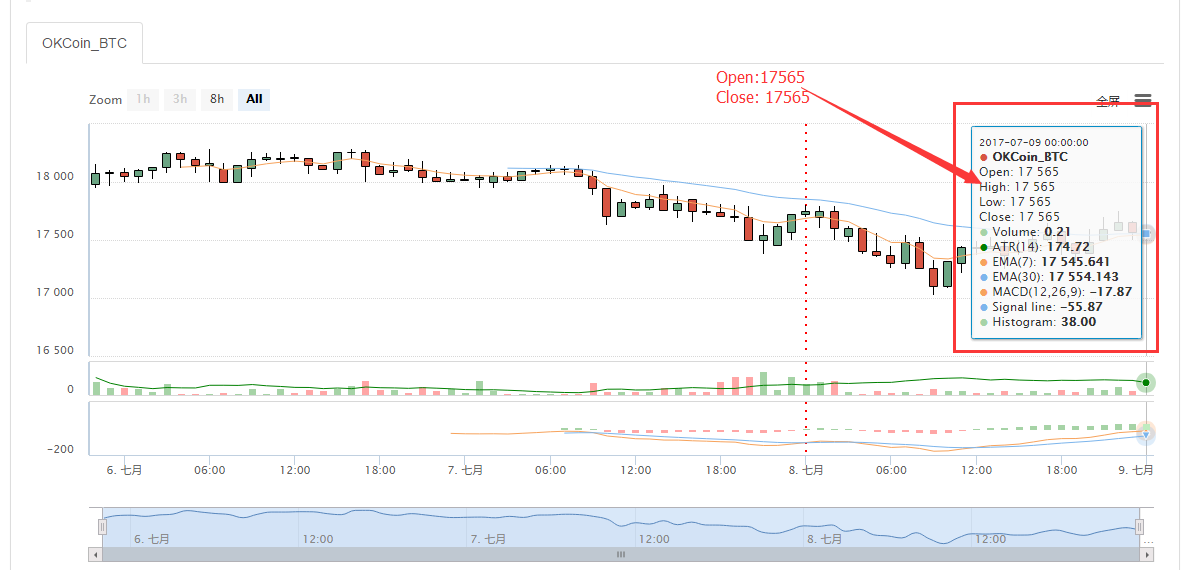
Graphs drawn during the review:
The logs printed the last entry, dated July 9 at 0:00.
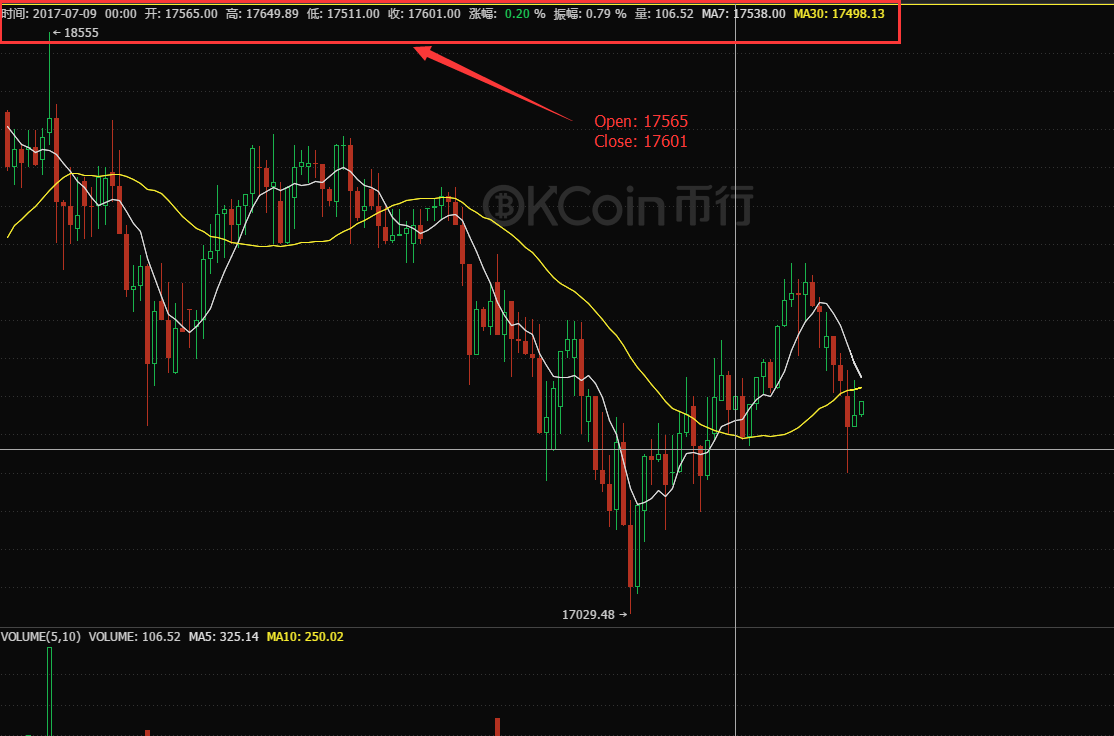
The real history of Okcoin:
And if you look at the graph, all three of them have very different data, and the volume of transactions is very different, and log is 0.0827272727272727273 and how is this possible?
Please tell me what the reason is, thank you.
More
- The multi-headed trend is backtracking strategy
- The root cause of the decentralization of the market to the extreme is found!
- A sustainable and efficient trading model
- Indices: Please ask about the market for OKEX contracts, is there an index?
- Multi-platform hedge stability of the leverage V2.1 (note)
- Bitcoin is open for ETC trading, inventors quantify, when will ETC support?
- Don't miss out on the advances and breakthroughs in technology!
- Can deep learning be used to quantify transactions?
- The depth of the OKEX futures Why only get 5?
- Pandora's Box: How financial traders eat risk-free fat
- Hot summer, tokens and inventors quantify join hands, 5 discount invites you to start quantified trading
- TableTemplate from Python
- Maximizing trading: Theoretical boundaries and trading systems
- How to customize the set of currencies not shown on the exchange label when creating a digital currency trading robot
- The LogStatus function shown in the Python interface
- The LogStatus function shown in the Python interface
- Exchange fee summary
- Project templates that write their own TypeScript policies, need to be customizable
- Inventors Quantify: Is the editor theme available for download?
- Settings for remittance fees
Inventors quantify - small dreamsrecords[-1] is the last column of the K-line data. The data changes over time, so the result is an unfinished bar. talib.GetRecords determines whether this can be accessed to K-line data >_