Smiley curve for delta hedging of bitcoin options
Author: FMZ~Lydia, Created: 2023-08-16 14:53:25, Updated: 2023-09-18 20:17:37The rate of increase is much smaller, between only 3.1% and 7.6%.
For all other options, however, all adjusted Smiley Curve deltas performed less well than BS delta. This is not surprising, however, as Bitcoin prices have been on a steady trend for most of 2020. The actual HW hedge ratio proposed by Hull and White (in 2017) and Lee's minimum spread (in 2001) MV hedge have also not improved on BS delta. A major drawback of MV delta is that it uses regression to estimate its parameters, which makes the independent homogeneous distribution hypothesis not applicable for assets where such a special benefit is very easy to occur.
Figures 2 and 5 show that 2021 is characterized by higher prices, greater volatility, and an increase in the overall volatility level, along with the appearance of a flatter but still asymmetrical smile-shaped implied volatility curve. Throughout 2021, the price of Bitcoin fluctuated enormously between $30,000 and nearly $70,000, as shown in Figure 2. The 30-day smile curve became relatively flat towards the end of this period. However, the flat smile curve made the key component of the adjusted delta, the slope of the smile curve, almost redundant. Therefore, in our second year, all smile curves adjusted delta shows no significant improvement over the previous year, as the standard BSBS counterefficients for all 20- and 30-day periods were used.
Table 3 and Table 4 then examine the robustness of the results in Table 2 in two ways: first by re-analyzing them at a daily frequency (Table 3) and then using perpetual contracts rather than the same futures as a hedging tool. The results in Table 3 show a pattern similar to the results in Table 2, only less significantly sloppy overall, but this is not surprising, as there are now only 365 observations per year instead of 1095 observations. They confirm our conclusion from Table 2 that no adjusted smile curve delta can improve the deltaBS in 2021. In 2020, we also see the same pattern of performance relative to the deltaBS, that the deltaBS does indeed perform optimally on the ATM option, but there is some statistical evidence that the option and the option on the ATM option fell 0.9 percent on the ATTMO option, but there is no statistical significance for these differences.
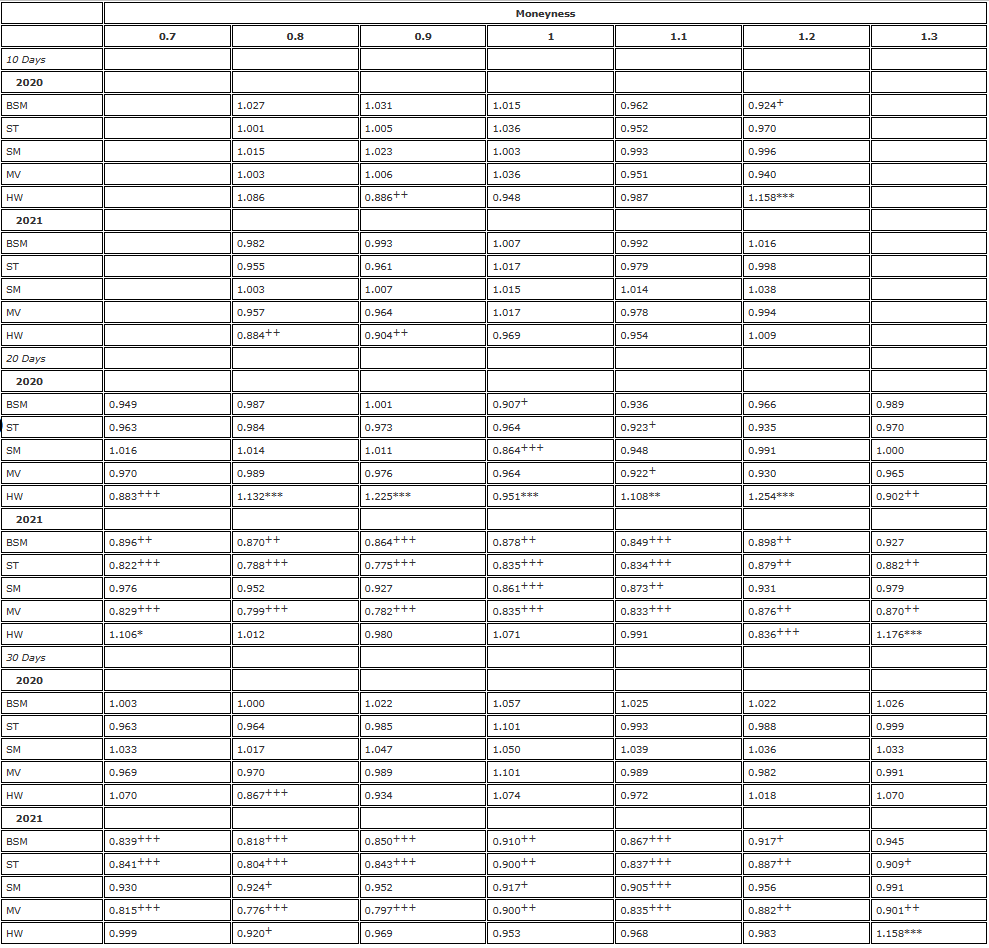
Table 3. F-tested hedge results (daily rebalancing, fixed to futures)
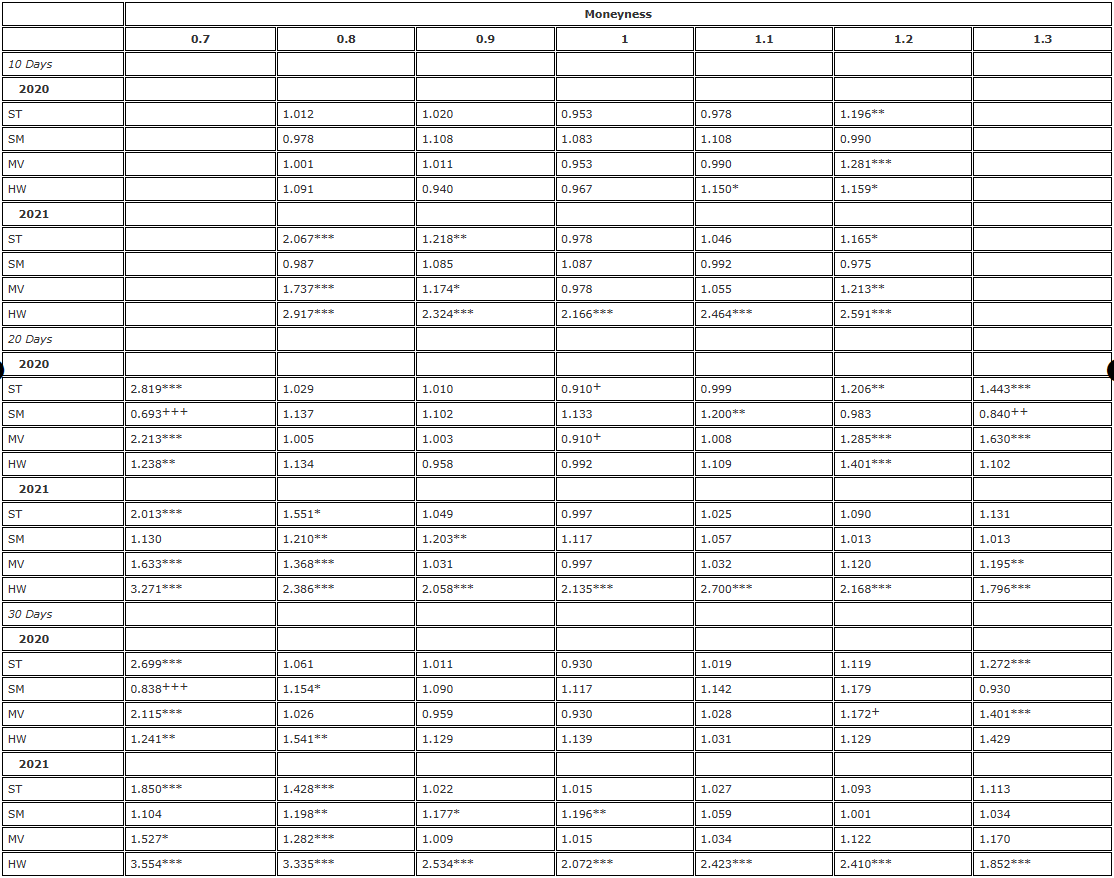
Note: The side-difference ratio and the significance level of the unilateral F-test are for the null hypothesis, respectively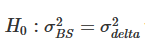 The alternative hypothesis
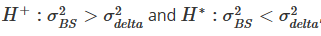 The hedge is based on a futures contract with the same expiration date as the option, and rebalanced every 8 hours. We compare the difference in delta hedge error with the difference in delta hedge using BS and divide the two-year sample into two parts. We use three different options with different maturities, ranging from 0.7 to 1.3 in monetary value, using OTM bear options when monetary <1 and OTM see-saw options when monetary >1.
Table 4. F-tested hedge results ((8 hours rebalancing, permanent contract) ).
Note: The side-difference ratio and the significance level of the unilateral F-test are for the null hypothesis, respectivelyThe alternative hypothesisThe hedge is based on a futures contract with the same expiration date as the option, and rebalanced every 8 hours. We compare the difference in delta hedge error with the difference in delta hedge using BS and divide the two-year sample into two parts. We use three different options with different maturities, ranging from 0.7 to 1.3 in monetary value, using OTM bear options when monetary <1 and OTM see-saw options when monetary >1.
Table 4 is exactly the same as Table 2, using an 8-hour rebalancing frequency for the analysis, but using perpetual contracts as a hedging tool for all options. We see a poor performance pattern for BS delta, which is exactly the same as Table 2, with very significant efficiency gains for the use of SM delta and ST/MV delta hedging OTM bear options. In addition to the SM delta hedging again yielding significant efficiency gains for the hedging of 10-day OTM bear options, the SM delta with no adjustments in 2021 significantly outperformed the BS delta. For STATM options, there is also a small <5% efficiency gain for the use of SM/MV delta, and the spread ratio is almost always in the ratio between the 2nd and 4th sides.
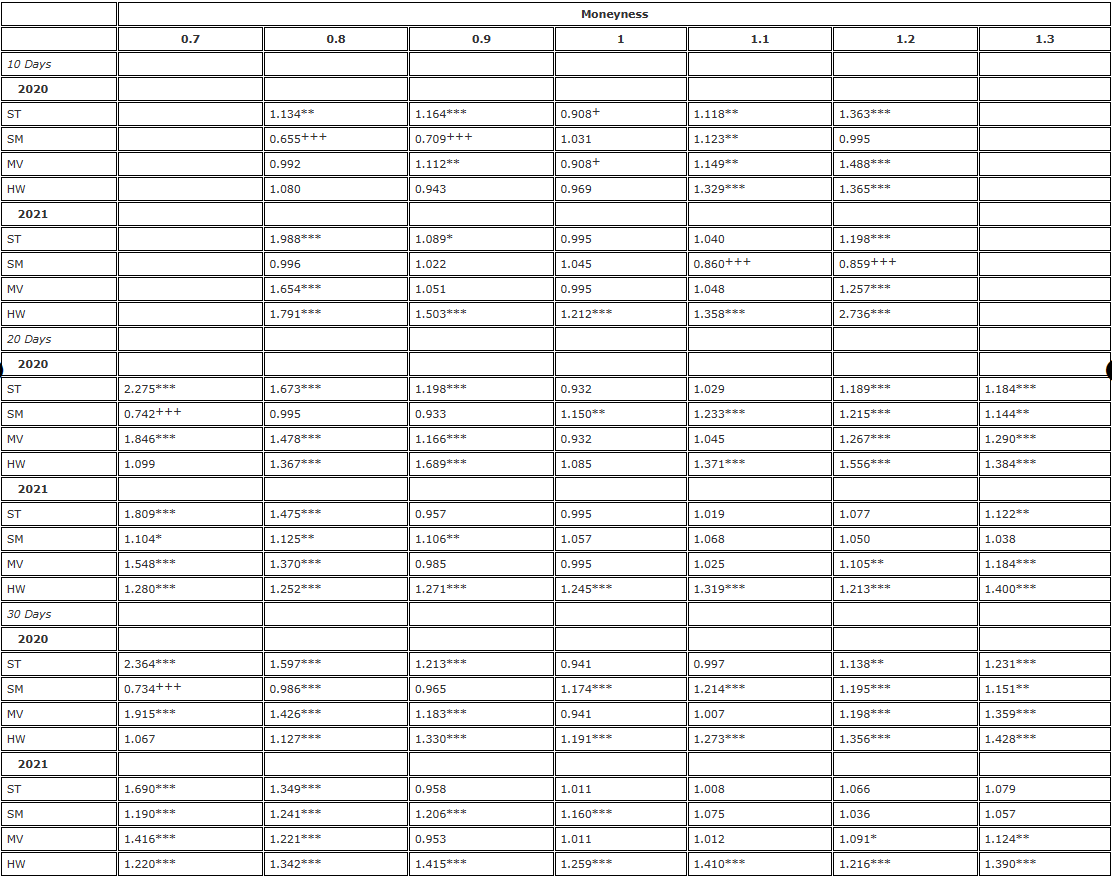
To answer this question, we looked at the differential ratio, where the molecule is the differential of the hedge error of the perpetual-term futures, and the denominator is the differential of the hedge error of the perpetual-term futures. We again divided the sample into two one-year periods and listed the results by delta (now including BS delta) and option, and Table 5 shows the results. In the table, the differential ratio is less than about 1 indicating that a better hedge effect can be obtained using perpetual contracts.
Table 5. F-test of futures against perpetuity (re-balancing every 8 hours)
Note: The side-difference ratio and the significance level of the unilateral F-test are for the null hypothesis, respectivelyThe alternative hypothesisThe hedge is based on a futures contract with the same expiration date as the option, and rebalanced every 8 hours. We compare the difference in delta hedge error with the difference in delta hedge using BS and divide the two-year sample into two parts. We use three different options with different maturities, ranging from 0.7 to 1.3 in monetary value, using OTM bear options when monetary <1 and OTM see-saw options when monetary >1.
Although the result table provides an overall relative efficiency of delta on different Smiley curve adjustments, our two-year sample covers a wide range of market systems. As shown in Figure 5, the Bitcoin market fluctuates rapidly between steady trends, range shocks, and crashes. Therefore, to help understand which delta performs best under which market conditions, Figure 8 describes the time sequence of the ratio, i.e. the difference of the delta counterfactual error of the Smiley curve adjusted to the side opposite the delta BS counterfactual error. This is a re-balancing of the counterfactual error every 8 hours, and now each side is only observed using the most recent 90 values.
Figure 8. Hedging performance of the rolling sample. (a) 10-day option outcome and (b) 30-day option outcome.
The differential ratio shows the performance of various perpetual option hedge ratios relative to the BS delta, rebalanced every 8 hours, where the differential of the hedge error is calculated using the first 90 observation values. We list the logarithmic results of (a) the 10-day period and (b) the 30-day period of the options in the two-year sample. The real line 0 is the reference value, a ratio greater than 0 indicates a worse performance relative to the BS, and a ratio less than 0 indicates a better performance relative to the BS. Figure (a) above describes the performance of the OTM down option at m=0.8, while (b) top chart shows the performance of the OTM down option at m=0.7, and the median chart shows the performance of the ATM option at (a) and (b) below, and Figure (a) below indicates the performance of the currency at 1.2 and (b) below indicates the performance of the OTM down option at 0.3.
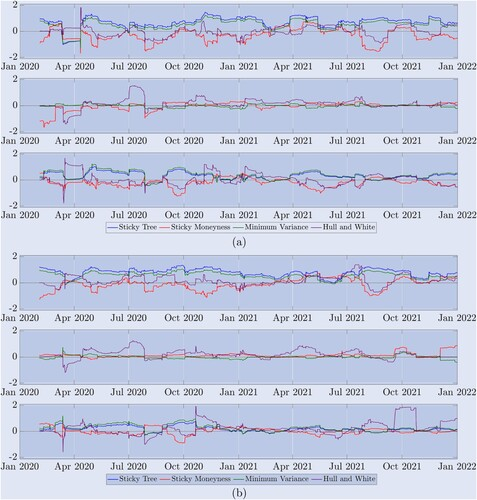
The three graphs above (a) show the results of the 10-day options, and the three graphs below (b) show the results of the 30-day options. In each case (a) and (b) the graphs above are OTM bear options, which confirm the results of the following two graphs: ST (blue) and MV (green) deltas performed poorly for almost the entire period, both below BS; according to Derman's 1999 market classification expectations, SM delta did not perform better than delta during periods with market intervals restricted, but only when the market was trending, such as the first bull market that began in January 2021 and the second bull market later in the same year, whereas delta did not perform as well as SMBS delta; the performance of the delta was usually different from any other period of the year. Each group showed a different degree of parity of representation of the right-hand side versus the right-hand side.
7. Conclusions
Previous academic empirical studies have only looked at the implicit and system-dependent delta hedges of the non-model Smiley Curve on stock options. Although the results vary, the general conclusion is that the hedge ratio of the Smiley Curve only improves the Black-Scholes delta performance of nil-value bear options in some cases. However, we have shown that Bitcoin's implicit volatility Smiley Curve performs very differently from stock options, so the effectiveness of the Smiley Curve Adjusted Hedge Ratio, which is often favored by research practitioners, makes a lot of sense.
We encourage the use of various potential uses of the adjusted delta, most of which depend only on the real-world relationships of the hedging options and the slope of the implied volatility curve of the expiration time. By using the unique data set of Deribit options, we were able to compare the hedging effects of the most active Bitcoin options on the Deribit exchange, with the spot price fluctuating below 30% on the current BTC index, and the option with the longest expiration time of one month. We analyzed the variance of the delta hedge error, where the hedging instrument can be either a futures contract with the same expiration time as the hedge option, or a perpetual hedge, which is an innovative formula unique in the cryptocurrency derivatives market.
By this method, we demonstrate that for a zero option, the hedging effect of the smile curve implied (sticky monetary) delta is significantly better than that of the standard Black-Scholes delta, with efficiency gains of more than 40% in some cases. The smallest-difference delta is also superior to the BS delta, but only in price options because it is consistent with the sticky tree delta. No other delta adjusted after the smile curve can continuously improve the BS delta, even for most of 2021, and the hedging performance of the smile curve implied and the smallest-difference delta is also very good.
Our research focuses mainly on robust modelless frameworks, which are also the preferred choice of many practitioners. We did not consider using any parametric random and/or local volatility models to hedge, for the simple reason that the scale invariance of these processes means that delta is actually modelless, and therefore implies delta overlap with the smiles used in this study. Since we introduced Lee's robust minimum side-difference delta in our study in 2001, we believe that adding different randomized volatility processes for dynamic delta hedging is a research problem that is not very relevant to the current crypto industry.
This article focuses on the frequent rebalancing of dynamic delta hedges, which may help market makers of bitcoin options gain a competitive edge in a market that is only really beginning to mature in 2021. However, the bitcoin market is developing so rapidly that large professional traders such as Jump Trading, Jane Street, XBTO and Cumberland DRW are trading bitcoin options, with daily trading volumes typically reaching more than $1 billion. Many new expiration options and option contracts of the same size are also being rolled out to meet the demand, for example, CME recently launched a retail-oriented bitcoin futures market. However, the bid-ask spread of bitcoin options is still relatively large, far lower than that of special-purpose options or futures market. Therefore, the ability of the bitcoin market to maintain its profitability depends more on the accurate dynamics of the trading volume.
The Declaration
We would like to thank the anonymous reviewers for their comments, which have made a big improvement in the paper.
Disclosure Statement
The author states that there is no conflict of interest.
Additional notes
-
In contrast, the delta derived from non-scale invariant models (such as Dupire's Local Volatility Model (1994) or Derman and Kani's Sticky Tree Model (1994)) is theoretically not equivalent to a non-scale invariant delta.
-
For example, the most recentArticles by CAIAAnother post on MediumArticles, andrisklatteandstackexchangeIn addition to the above, there are also several quantitative financial forums.
-
In this section of the literature, Nastasi et al. (2020) calibrate the smile consistency model for commodity options to capture smile dynamics, while Malz (2000) explains how smile adjustments are taken into account when measuring FX risk.
-
Deribit options have a bi-day, bi-weekly, bi-monthly and quarterly maturity of up to 9 or 12 months. Its symbol is the Deribit BTC Index, which is the parity average of the latest Bitcoin price on 11 exchanges, excluding the highest and lowest prices, and the remaining 9 prices used to calculate the index. Currently, these exchanges include Coin, Bitfinex, Bitstamp, Bittrex, Coinbase Pro, Gemini, Huobi Global, Itbit, Kraken, LMAX Digital, and OKEx, which update the index every second.Options specifications for DeribitThe indicator is clearly the Deribit BTC Index. For shorter term options, the range of execution ranges from 50% to 150% of the current price of BTC, and for options with a term of more than 6 months, the range of execution is up to 800% of the current price of BTC.
-
See alsoCBOE historical options dataThe CBOE has a number of options on the SPX.
-
See alsoBitcoin option trading volumeandGoldman's Bitcoin options。
-
It is followed by CME (5%), followed by OKEx (2.5%), followed by China.以及FTX和Bit.comFor more details, please seeThe Block Options。
-
In order to calculate the final return, Deribit uses the average of the BTC index 30 minutes before the expiration as the settlement value.Options specifications for DeribitIt should be noted that the Deribit Bitcoin options market is not complete. The index itself is not tradable and requires expensive replication and frequent rebalancing. The market is not complete for traders due to the lack of information on the precise calculation of settlement value. However, a detailed discussion of this issue is beyond the scope of this article, and we recommend referring to Alexander et al. (2022a) for an in-depth discussion.
-
See also 2022Central cryptocurrency market last yearThe ranking.
-
Reverse futures are futures contracts priced in bitcoin based on the dollar price of bitcoin or the value of the bitcoin index. Standard futures and reverse futures both use the dollar value as a benchmark, but their difference is in the way they are settled: the nominal amount of the CME's standard futures is 0.1 or 5 bitcoins and paid in dollars, while the nominal amount of the reverse futures is $1 or $10 and paid in bitcoins. On the other hand, this payment mechanism results in a different profit loss (PnL) calculation.
-
See alsoDeribit fixed income rateIn this article, you will find a description of Deribit's rate calculation.
-
See alsoThe BlockorCoinglassIt is important to note that more than eight exchanges showed unusually high trading volumes. However, we overlooked many exchanges that artificially increased trading volumes due to the flushing of transactions.
-
Coleman et al. (2001) and many others advocate this approximation.
-
Derman (1999) called the SS model a replication of the BS model with implicit fluctuation trees.
-
With the exception of the very deep nil-value bearish options ((m=0.7) and bearish options ((m=1.3), these options are under-traded in the short-expiration date category. We were only able to calculate the composite price for 75% of the time, and therefore excluded these options from our final results.
-
Of course, the PCP values of each power level will be different. Since trading is usually centered on ATM options, it is difficult to find an ITM/OTM power level that is both bullish and bearish active, so we use the PCP values obtained from the ATM option feedback. We insert two adjacent expiration date ATM PCP values and use these values when needed to obtain a synthetic fixed-period power price.
-
For example, because we always hold a perpetual contract in the build, the hedger needs to pay a capital charge when the margin of the perpetual contract is right, and when the margin is negative, the hedger receives a capital charge. The opposite is the case for hedging multi-headed options positions. However, from Figure 7 we can see that the margin of the perpetual contract is variable, sometimes positive, sometimes negative. Writing a hedge algorithm to fully exit a hedge position before the maturity of the capital charge is not difficult, but not if the hedge position will receive a capital charge.
-
For an ATM option, the ST and MV delta are the same, so the result is the same, but only in this case.
References
-
Alexander, C., Pricing, Hedging and Trading Financial Instruments. Market Risk Analysis III, 2008 (Wiley). [Google Scholar]
-
Alexander, C. and Nogueira, L., Model-free hedge ratios and scale invariant models. J. Bank. Finance, 2007a, 31, 1839–1861. [Crossref], [Web of Science ®], [Google Scholar]
-
Alexander, C. and Nogueira, L., Model-free price hedge ratios for homogeneous claims on tradable assets. Quant. Finance, 2007b, 7(5), 473–479. [Taylor & Francis Online], [Web of Science ®], [Google Scholar]
-
Alexander, C., Rubinov, A., Kalepky, M. and Leontsinis, S., Regime-dependent smile-adjusted delta hedging. J. Futures Mark., 2012, 32(3), 203–229. [Crossref], [Web of Science ®], [Google Scholar]
-
Alexander, C., Chen, D. and Imeraj, A., Inverse and quanto inverse options in a Black–Scholes world. SSRN Working Paper, 2022a. [Crossref], [Google Scholar]
-
Alexander, C., Deng, J., Feng, J. and Wan, H., Net buying pressure and the information in bitcoin option trades. J. Financ. Mark., 2022b. (Article in Press). [Crossref], [Google Scholar]
-
Attie, L., The performance of smile-implied delta hedging. Canadian Derivatives Institute, Technical Note TN 17-01, 2017. [Google Scholar]
-
Bakshi, G., Cao, C. and Chen, Z., Empirical performance of alternative option pricing models. J. Finance, 1997, 52, 2003–2049. [Crossref], [Web of Science ®], [Google Scholar]
-
Bates, D., Hedging the smirk. Finance Res. Lett., 2005, 2(4), 195–200. [Crossref], [Google Scholar]
-
Black, F. and Scholes, M., The pricing of options and corporate liabilities. J. Polit. Econ., 1973, 81(3), 637–654. [Crossref], [Web of Science ®], [Google Scholar]
-
Bliss, R. and Panigirtzoglou, N., Testing the stability of implied probability density functions. J. Bank. Finance, 2002, 26(2-3), 381–422. [Crossref], [Web of Science ®], [Google Scholar]
-
Chen, K. and Huang, Y., Detecting jump risk and jump-diffusion model for bitcoin options pricing and hedging. Math., 2021, 9(20), 2567. [Crossref], [Google Scholar]
-
Chi, Y. and Hao, W., Volatility models for cryptocurrencies and applications in the options market. J. Int. Financ. Mark I., 2021, 75, 101421. [Crossref], [Google Scholar]
-
Coleman, T., Kim, Y., Li, Y. and Verma, A., Dynamic hedging with deterministic local volatility function model. J. Risk, 2001, 4(1), 63–89. [Taylor & Francis Online], [Google Scholar]
-
CryptoCompare, Exchange review. September 2022, 2022. [Google Scholar]
-
Crépey, S., Delta-hedging vega risk?. Quant. Finance, 2004, 4(5), 559–579. [Taylor & Francis Online], [Web of Science ®], [Google Scholar]
-
Derman, E., Regimes of volatility. Risk, 1999, 12(4), 55–59. [Google Scholar]
-
Derman, E. and Kani, I., The volatility smile and its implied tree. Quantitative Strategies Research Notes, 1994. [Google Scholar]
-
Derman, E., Kani, I. and Zou, J., The local volatility surface: Unlocking the information in index option prices. Financ. Anal. J., 1996, 52, 25–36. [Taylor & Francis Online], [Google Scholar]
-
Duffie, D., Pan, J. and Singleton, K., Transform analysis and asset pricing for affine jump diffusions. Econometrica, 2000, 68(6), 1343–1376. [Crossref], [Web of Science ®], [Google Scholar]
-
Dupire, B, Pricing with a smile. Risk Mag., 1994, 7(1), 18–20. [Google Scholar]
-
Fengler, M., Arbitrage-free smoothing of the implied volatility surface. Quant. Finance, 2009, 9(4), 417–428. [Taylor & Francis Online], [Web of Science ®], [Google Scholar]
-
François, P. and Stentoft, L., Smile-implied hedging with volatility risk. J. Futures Mark., 2021, 41(8), 1220–1240. [Crossref], [Google Scholar]
-
Hou, A., Wang, W., Chen, C. and Härdle, W., Pricing cryptocurrency options. J. Financ. Econom., 2020, 18(2), 250–279. [Web of Science ®], [Google Scholar]
-
Hull, J. and White, A., Optimal delta hedging for options. J. Bank. Finance, 2017, 17, 180–190. [Crossref], [Google Scholar]
-
Jalan, A., Matkovskyy, R. and Aziz, S., The bitcoin options market: A first look at pricing and risk. Appl. Econ., 2021, 53(17), 2026–2041. [Taylor & Francis Online], [Google Scholar]
-
Lee, R., Implied and local volatilities under stochastic volatility. Int. J. Theor. Appl. Finance, 2001, 4(1), 45–89. [Crossref], [Google Scholar]
-
Malz, A., Estimating the probability distribution of the future exchange rate from option prices. J. Deriv., 1997, 5(2), 18–36. [Crossref], [Google Scholar]
-
Malz, A., Vega risk and the smile. RiskMetrics Working Paper No. 99–06, 2000. [Crossref], [Google Scholar]
-
Matic, J., Packham, N. and Härdle, W., Hedging cryptocurrency options. SSRN Working Paper, 2021. [Crossref], [Google Scholar]
-
McNeil, A. and Frey, R., Estimation of tail-related risk measures for heteroscedastic financial time series: An extreme value Approach. J. Empir. Finance, 2000, 7(3), 271–300. [Crossref], [Google Scholar]
-
Nastasi, E., Pallavicini, A. and Sartorelli, G., Smile modeling in commodity markets. Int. J. Theor. Appl. Finance, 2020, 23(3), 2050019. [Crossref], [Google Scholar]
-
Sauer, B., Virtual currencies, the money market, and monetary policy. Int. Adv. Econ. Res., 2016, 22, 117–130. [Crossref], [Google Scholar]
-
Siu, T.K. and Elliott, R., Bitcoin option pricing with a SETRA-GARCH model. Eur. J. Finance, 2021, 27(6), 564–595. [Taylor & Francis Online], [Web of Science ®], [Google Scholar]
-
Vähämaa, S., Delta hedging with the smile. Financ. Mark. Portfolio Manage., 2004, 18(3), 241–255. [Crossref], [Google Scholar]
The original is from:https://www.tandfonline.com/doi/full/10.1080/14697688.2023.2181205
- Introduction to the Lead-Lag suite in digital currency (3)
- Introduction to Lead-Lag Arbitrage in Cryptocurrency (2)
- Introduction to the Lead-Lag suite in the digital currency (2)
- Discussion on External Signal Reception of FMZ Platform: A Complete Solution for Receiving Signals with Built-in Http Service in Strategy
- Discussing FMZ platform external signal reception: a complete set of strategies for the reception of signals from built-in HTTP services
- Introduction to Lead-Lag Arbitrage in Cryptocurrency (1)
- Introduction to the Lead-Lag suite in digital currency (1)
- Discussion on External Signal Reception of FMZ Platform: Extended API VS Strategy Built-in HTTP Service
- External signal reception on FMZ platforms: extended API vs. built-in HTTP services
- Discussion on Strategy Testing Method Based on Random Ticker Generator
- Strategy testing methods based on random market generators explored
- Alternative Trading Ideas--K-line Area Trading Strategy
- Construction and application of market noise
- PSY (psychological line) factor upgrading and transformation
- High frequency trading strategy analysis - Penny Jump
- How to Measure Position Risk - An Introduction to the VaR Method
- Alternative trading ideas - K-line area trading strategies
- How to measure the risk of holding VaR
- FMZ Mobile APP Trading Terminal, empowering your quantitative trading experience
- FMZ mobile app trading terminal that empowers you to quantify your trading experience
- Analysis and instructions for use about built-in function _Cross
- Thoughts on High-Frequency Trading Strategies (5)
- Thoughts on High-Frequency Trading Strategies (4)
- Thinking about high-frequency trading strategies (5)
- Thinking about high-frequency trading strategies (4)
- Thoughts on High-Frequency Trading Strategies (3)
- Thinking about high-frequency trading strategies (3)
- Thoughts on High-Frequency Trading Strategies (2)
- Thinking about high-frequency trading strategies (2)
- Thoughts on High-Frequency Trading Strategies (1)
- Thinking about high-frequency trading strategies (1)