Alternative trading ideas - K-line area trading strategies
Author: Inventors quantify - small dreams, Created: 2023-11-03 17:12:42, Updated: 2024-11-08 09:08:54
Looking at an unreliable trading idea for a K-line area trading strategy, we explore this idea together and try to implement this script.
The main ideas of the K-line area strategy
The K-line area strategy is a trading strategy based on the area relationship between the price K-line and the median line. Its main idea is to predict the possible movement of the stock market price by analyzing the magnitude and changes in price trends, as well as the conversion of buying and selling sentiment, and thus determine the opening and exit times. The strategy relies on the area between the K-line and the median line, as well as the numerical value of the KDJ indicator, to generate multi-head and blank-head trading signals.
Principles of the K-line area strategy
The area of the K-line is the area of space between the price K-line and the equator, calculated by subtracting the average closing price of each Bar and then summing it. The area of the K-line increases when the price uptrend is large, over a long period of time, while the area of the K-line is smaller when the market is turbulent or reversed after the turbulence. According to the principle of the inevitable feedback loop, the larger the uptrend, the longer the time, the larger the area of the corresponding K-line, the greater the likelihood of reversal, like the long pull, the longer the resilience.
To further confirm the impending reversal of the trend, the introduction of the KDJ indicator is used to judge the shift in buying and selling sentiment. The threshold for this strategy and the setting of the KDJ indicator value can be adjusted according to specific circumstances and needs to enhance the accuracy of the strategy.
Advantages of the K-line area strategy
The advantage of the K-line area strategy is that it combines the magnitude and variation of price trends, as well as the conversion of buying and selling sentiment, to provide a relatively complete quantitative trading strategy. Its advantages include:
- It provides a simple and intuitive way to identify the possibility of a trend reversal, helping traders better understand market trends.
- Using the combination of K-line area and KDJ indicators, the strategy is increased in reliability and accuracy.
- High flexibility, parameters can be adjusted according to market conditions to meet different trading needs.
The risks of the K-line area strategy
While there are some advantages to the K-line area strategy, it also carries some risks, including:
- Setting thresholds may require some experience and adjustment, and if set incorrectly, may lead to misjudgments of market trends.
- The accuracy of the KDJ indicator is affected by market fluctuations and noise, and false signals may occur.
- The performance of the strategy may change under different market conditions and needs to be continuously optimized and adjusted.
Optimization of the K-line area strategy
In order to optimize the K-line area strategy, consider the following:
- Optimization of parameters: constant adjustment and optimization of parameters of thresholds and KDJ indicators to adapt to different market conditions and trading needs.
- Risk management: Implement effective risk management strategies, including stop-loss and stop-loss rules, to reduce the risk of loss.
- Multi-strategy combination: Combining the K-line area strategy with other strategies to improve the performance of the integrated trading strategy.
- Real-time monitoring and adjustment: Performance of the regular monitoring strategy, adjusted and improved according to the actual situation.
Use JavaScript to implement this policy
-
Calculate K-line area
-
This is the first time I've seen this.
(1) The area of the K-line of the declining trend reaches the threshold, before it can be established
(2) The KDJ indicator is greater than 80
-
This is the first time I've seen this.
(1) The uptrend K-line area curve reaches the threshold, before it can be established
(2) KDJ value less than 20
-
Multi-headed / empty-headed: ATR tracking stop loss stop
Code Implemented
// 参数
var maPeriod = 30
var threshold = 50000
var amount = 0.1

// 全局变量
let c = KLineChart({})
let openPrice = 0
let tradeState = "NULL"  // NULL BUY SELL

function calculateKLineArea(r, ma) {
    var lastCrossUpIndex = null
    var lastCrossDownIndex = null
    for (var i = r.length - 1 ; i >= 0 ; i--) {
        if (ma[i] !== null && r[i].Open < ma[i] && r[i].Close > ma[i]) {
            lastCrossUpIndex = i
            break
        } else if (ma[i] !== null && r[i].Open > ma[i] && r[i].Close < ma[i]) {
            lastCrossDownIndex = i
            break
        }

        if (i >= 1 && ma[i] !== null && ma[i - 1] !== null && r[i - 1].Close < ma[i - 1] && r[i].Close > ma[i]) {
            lastCrossUpIndex = i
            break
        } else if (i >= 1 && ma[i] !== null && ma[i - 1] !== null && r[i - 1].Close > ma[i - 1] && r[i].Close < ma[i]) {
            lastCrossDownIndex = i
            break
        }
    }

    var area = 0
    if (lastCrossDownIndex !== null) {
        for (var i = r.length - 1 ; i >= lastCrossDownIndex ; i--) {
            area -= Math.abs(r[i].Close - ma[i])
        }
    } else if (lastCrossUpIndex !== null) {
        for (var i = r.length - 1 ; i >= lastCrossUpIndex ; i--) {
            area += Math.abs(r[i].Close - ma[i])
        }
    }

    return [area, lastCrossUpIndex, lastCrossDownIndex]
}

function onTick() {
    var r = _C(exchange.GetRecords)
    if (r.length < maPeriod) {
        LogStatus(_D(), "K线数量不足")
        return
    }
    var ma = TA.MA(r, maPeriod)
    var atr = TA.ATR(r)
    var kdj = TA.KDJ(r)
    var lineK = kdj[0]
    var lineD = kdj[1]
    var lineJ = kdj[2]
    var areaInfo = calculateKLineArea(r, ma)
    var area = _N(areaInfo[0], 0)
    var lastCrossUpIndex = areaInfo[1]
    var lastCrossDownIndex = areaInfo[2]

    r.forEach(function(bar, index) {
        c.begin(bar)
        c.plotcandle(bar.Open, bar.High, bar.Low, bar.Close, {overlay: true})
        let maLine = c.plot(ma[index], "ma", {overlay: true})
        let close = c.plot(bar.Close, 'close', {overlay: true})
        c.fill(maLine, close, {color: bar.Close > ma[index] ? 'rgba(255, 0, 0, 0.1)' : 'rgba(0, 255, 0, 0.1)'})
        if (lastCrossUpIndex !== null) {
            c.plotchar(bar.Time, {char: '$:' + area, overlay: true})
        } else if (lastCrossDownIndex !== null) {
            c.plotchar(bar.Time, {char: '$:' + area, overlay: true})
        }
        c.plot(lineK[index], "K")
        c.plot(lineD[index], "D")
        c.plot(lineJ[index], "J")

        c.close()
    })

    if (tradeState == "NULL" && area < -threshold && lineK[lineK.length - 1] > 70) {
        // long
        let tradeInfo = $.Buy(amount)
        if (tradeInfo) {
            openPrice = tradeInfo.price
            tradeState = "BUY"
        }
    } else if (tradeState == "NULL" && area > threshold && lineK[lineK.length - 1] < 30) {
        // short
        let tradeInfo = $.Sell(amount)
        if (tradeInfo) {
            openPrice = tradeInfo.price
            tradeState = "SELL"
        }
    }

    let stopBase = tradeState == "BUY" ? Math.max(openPrice, r[r.length - 2].Close) : Math.min(openPrice, r[r.length - 2].Close)
    if (tradeState == "BUY" && r[r.length - 1].Close < stopBase - atr[atr.length - 2]) {
        // cover long
        let tradeInfo = $.Sell(amount)
        if (tradeInfo) {
            tradeState = "NULL"
            openPrice = 0
        }
    } else if (tradeState == "SELL" && r[r.length - 1].Close > stopBase + atr[atr.length - 2]) {
        // cover short
        let tradeInfo = $.Buy(amount)
        if (tradeInfo) {
            tradeState = "NULL"
            openPrice = 0
        }
    }

    LogStatus(_D(), "area:", area, ", lineK[lineK.length - 2]:", lineK[lineK.length - 2])
}


function main() {
    if (exchange.GetName().includes("_Futures")) {
        throw "not support Futures"
    }
    while (true) {
        onTick()
        Sleep(1000)
    }
}
The strategic logic is simple:
First, some global variables and parameters are defined, including:
Policy parameters
- maPeriod: Period of the moving average.
- threshold: used to determine the threshold at which to buy or sell.
- amount: The number of transactions per transaction.
Global variables
- c: K-line graph object, used to draw graphs.
- OpenPrice: recording the opening price.
- tradeState: records the status of the transaction, which can be "NULL" (empty stock)
BUY (buy) or "SELL" (sell).
Calculating functions
- calculateKLineArea: This function is used to calculate the area between the price and the moving average over a period of time on a K-line chart and returns the area values, the last K-line index crossed and the last K-line index crossed. These values are used in subsequent decisions to determine when to buy and sell.
Main cycle function
-
onTick function: This is the main policy execution function, and the following are the operations within the function:
a. Obtain the latest K-line data and ensure that the number of K-lines is not less than maPeriod, otherwise record the state and return;
b. Calculate the moving average ma and the ATR indicator atr, and the KDJ indicator.
c. Obtain area information from areaInfo, the last crossed index of K strings and the last crossed index of K strings.
d. Draw a K-line and an indicator line using the K-line chart object c, while filling in different colors depending on the relationship between price and the moving average.
e. The timing of the purchase and sale shall be determined on the basis of:
If the tradeState is a NULL string, and the area is less than -threshold and the KDJ line value is greater than 70, the buy operation is executed. If the tradeState is set to NULL, and the area is greater than the threshold and the KDJ line value is less than 30, the sell operation is executed. f. Set stop-loss and stop-loss conditions, and if the conditions are met, break even:
If it is a buy position, the price breaks even when it is below the closing price of the previous trading day minus the ATR of the previous day. If it is a sell-out, the price breaks even when it is higher than the closing price of the previous trading day plus the ATR of the previous day. main function: This is the main executable input, which checks whether the name of the exchange contains the
_Futures tab, if it contains it throws an exception, otherwise enters an infinite loop, executes the onTick function in each loop and rests for 1 second.
In general, this strategy relies primarily on K-line charts and technical indicators to make buying and selling decisions, while using stop-loss and stop-loss strategies to manage risk. Please note that this is only an example strategy, and when used in practice, it needs to be adjusted and optimized according to market conditions and specific needs.
在FMZ.COM上使用JavaScript语言没有用多少行代码,很简单的就实现了这个模型。并且使用KLineChart函数很容易实现了K线面积的图形表示。策略设计用于加密货币现货市场,使用了「数字货币现货交易类库」模板,使用模板封装的函数下单,也是非常简单易用、易懂。
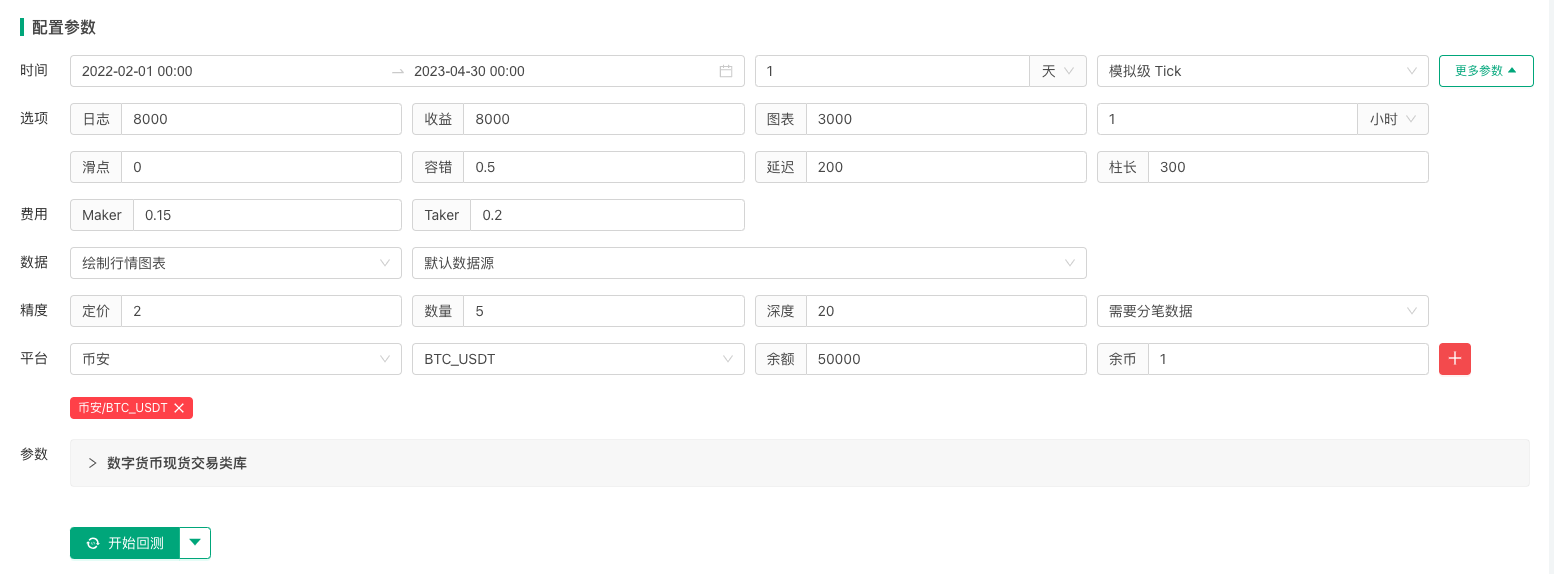
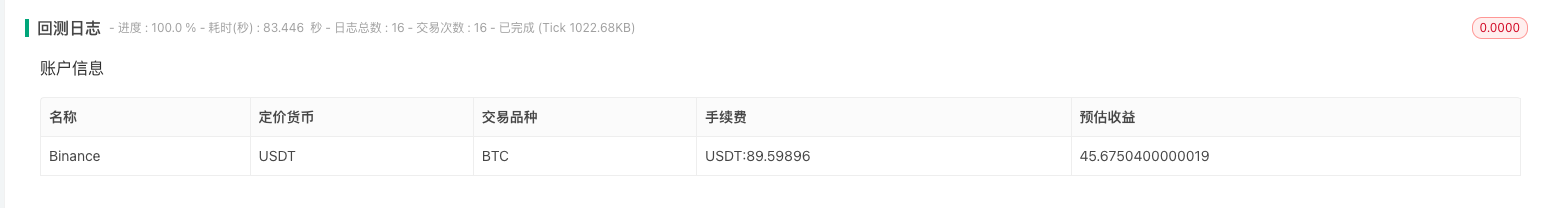
Strategic retesting
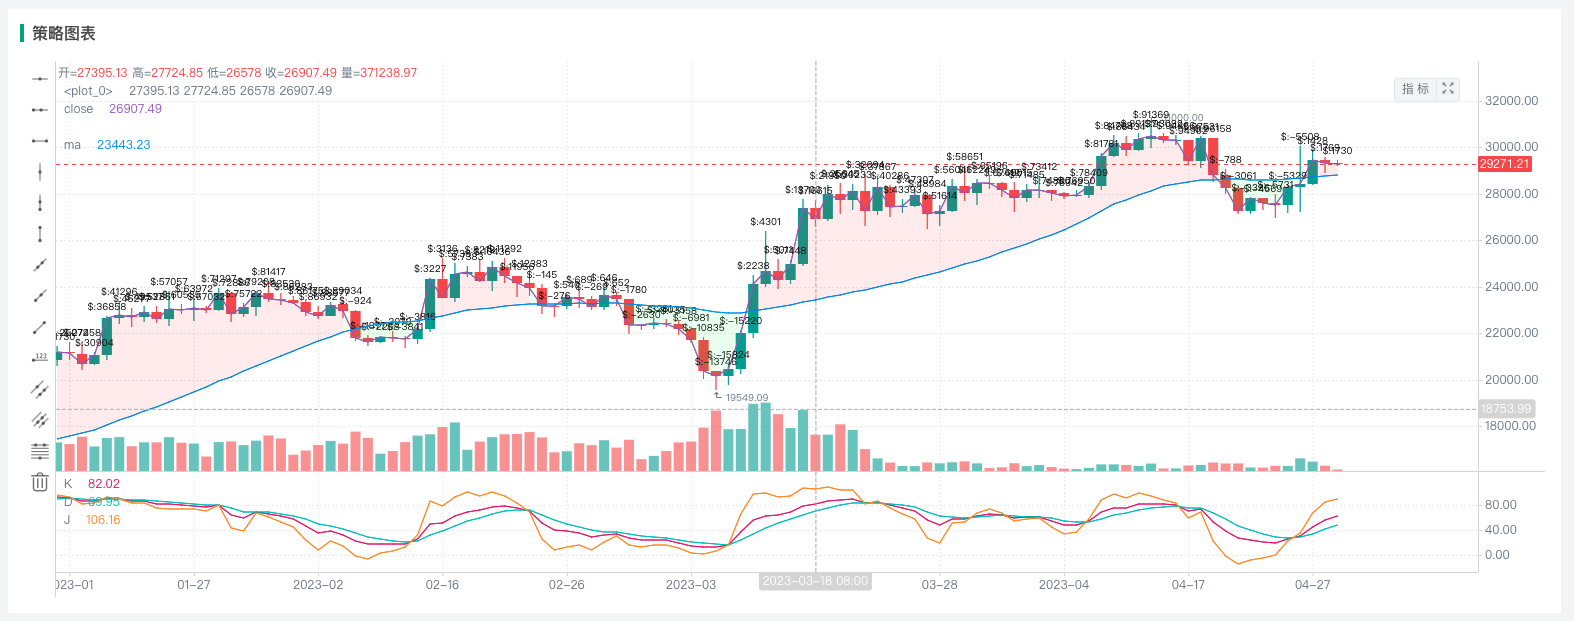
The problem of retracement is still relatively large. There should be other directions and space for optimization of this strategy. Interested parties can try to upgrade this strategy.
With this strategy, we learned not only how to compare alternative trading ideas, but also how to draw a graph; how to represent the area of the K line and the equator; how to draw the KDJ indicator, etc.
Summary
The K-line area strategy is a trading strategy based on the price trend width and the KDJ indicator, which helps traders predict market trends by analyzing the area and the conversion of buying and selling sentiment between the K-line and the median line. Despite certain risks, the strategy can provide a powerful trading tool to help traders better cope with market fluctuations. Importantly, traders should flexibly adjust the parameters and rules of the strategy to achieve better trading performance.
- A Powerful Tool for Programmatic Traders: Incremental Update Algorithm for Calculating Mean and Variance
- Programmatic trader leverage: incremental update algorithm to calculate the mean and variance
- Construction and Application of Market Noise
- PSY Factor Upgrade and Transformation
- High-Frequency Trading Strategy Analysis - Penny Jump
- Alternative Trading Ideas--K-line Area Trading Strategy
- Construction and application of market noise
- PSY (psychological line) factor upgrading and transformation
- High frequency trading strategy analysis - Penny Jump
- How to Measure Position Risk - An Introduction to the VaR Method
- How to measure the risk of holding VaR
- FMZ Mobile APP Trading Terminal, empowering your quantitative trading experience
- FMZ mobile app trading terminal that empowers you to quantify your trading experience
- Analysis and instructions for use about built-in function _Cross
- Smiley curve for delta hedging of bitcoin options
- Thoughts on High-Frequency Trading Strategies (5)
- Thoughts on High-Frequency Trading Strategies (4)
- Thinking about high-frequency trading strategies (5)
- Thinking about high-frequency trading strategies (4)
- Thoughts on High-Frequency Trading Strategies (3)