PSY (psychological line) factor upgrading and transformation
Author: Written by TradeMan, Created: 2023-11-04 11:12:42, Updated: 2023-11-06 19:39:11
Hello~Welcome come to my channel!
Welcome to my channel, I'm an expert, a Quant Developer, and a full-time developer of trading strategies such as CTA & HFT & Arbitrage. Thanks to the FMZ platform, I will share more content related to the development of quantity on my channel, and work with all traders to maintain the prosperity of the quantity community.
For more information, please go to my channel.The cottage is now in the hands of a craftsman.
Today we bring you the PSY (psychological line) factor upgrade and transformation, how to take a simple factor perspective, add more market information, make a step-by-step transformation, and finally become a more explanatory and logical power factor!!!
PART 1 Primary PSY factor is induced
The PSY factor is a technical analysis indicator used to measure the effect of market participants' emotions on price movements. It is an indicator of the emotions of investors that produce psychological fluctuations in the fall of the market. It is an indicator of the energy class and the fall class.
The PSY factor was first proposed in 1991 by Dr. Wang Yawei, who believed that psychological changes in the market are closely related to price movements and quantified psychological changes as the PSY factor. As a downward indicator of market analysis, the PSY factor calculates the total strength of the multi-space in the N-K line in time-scale to describe whether the market is currently strong or weak, overbought or oversold. It is mainly used to measure the psychological tolerability of investors by calculating how much of the K-line is overbought in the N-K line, providing a reference for investors to buy and sell operations.
The PSY factor is based on how many days the closing price has risen and fallen over a period of time. The calculation method is simple: PSY = ((N root K upward days/N) * 100, where N cycles represent the selected calculation cycle, which can be days, weeks or months.
function calculatePSY(data, n) {
  let count = 0;
  for (let i = data.length - n; i < data.length; i++) {
    if (data[i] > data[i - 1]) {
      count++;
    }
  }
  return (count / n) * 100;
}

// 使用示例
let closePrices = [10, 12, 13, 11, 14, 15, 16, 17, 18, 20];
let nPeriod = 5;
let psyFactor = calculatePSY(closePrices, nPeriod);
Log(psyFactor);
PART2 Phosphate enhancing the PSY factor (PSY+PRICE)
The PSY factor is essentially a momentum factor, a method of measuring the comparison of the roots of the downward force over a past period of time, with the aim of finding a stronger side over a past period of time. However, careful observation shows that the PSY factor only considers the BAR line as rising or falling, and the lack of a description of the BAR itself does not allow a judgment on the strength of the market, causing the following situation:
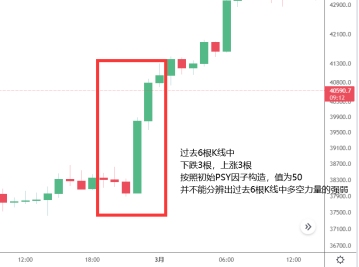
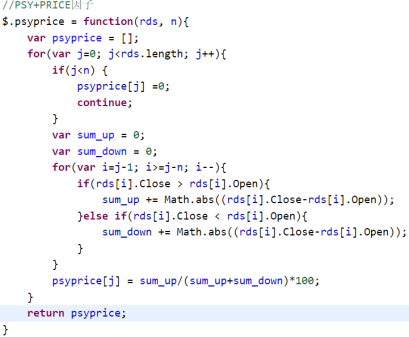
As shown above, the peculiarity of the large sunline is not reflected in the PSY indicator, but only as an upward line and the small diagonal in front of it. That is the problem, the number of ups and downs does not fully describe the magnitude and direction of the price change. So our first improvement was the idea of changing the price of each BAR plus the weight of the price Abs (((C-C[1]) in response to the magnitude of the falling force.
PART3 is the final PSY factor (PSY+PRICE+VOL)
After the previous modification, the modified PSY factor is more reflective of the strengths and weaknesses of the past period, but it is not very good to distinguish if the ups and downs in the past period are basically consistent.
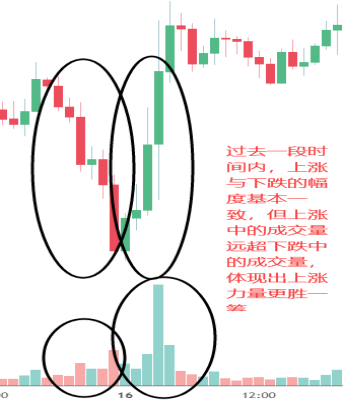
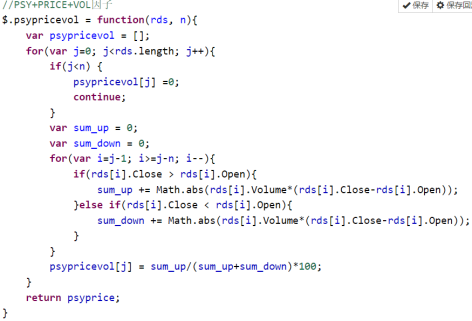
So in the final PSY factor, we continue to add the transaction factor weighted, VOLUME*Abs ((C-C[1]), the source code of the initial PSY+PRICE factor function based on the FMZ platform:
PART4 The hydrogen PSY factor is a signaling construct.
Based on the final PSY+PRICE+VOL factor constructed above, we try to propose the following constructions of several momentum signals: * psy[0] > X (in the past, the power ratio of the multi-sided value is greater than the X value) * psy[0] < Y (for the past time, the power ratio of the multi-sided value is less than the Y value) * psy[0] > psy[1] or psy[0] > psyma * psy[0] < psy[1] or psy[0] < psyma ((for the past period of time, the strength of multilateralism has decreased)
We designed a simple dynamic strategy using signals to detect the factor. * Multiple: PSY [0] > 70; Plain: PSY [0] < 30; * to empty: PSY[0] < 30; to empty: PSY[0] > 70;
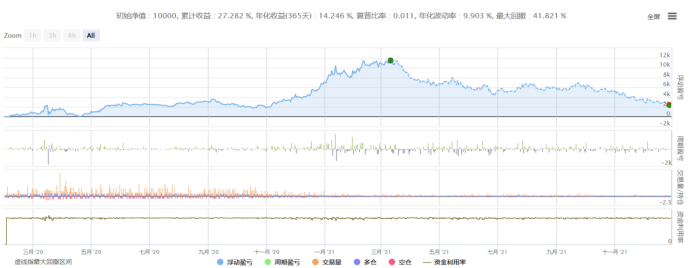
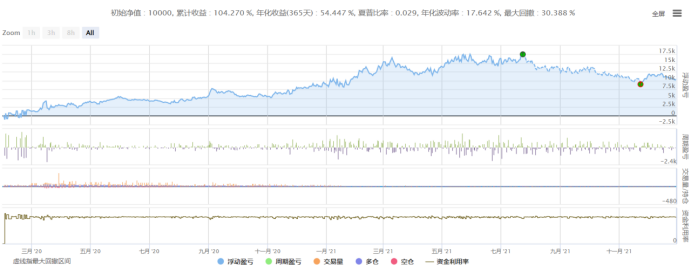
With the Binance U-bit contract, the PSY factor parameter is designed to be 12, BTC-USDT, ETH-USDT contract retest, with a maturity of 2020-02-01 to 2021-12-31, slippage point 10, transaction fee 5,10 times leverage, 5% of the remaining principal per position:
BTC-USDT:
ETH-USDT:
PART 5 Summary of the
This quantized hut upgrades and modifies the traditional psy factor, and the resulting psy+price+vol factor can be used to measure the strength and weakness of the strengths of the two sides over the past cycle at the quantitative price level, using fixed-value comparisons or their own strength and weakness comparisons to construct a corresponding momentum/feedback. The article finally establishes a fixed-value signal, performs a simple strategy review, and finds that the psy+price+vol factor can capture momentum in volatile markets, and after obtaining positive returns at a certain level.
Welcome back to the quantity hut of the handyman~
Thanks to the FMZ platform, without closing the doors to make wheels, to provide such a good exchange sanctuary for the vast majority of traders. The trading roads are rough, traders are warm, on the FMZ platform to continue to learn the share of all the front-runners to continue to grow.
- Measuring Risk and Return - An Introduction to Markowitz Theory
- Talk about the order book balance of a centralized exchange
- Measuring risk and return by the use of the Goma-Kovitz Theory
- A Powerful Tool for Programmatic Traders: Incremental Update Algorithm for Calculating Mean and Variance
- Programmatic trader leverage: incremental update algorithm to calculate the mean and variance
- Construction and Application of Market Noise
- PSY Factor Upgrade and Transformation
- High-Frequency Trading Strategy Analysis - Penny Jump
- Alternative Trading Ideas--K-line Area Trading Strategy
- Construction and application of market noise
- High frequency trading strategy analysis - Penny Jump
- How to Measure Position Risk - An Introduction to the VaR Method
- Alternative trading ideas - K-line area trading strategies
- How to measure the risk of holding VaR
- FMZ Mobile APP Trading Terminal, empowering your quantitative trading experience
- FMZ mobile app trading terminal that empowers you to quantify your trading experience
- Analysis and instructions for use about built-in function _Cross
- Smiley curve for delta hedging of bitcoin options
- Thoughts on High-Frequency Trading Strategies (5)
- Thoughts on High-Frequency Trading Strategies (4)