Construction and application of market noise
Author: Written by TradeMan, Created: 2023-11-04 11:32:29, Updated: 2023-11-06 19:38:41
Hello~Welcome come to my channel!
Welcome to my channel, I'm an expert, a Quant Developer, and a full-time developer of trading strategies such as CTA & HFT & Arbitrage. Thanks to the FMZ platform, I will share more content related to the development of quantity on my channel, and work with all traders to maintain the prosperity of the quantity community.
For more information, please go to my channel.The cottage is now in the hands of a craftsman.
- Do you often find it difficult to distinguish trends from shocks?
- Do you feel like you've been blown away by the chaos that's been happening?
- Do you find it difficult to distinguish the current situation in the market?
- Do you trade trends hoping to filter out shocks?
Hahana, you are in the right place, today's handmade quantum cabin brings you the construction and application of market noise! As we all know, financial markets are full of noise, it is very important to quantify the modeling of market noise. Noise sculpting can better help us to distinguish the current state of the market and predict future possibilities!
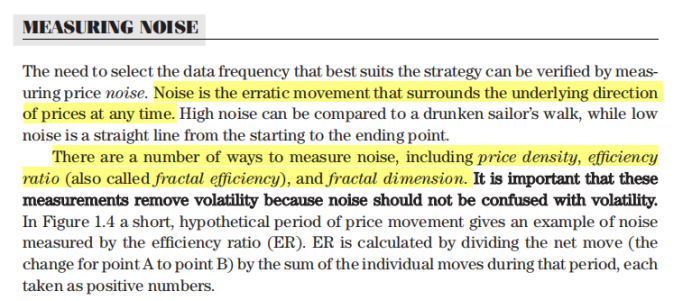
PART 1 The resolution of noise is crucial for financial market trading.
The time series of financial markets is characterized by a high confidence noise ratio, most of the time the market fluctuations are unclear, even when the trend market often shows a situation like four steps forward and three steps back. Therefore, in the financial markets, the definition, identification and classification of market noise is very important and meaningful.
PART2 Construction-ER efficiency coefficient of the noise of the pump
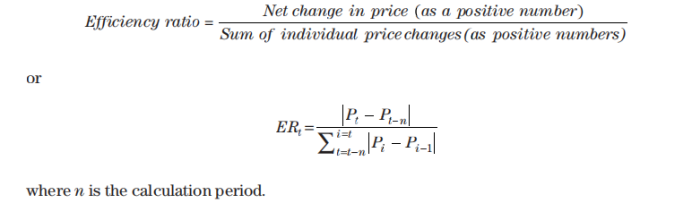
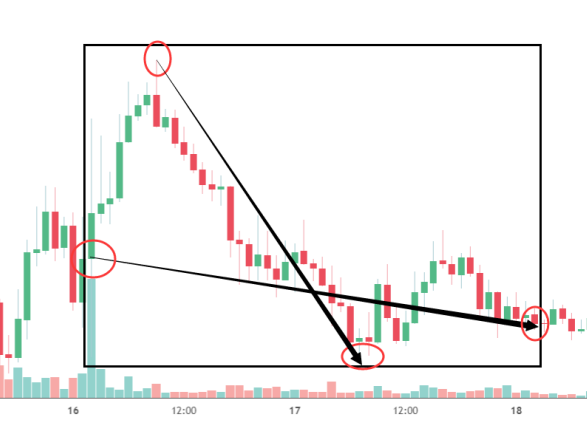
The net value at the beginning and end of the price changes divided by the sum of the two price changes over the period.
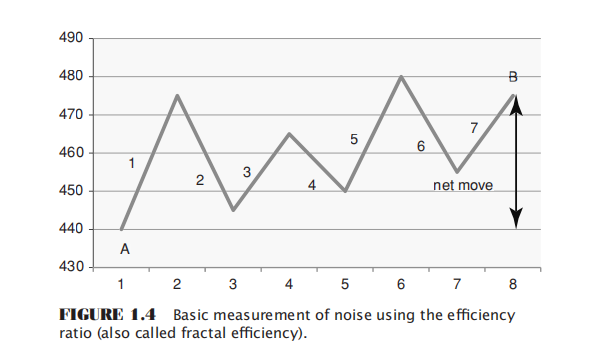
The difference between points A and B divided by the sum of the movements of the middle 7 segments
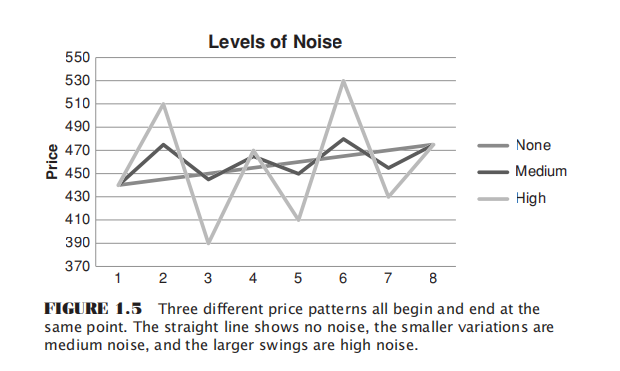
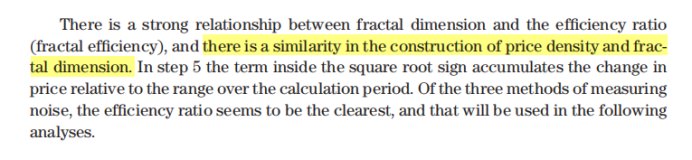
The different noise levels exhibited by different price operating patterns are shown under the same magnitude of movement of the price. A straight line indicates no noise, a small change up and down the line indicates medium noise, and a large swing indicates high noise.
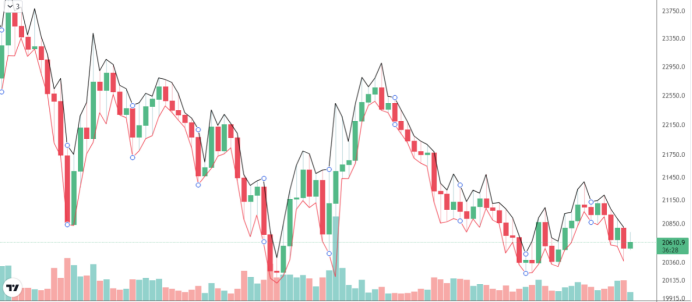
PART 3 Construction of the noise barrier - price density barrier
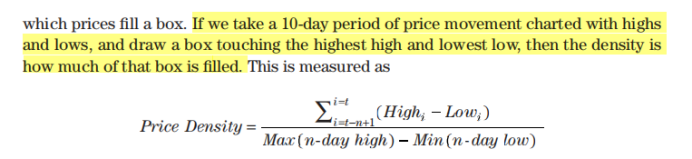
The definition here is: plot the highs and lows of the price action over the past period of time, pull the highest and lowest prices over that period into a box, and the so-called price density is the number of price points that can be accommodated in the box.
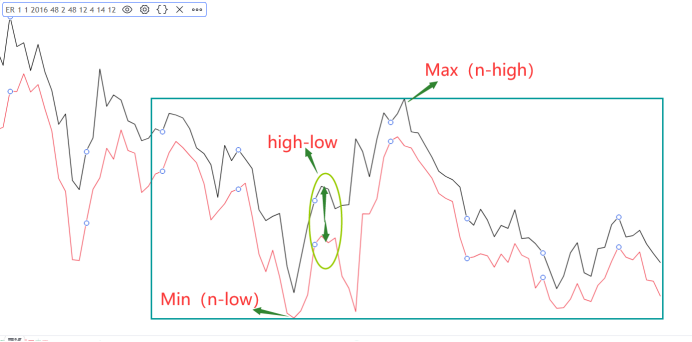
Compared to the ER efficiency coefficient, the price density measurement takes into account the highest and lowest prices per K-line.
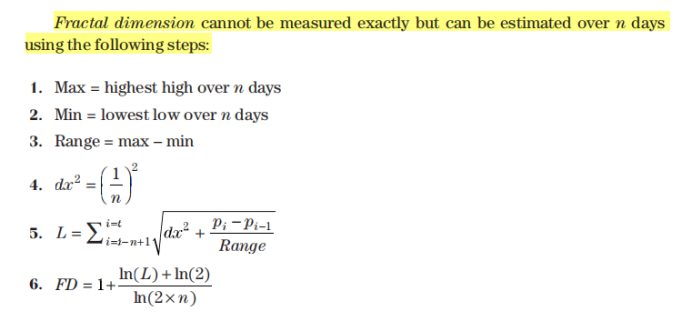
PART 4 Construction of the particle noise - dimensional particle
The segmentation dimension cannot be accurately measured, but can be estimated over the past n root time using the following steps:
PART 5 Construction of noise - the rest of the way
CMI (Tide Index) = (close[0] - open[n-1]) / (Max high ((n) - Min low ((n)); When the noise is lower, the final net value of the period is infinitely close to the difference between the highest and lowest prices, and the CMI infinitely close to 1⁄2.
The results obtained by the different methods of constructing noise measurements are highly similar. The core of the method is to compare the net change and the process of change or the change extreme over a period of time.
PART 6 - classifying the market in terms of noise and frequency
Volatility and noise are aspects of the market that are plotted in different dimensions. The sum of the price changes in the two price patterns above is the same, so they have the same volatility, the greater the net change, the lower the noise.
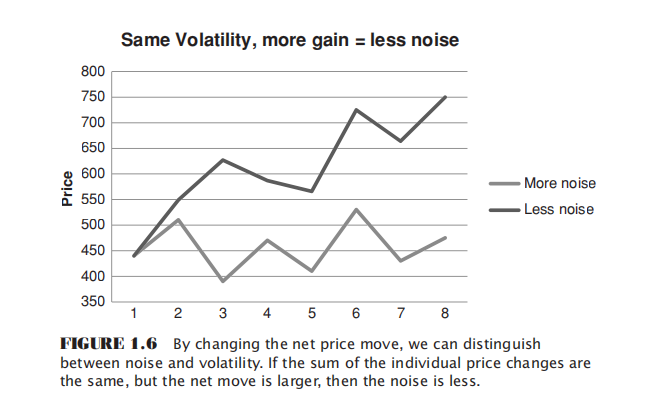
So noise and volatility are two different angles, and from these two different angles it is just a coincidence that a stylistic division of the market can be made. If we take the continuity and volatility of the market as the horizontal and vertical axes, respectively, and build a cross-coordinate system, we can divide the market price volatility into the following four states:
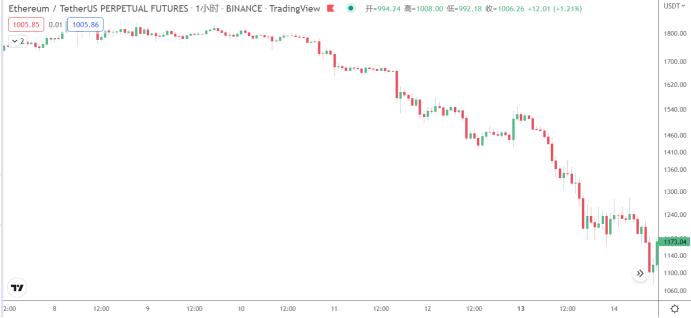
- This is a good continuity, high volatility, and trendy slope.
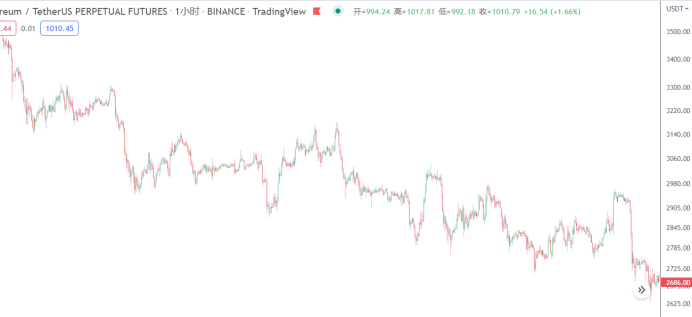
- The trend is stable, volatile and low volatility.
- The report also highlights that the country's economy is in a state of decline.
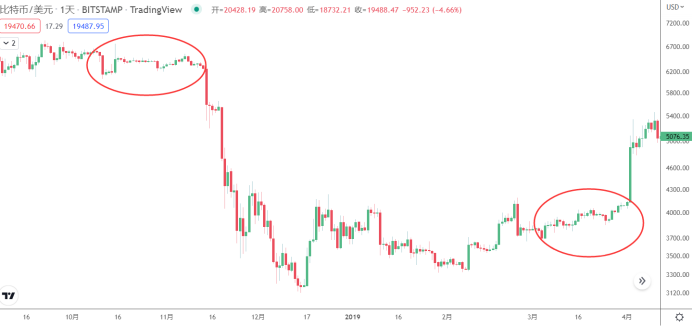
- In addition, the number of deaths in the country has been increasing.
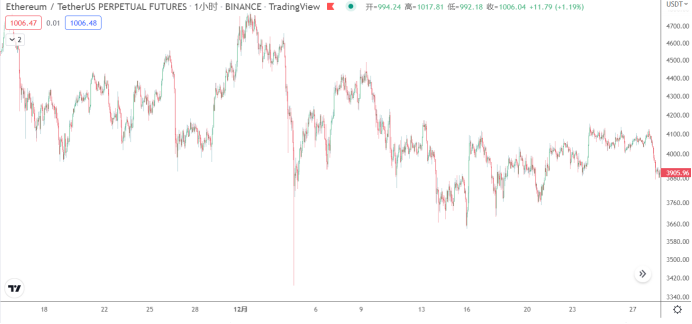
It should be noted that there is no absolute standard for what is called wide or narrow, and that the level and system of one's trading is highly individual, as is the setting of the trading cycle. We can only judge the current state of the market by examining the past period of time.
Of course, the four types of volatility are also not completely random in the conversion. Ideally, a slippage trend is often followed by a broad swell, slowly unloading the momentum; then entering a narrow range, the market is very inactive, with many gaps in each other; other markets are compressed to a critical point, and the trend starts again; the above is a simplified ideal model, the reality is much more complex. For example, a narrow range does not necessarily have to be a trend, there may also be a broad swell, and a downtrend does not necessarily have to be a broad swell, with the possibility of continuing to innovate high or low.
PART 7 The impact of noise on related transactions
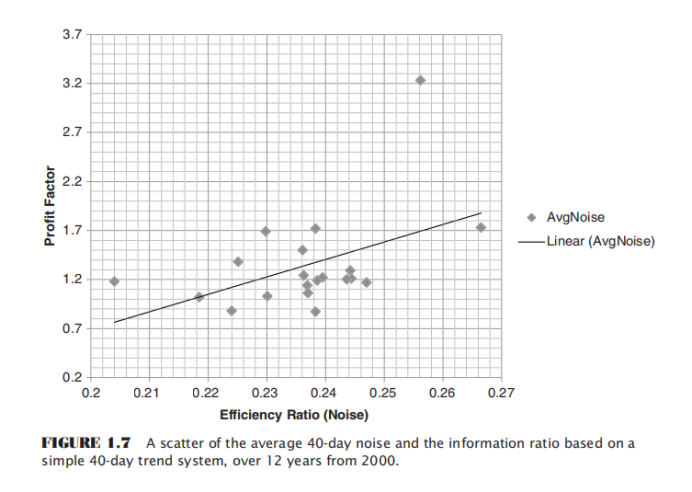
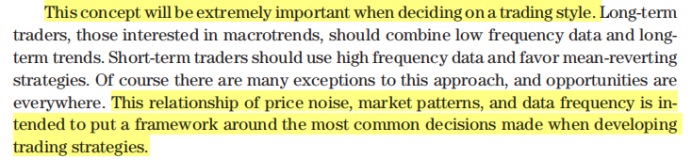
By regression of the 40-day moving average strategy's profit factor (multi-line, total profit/loss) to 40-day noise (ER efficiency coefficient), we see that the higher the noise, the lower the trend strategy's profit factor.
The concept of market noise is very important in determining the trading style, and we need to outline the market before developing a corresponding trading strategy.
PART 8 Silicon market maturity and noise
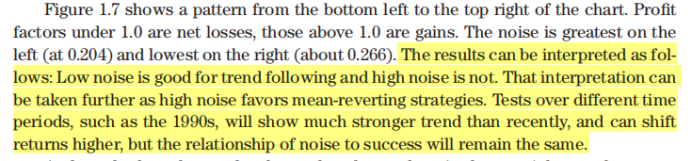
Over the past two decades, the noise attribute of the North American stock market has experienced a steady rise.
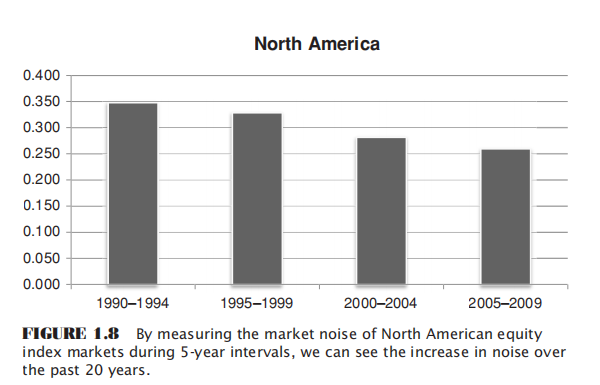
The financial markets in various regions are gradually maturing, the noise is increasing, and this is happening fast.
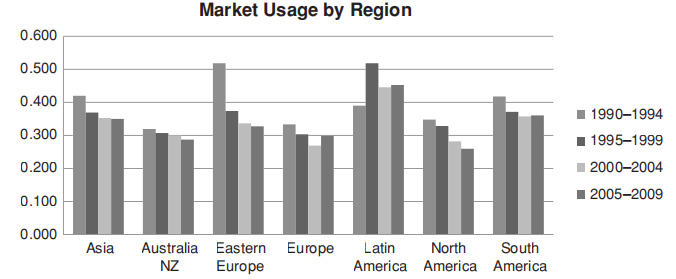
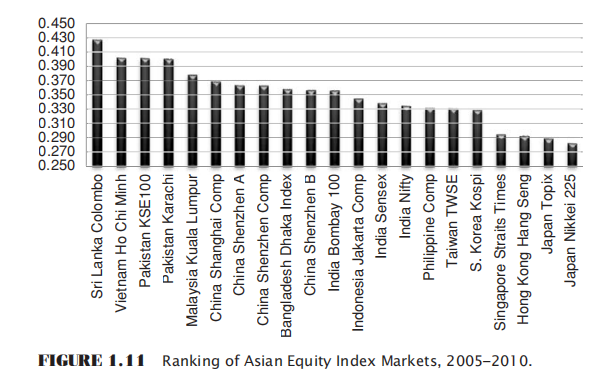
A study of the stock market indices of the countries was done, the most mature markets on the right are the most noisy markets, the most immature markets on the left are the least noisy ones. It can be seen that Japan is the most mature market, followed by the economies of Hong Kong, Singapore, South Korea, and the relatively immature markets of Vietnam and Sri Lanka on the left.
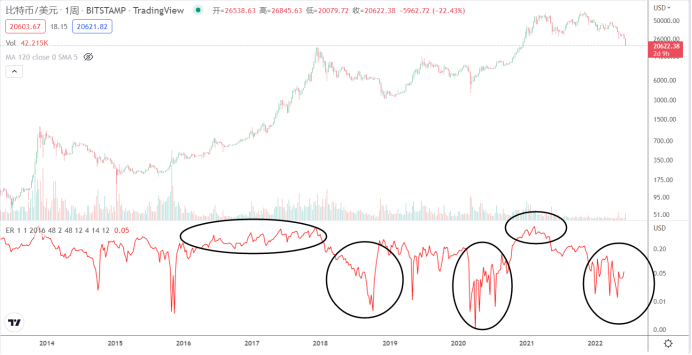
For the Bitcoin market, the quarterly noise is around 0.2-0.3, and is cyclical.
Welcome back to the quantity hut of the handyman~
Thanks to the FMZ platform, without closing the doors to make wheels, to provide such a good exchange sanctuary for the vast majority of traders. The trading roads are rough, traders are warm, on the FMZ platform to continue to learn the share of all the front-runners to continue to grow.
- A Brief Discussion on the Balance of Order Books in Centralized Exchanges
- Measuring Risk and Return - An Introduction to Markowitz Theory
- Talk about the order book balance of a centralized exchange
- Measuring risk and return by the use of the Goma-Kovitz Theory
- A Powerful Tool for Programmatic Traders: Incremental Update Algorithm for Calculating Mean and Variance
- Programmatic trader leverage: incremental update algorithm to calculate the mean and variance
- Construction and Application of Market Noise
- PSY Factor Upgrade and Transformation
- High-Frequency Trading Strategy Analysis - Penny Jump
- Alternative Trading Ideas--K-line Area Trading Strategy
- PSY (psychological line) factor upgrading and transformation
- High frequency trading strategy analysis - Penny Jump
- How to Measure Position Risk - An Introduction to the VaR Method
- Alternative trading ideas - K-line area trading strategies
- How to measure the risk of holding VaR
- FMZ Mobile APP Trading Terminal, empowering your quantitative trading experience
- FMZ mobile app trading terminal that empowers you to quantify your trading experience
- Analysis and instructions for use about built-in function _Cross
- Smiley curve for delta hedging of bitcoin options
- Thoughts on High-Frequency Trading Strategies (5)
Currency circle calculatorThank you for sharing, it was inspiring.