5.3 How to read the strategy backtest performance report
Author: Goodness, Created: 2019-06-25 13:42:21, Updated: 2025-01-15 22:08:48
Today’s market analysis platforms allow traders to quickly review a trading system. Whether looking at hypothetical results or actual trading data, there are hundreds of performance metrics that can be applied. These performance metrics are typically displayed in a strategy performance report, a compilation of data based on different mathematical aspects of a system’s performance. Knowing what to look for in a strategy performance report can help traders analyze a system’s strengths and weaknesses.
A strategy performance report is an objective evaluation of a trading system’s performance. Traders can create strategy performance reports to analyze their actual trading results. A set of trading rules can also be applied to historical data to determine how the system would have performed during the specified period—a process called backtesting. Most market analysis platforms allow traders to create a strategy performance report during backtesting, a valuable tool for traders wishing to test a trading system before putting it to use in the market.
Elements of a Strategy Performance Report
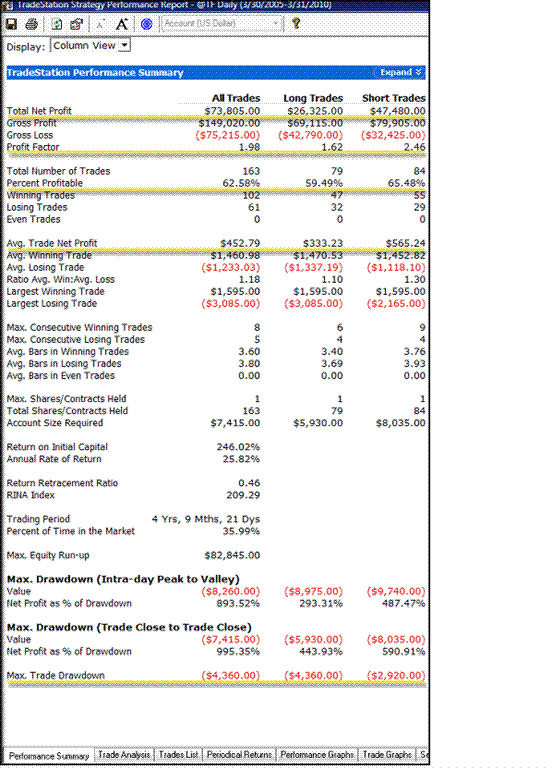
The “front page” of a strategy performance report is the performance summary. Figure 1 shows an example of a performance summary that includes a variety of performance metrics. The metrics are listed on the left side of the report; the corresponding calculations are found on the right side, separated into columns. The five key metrics of the report are underlined; we’ll discuss them in detail later.

Figure 1 - The “front page” of a strategy performance report is the performance summary. The key metrics identified in this article appear underlined.
In addition to the performance summary seen in Figure 1, strategy performance reports may also include trade lists, periodical returns, and performance graphs. The trade list provides an account of each trade that was taken, including information such as the type of trade (long or short), the date and time, price, net profit, cumulative profit, and percent profit. The trade list allows traders to see exactly what happened during each trade.
Viewing the periodical returns for a system allows traders to see performance broken down into daily, weekly, monthly, or annual segments. This section is helpful in determining profits or losses for a specific time period. Traders can quickly assess how a system is performing on a daily, weekly, monthly, or annual basis. It is important to remember that in trading, it is the cumulative profits (or losses) that matter. Looking at one trading day or one trading week is not as significant as looking at the monthly and yearly data.
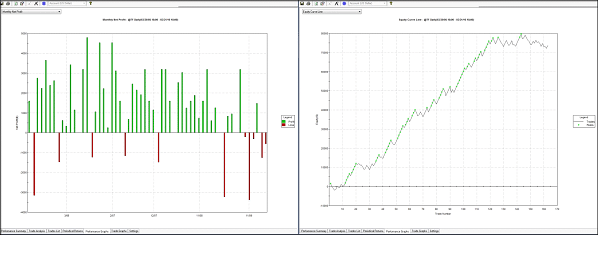
One of the quickest methods of analyzing strategy performance is the performance graph. This shows the trade data in a variety of ways, from a bar graph showing a monthly net profit to an equity curve. Either way, the performance graph provides a visual representation of all the trades in the period, allowing traders to quickly ascertain whether or not a system is performing up to standards. Figure 2 shows two performance graphs: one as a bar chart of monthly net profit; the other as an equity curve.

Figure 2 - Each performance graphs represents the same trade data shown in different formats.
Key Metrics of a Strategy Performance Report
A strategy performance report may contain a tremendous amount of information regarding a trading system’s performance. While all of the statistics are important, it’s helpful to narrow the initial scope to five key performance metrics:
- Total Net Profit
- Profit Factor
- Percent Profitable
- Average Trade Net Profit
- Maximum Drawdown
These five metrics provide a good starting point for testing a potential trading system or evaluating a live trading system.
Total Net Profit
The total net profit represents the bottom line for a trading system over a specified period of time. This metric is calculated by subtracting the gross loss of all losing trades (including commissions) from the gross profit of all winning trades. The formula would be:

So, in Figure 1, the total net profit is calculated as:

While many traders use total net profit as the primary means to measure trading performance, the metric alone can be deceptive. By itself, this metric cannot determine if a trading system is performing efficiently, nor can it normalize the results of a trading system based on the amount of risk that is sustained. While certainly a valuable metric, total net profit should be viewed in concert with other performance metrics.
Profit Factor
The profit factor is defined as the gross profit divided by the gross loss (including commissions) for the entire trading period. This performance metric relates the amount of profit per unit of risk, with values greater than one indicating a profitable system. As an example, the strategy performance report shown in Figure 1 indicates the tested trading system has a profit factor of 1.98. This is calculated by dividing the gross profit by the gross loss:
\(149,020 ÷ \)75,215 = 1.98
This is a reasonable profit factor and signifies that this particular system produces a profit. We all know that not every trade will be a winner and that we will have to sustain losses. The profit factor metric helps traders analyze the degree to which wins are greater than losses.
\(149,020 ÷ \)159,000 = 0.94
The above equation shows the same gross profit as the first equation but substitutes a hypothetical value for the gross loss. In this case, the gross loss is greater than the gross profit, resulting in a profit factor that is less than one. This would be a losing system.
Percent Profitable
The percent profitable metric is also known as the probability of winning. This metric is calculated by dividing the number of winning trades by the total number of trades for a specified period. As an equation:

In the example shown in Figure 1, the percent profitable would be:
102 (winning trades) ÷ 163 (total # of trades) = 62.58% (percent profitable)
The ideal value for the percent profitable metric will vary depending on the trader’s style. Traders who typically go for larger moves, with greater profits, only require a low percent profitable value to maintain a winning system, because the trades that do win—that are profitable, that is—are usually quite large. This typically happens with the strategy known as trend trading. Those that follow this approach often find that as few as 40% of trades might make money and still produce a very profitable system because the trades that do win follow the trend and typically achieve large gains. The trades that do not win are usually closed for a small loss.
Intraday traders, and particularly scalpers, who look to gain a small amount on any one trade while risking a similar amount will require a higher percent profitable metric to create a winning system. This is due to the fact that the winning trades tend to be close in value to the losing trades; in order to “get ahead” there needs to be a significantly higher percent profitable. In other words, more trades need to be winners, since each win is relatively small.
Average Trade Net Profit
The average trade net profit is the expectancy of the system: It represents the average amount of money that was won or lost per trade. The average trade net profit is calculated by dividing the total net profit by the total number of trades. As an equation:

In our example from Figure 1, the average trade net profit would be:
\(73,805 (total net profit) ÷ 166 (total # of trades) = \)452.79 (average trade net profit)
In other words, over time we could expect that each trade generated by this system will average $452.79. This takes into consideration both winning and losing trades since it is based on the total net profit.
This number can be skewed by an outlier, a single trade that creates a profit (or loss) many times greater than a typical trade. An outlier can create unrealistic results by overinflating the average trade net profit. One outlier can make a system appear significantly more (or less) profitable than it is statistically. The outlier can be removed to allow for more precise evaluation. If the success of the trading system in backtesting depends on an outlier, the system needs to be further refined.
Maximum Drawdown
The maximum drawdown metric refers to the “worst case scenario” for a trading period. It measures the greatest distance, or loss, from a previous equity peak. This metric can help measure the amount of risk incurred by a system and determine if a system is practical, based on account size. If the largest amount of money that a trader is willing to risk is less than the maximum drawdown, the trading system is not suitable for the trader. A different system, with a smaller maximum drawdown, should be developed.
This metric is important because it is a reality check for traders. Just about any trader could make a million dollars—if they could risk 10 million. The maximum drawdown metric needs to be in line with the trader’s risk tolerance and trading account size.
The Bottom Line
Strategy performance reports, whether applied to historical or live trading results, can provide a powerful tool for assisting traders in evaluating their trading systems. While it is easy to pay attention to just the bottom line or total net profit (we all want to know how much money we’re making), considering additional performance metrics can provide a more comprehensive view of a system’s efficacy—and its ability to achieve our trading goals.
- Quantitative Practice of DEX Exchanges (2) -- Hyperliquid User Guide
- DEX exchange quantitative practices ((2) -- Hyperliquid user guide
- Quantitative Practice of DEX Exchanges (1) -- dYdX v4 User Guide
- Introduction to Lead-Lag Arbitrage in Cryptocurrency (3)
- DEX exchange quantitative practice ((1) -- dYdX v4 user guide
- Introduction to the Lead-Lag suite in digital currency (3)
- Introduction to Lead-Lag Arbitrage in Cryptocurrency (2)
- Introduction to the Lead-Lag suite in the digital currency (2)
- Discussion on External Signal Reception of FMZ Platform: A Complete Solution for Receiving Signals with Built-in Http Service in Strategy
- Discussing FMZ platform external signal reception: a complete set of strategies for the reception of signals from built-in HTTP services
- Introduction to Lead-Lag Arbitrage in Cryptocurrency (1)
- Application of technical indicators in quantitative trading
- Use JavaScript to implement a quantification policy while running the Go function in a wrapper.
- 19 professionals share their tips for trading digital currencies
- Shannon's demonic spell applied to digital currency
- Creating a Bitcoin trading robot that won't lose money
- From quantitative trading to asset management to developing CTA strategies for the ultimate payoff
- Nine trading rules that helped a trader go from $1,000 to $46,000 in less than a year
- Inventors introduce quantitative trading - from the basics to the real world.
- 5.5 Trading strategy optimization
- 5.4 Why do we need an off-sample test
- 5.2 How to do quantitative trading backtesting
- 5.1 The meaning and trap of backtesting
- 4.6 How to implement strategies in C++ language
- 4.5 C++ Language Quick Start
- 4.4 How to implement strategies in Python language
- 4.3 Getting started with the Python language
- 4.2 How to implement strategic trading in JavaScript language
- 4.1 JavaScript language quick start
- 3.5 Visual Programming language implementation of trading strategies
- 3.4 Visual programming quick start