Inventors introduce quantitative trading - from the basics to the real world.
Author: Goodness, Created: 2019-06-25 15:48:58, Updated: 2023-10-31 21:01:08Max Drawdown is a very important indicator of risk, even more important than volatility. The maximum drawdown seen in the retrospective also represents in some sense the worst possible situation after you open the position.
In mathematical terms, a 20% loss of capital requires a 25% profit on the remaining capital to restore the original size of the capital.
There is no doubt that the greater the loss, the less likely and more difficult it is to recover to the initial capital size. The upward profit margin is infinite, the downward loss margin is limited, and the greater the likelihood of bottom-up.
In any case, at least these two points are the current mainstream perception: The smaller the maximum drawback, the better. The greater the risk, the smaller the risk, the greater the risk.
Adjusted earnings risk ratio (RAROC)
Many people are unfamiliar with the concept, in fact, the adjusted return risk is a more balanced indicator between professional and amateur players. It is also a very good assessment tool for investment banks, large funds, professional traders, and a common benchmark in the global financial sector.
In investing, one looks not only at the profit, but also at the amount of risk involved in obtaining those profits. In general, the risk and return of an asset is proportional. This means that when the model is boasting about its yields, its glamour may hide risks that have not yet erupted.
For example, the open and close conditions in the model have higher returns on the upside, but double the losses on the downside, resulting in huge losses. However, the upside and downside have a considerable asymmetric effect.
Many experienced quantitative traders are willing to sacrifice a portion of the return in order to reduce risk, in which case the risk-adjusted return is more of a reference value. So in retrospect, a high-risk, volatile model, even with a high return, is not necessarily a good model.
Deposits are safe, but annual returns are only 2% ‒ the market can make you gain 50% in a few days, or you can lose 50% in a few days ‒ trading for so many years, I have a very important idea of my own: to face risk, risk and return never exist in isolation, trading is like going out to sea to fish, you want to fish, but you do not want to take the risk of the sea, it is impossible ‒ too conservative and too radical, in fact, go to two extremes ‒ and so is the design of strategic models ‒ trading is like going out to sea to fish, you want to fish, but you do not want to take the risk of the sea.
The number of transactions
You can't always prove this model with months of retest performance. If you have too little retest data, then the retest results may be random, either parameter random, or event random, etc. Longer historical data can also filter out some survivor bias.
In general, for domestic stocks, commodities, data should be retested for more than 5 years, for newly listed varieties, at least 3 years. For earlier listed varieties or gold, dollar index, etc. in the international market, at least one bull and bear cycle should be retested, generally over 10 years.
Average profits
Average profit is a seemingly ordinary but important indicator. Its calculation is also very simple: net profit/number of transactions. It is not an exaggeration to say that it is a mirror to distinguish between those that measure performance.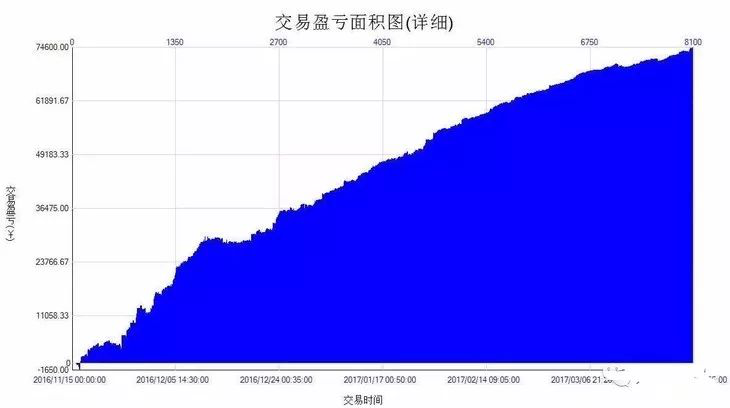 Figures 5 and 18
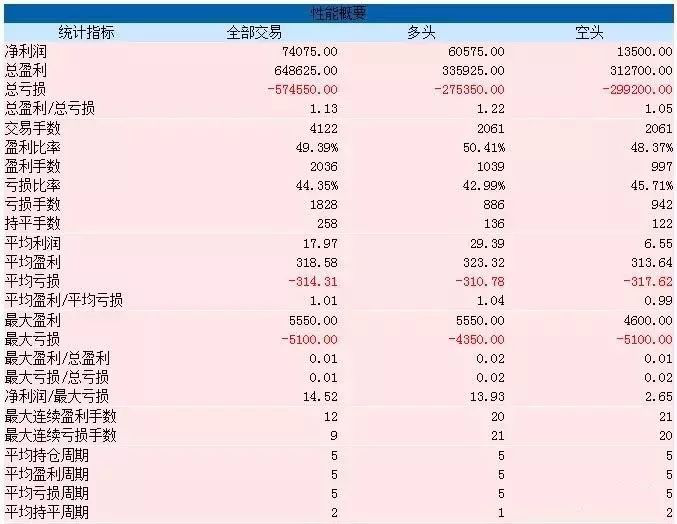 Figure 5 to 19
If you look at this strategy to see how it performs, you might wonder, is this almost perfect strategy worth it? And slowly! Take a closer look at the second graph, the average profit is only 17, i.e. the average profit is only $17 per trade.
In most futures markets, one jump is 10 yuan, but anyone who has done real-time trading can understand what this means.
The odds of winning
Winning rates never exist in isolation, or it is impractical to ask about winning rates in isolation. It is not surprising, but it makes no sense, that if you use the right model in the right market, the winning rate reaches 80%.
The price is not going up or down, otherwise it is not moving. If you have enough time, you will find that the probability of the price going up and going down is 50%. No matter what type of strategy model you use, you should be careful if the win rate is more than 50% when retesting. From a mathematical and physical perspective, this is impossible.
The equity curve
The so-called "equity curve" is the time from the time of the first entry to the end of the last bar of the chart. It is a real-time money curve of transactions, and it is said to be real-time because it takes into account the floating profit and loss on each bar. Figure 5 to 20
The detailed profit and loss curve reflects the change in the net worth of the account and is the most intuitive evaluation tool to have an overview at a glance of the loss and profit situation of the strategy and the degree of fluctuation / smoothness of the loss.
Annual rate of return
Annual returns are a controversial indicator, considered by some to be for outsiders to see, and have no reference value. First, profitability is a prerequisite for the model to be selected, or that the model return itself must be positive. Figure 5 to 21
You can have an infinite number of 100% returns, but you can only afford one 100% at most. The gap between the annualized rate of return and the real rate of return (the holding rate) can be large, sometimes larger than we imagine.
Summary
Finally, it is worth pointing out that there is no such thing as a perfect test result, and that in addition to the problem of testing the data itself, the users of the model may face more pitfalls, from parameter optimization to transactional design, which may differ from the actual operation.
More importantly, the emotional issue at the execution level is the X factor of the model's input into production, and real-world trading cannot operate in an environment of emotional vacuum, a phenomenon that every programmatic trader must constantly be on guard against.
After-school homework
First, list the performance indicators that you think are most important in your retest. 2, try to calculate the Sharpe ratio indicator
5.4 Why do we need an out-of-sample test?
Summary
In the previous section, I will teach you how to read a strategy review performance report around several important performance indicators. In fact, writing a strategy that makes money from a review is not the most difficult, but even more difficult is how to evaluate whether the strategy continues to work in the real world. So today I will tell you about off-sample testing and its importance.
The retest is not the same as the real disk.
Many quantitative beginners are easily convinced of their trading strategy by retesting a seemingly good performance report or capital curve, and are ready to make their mark in the market. While this retesting can be perfectly suited to a market condition they observe, once the trading strategy is put into practice for a longer period of time, they will find that it does not work.
I've seen a lot of trading strategies that have a success rate of over 50% when retested. With such a high win-loss ratio, you can also have a win-loss ratio of over 1: 1. However, these strategies are basically loss-making once applied to the real world. There are many reasons for the loss, including the fact that there are too few data samples at retesting, which leads to poor data migration.
However, trading is such a tangled thing that in hindsight, it is clear that if we go back to the beginning, we are still not sure. This touches on the limitations of quantitative roots and historical data. It is difficult to avoid the problem of looking at the rear-view mirror to test trading strategies with only limited historical data.
What is an out-of-sample test?
The answer is the out-of-sample test method. When back-testing, the historical data is divided into two periods according to the time, the first segment of data is used for strategy optimization, called the training set, and the second segment of data is used for out-of-sample testing, called the test set.
If your strategy is always effective, then optimize the best set of parameters in the training set data and apply those parameters to the test set data to retest, ideally, the retest results should be the same as the training set, or within a reasonable range.
But if a policy performs well on the test set, but performs poorly on the test set, or changes a lot, and the same applies to other parameters, then the policy may have a data migration bias.
To give an example, suppose that we want to retest commodity futures screw steel, now screw steel has about 10 years of data ((2009-2019)), then we can take the data from 2009-2015 as a training set, and take the data from 2015-2019 as a test set. For example, a double-linear strategy, the best set of parameters in the training set are ((15-cycle linear and 90-cycle linear), ((5-cycle linear and 50-cycle linear), ((10-cycle linear and 100-cycle linear)... Then we put these parameters separately into the test set retest, and compare the results of the test report and the capital curve of the training set with the test set, to judge whether their differences are within a reasonable range.
If you do not use out-of-sample testing, and you directly retest the strategy with data from 2009 to 2019, you may get a good retest performance report and funding curve by matching the historical data, but such retest results are not very significant and do not serve as guidance, especially for those strategies with more parameters.
Progress of the out-of-sample testing
In addition to splitting the historical data into two parts for both in-sample and out-sample retrospection, there is actually a better option, which is the regression retrospection and cross-reference retrospection methods. Especially in cases where there is little historical data, such as crude oil futures that have just been listed in recent years, or Apple futures, both methods can be used to fully test the model using the limited data.
The basic principle of a regression test is to train the model with the previous longer historical data, and then test the model with the relatively shorter data that follows, and then continuously move the data window backwards, repeating the training and testing steps. Training data: from 2000 to 2001, test data: from 2002; Training data: from 2001 to 2002, test data: from 2003; Training data: from 2002 to 2003, test data: from 2004; Training data: from 2003 to 2004, test data: from 2005; Training data: from 2004 to 2005, test data: from 2006; ...and so on and so forth... Finally, the results of the tests in 2002, 2003, 2004, 2005, 2006, etc. were statistically evaluated to provide a comprehensive assessment of the performance of the strategy.
The following diagram illustrates an intuitive explanation of the principle behind the push-up test: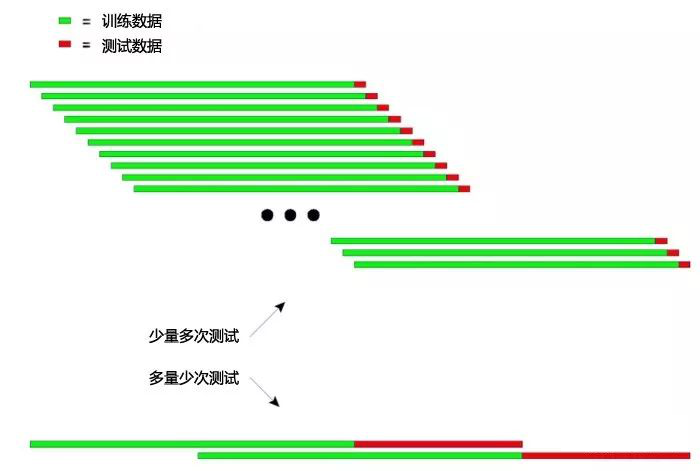 Figure 5 to 22
The diagram above shows two methods of push-up testing.
The first is that each test has a shorter test run and a larger number of tests. The second is that the test data is longer and the number of tests is smaller.
In practical applications, multiple tests can be performed to determine the stability of the model in the face of non-equilibrium data by changing the length of the test data. The basic principle of cross-checking is to divide all the data into N parts, train on each of the N-1 parts, and test on the remainder.
Divide the years 2000 to 2003 by year into four parts. The operation of the cross-checking is as follows:
1, training data: 2001-2003, test data: 2000;
2, Training data: 2000-2002, test data: 2003;
3, Training data: 2000, 2001, 2003, test data: 2002; and
4 Training data: 2000, 2002, 2003, test data: 2001, and the following: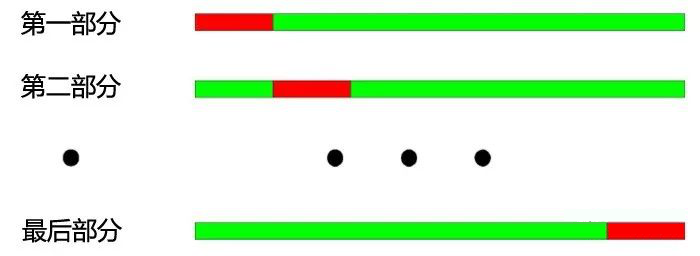 Figure 5 to 23
As shown above, the biggest advantage of cross-checking is the full use of limited data, each training data is also test data. However, there are also obvious disadvantages when cross-checking is applied to the testing of strategy models:
1, when price data is not stable, the model test results are often unreliable. For example, training with 2008 data and testing with 2005 data. It is likely that the market environment in 2008 has changed significantly compared to 2005, so the model test results are unreliable. 2, similar to the first, in cross-checking, it is not logical to train the model with the latest data and test the model with older data. Additionally, when testing a quantitative strategy model, both push and cross checks encounter data overlap issues.
When developing a trading strategy model, most of the technical indicators are based on historical data of a certain length. For example, using a trend indicator to calculate the historical data of the last 50 days, and the next trading day, the indicator is calculated from the data of the previous 50 days, then the data of the calculation of the two indicators is the same for 49 days, which will result in the change of the indicator every two adjacent days.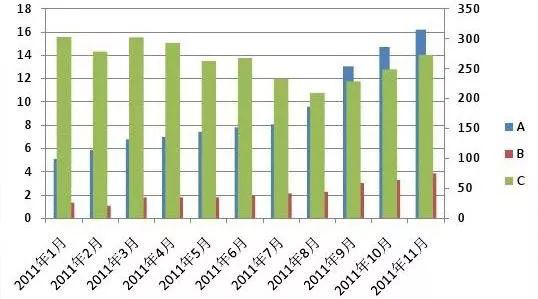 Figure 5 to 24
Overlapping data can lead to the following effects: 1, slow changes in model predicted outcomes lead to slow changes in holdings, which is what we often call lagging indicators. 2, some statistical values are not available for the model results test, and the results of some statistical tests are unreliable because of the sequence relatedness caused by the repetition of data.
Good trading strategies should be profitable in the future. Out-of-sample testing, in addition to being able to objectively detect trading strategies, can more efficiently save the time of quantitative traders. In most cases, it is very dangerous to go into real-world combat directly with the best parameters of the entire sample.
If all historical data prior to the time point of optimization is separated into in-sample and out-sample data, and the parameters are optimized using the in-sample data, then the out-of-sample data is used for out-of-sample testing, this error can be sorted out, while also checking whether the optimized strategy is applicable to future markets.
Summary
Just like trading, we can never travel through time and make a correct decision for ourselves without making a single mistake. If there is a hand of God or the ability to travel back from the future, then without testing, we can trade directly online, and the pot is full. And we mortals must test our strategy in historical data.
However, even with a history of vast amounts of data, history is extremely scarce in the face of an endless and unpredictable future. Therefore, trading systems based on history pushed up and down will eventually sink with time. Because history cannot end in the future. Therefore, a complete prospective trading system must be supported by its internal principles, logic.
"Trust but verify" President Reagan
After-school homework
1 What are some real-life phenomena of survivorship bias? 2° using the inventor's quantification tools, re-measuring and comparing the differences between the samples.
5.5 Optimization and optimization of trading strategies
Summary
Trading strategy is essentially a generalization and summary of the laws of the market. The deeper your understanding of the market and the better your ability to express ideas in code, the closer your strategy will be to the market. This section will continue to explain how to optimize your trading strategy to make the final preparation for your real-time trading.
Optimized in and out
Most trend tracking strategies use methods such as breakouts or technical indicators to capture the market, usually the way in which these signals enter and exit, the time efficiency is low. If the strategy uses a closing price model, then the entry point will be at the opening price of the lower root K line, and therefore will miss the best entry time for breaking this K line, and will miss a large profit in invisible.
So an effective approach is to use the more advantageous instant price in the implementation of the strategy, and immediately issue an order when the signal is generated. Thus, when the signal is generated, you can immediately enter the market without losing profits. But not all instant prices are better than the closing price, which is also determined by the trading strategy.
Optimization of parameters
Parameter optimization can bring the quantitative trading strategy closer to historical data and back-test performance for better results. For example: we use a double-equivalent strategy in a screw-steel contract, but which two equals are best to use?
As shown in the following diagram, the two-square policy is itself a multidimensional instance, and if we plot the results of the regression of each parameter into a point (note the diagram below), then each parameter is one dimension of this policy, and ultimately all the parameter combinations construct this complex multidimensional curve shape (like a peak).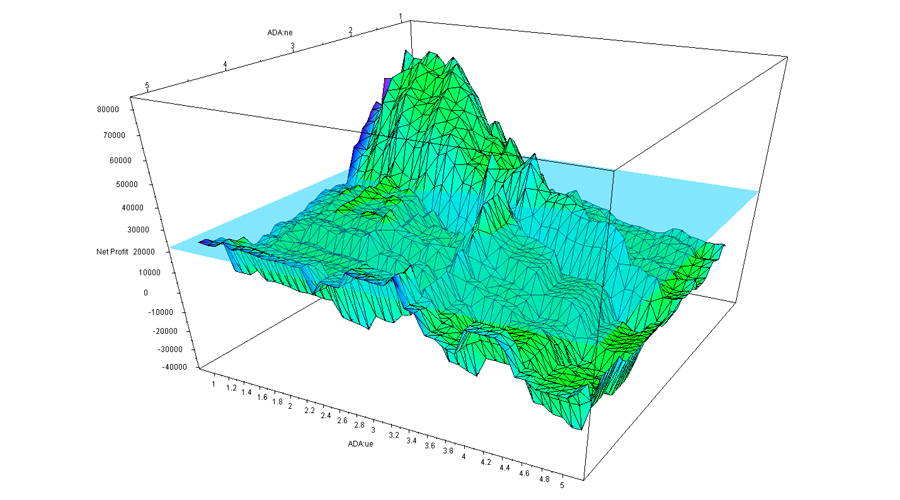 Figure 5 to 25
As shown above, this is a two-parameter strategy performance graph, and with the variation of the parameters, the final yield also varies greatly, with strong distortion of the curve, forming different high and low peaks and valleys. Usually, the optimized yield is first, the highest point of all the curves. But from the point of view of parameter sensitivity, objectivity, etc., sometimes this result may not be the best one.
Therefore, an important principle of parameter optimization is to choose a parameter plateau rather than a parameter island. The so-called parameter plateau refers to the existence of a broader range of parameters within which the strategy can perform better. Generally, a similar normal distribution is formed at the center of the plateau. Figure 5 to 26
Parameters of the plateau
For example, a good tactical parameter distribution should be a parameter plateau, so that even when the parameters are set to a deviation, the profitability of the strategy can still be guaranteed. Such parameters are stable and can make the strategy more versatile when it encounters all kinds of situations in future real-world battles. Figure 5 to 27
Parameters of islands
For example, if the retest performance shows parametric isolation, the profitability of the strategy will be greatly reduced when small deviations of the parameters occur, and such parameters are poorly applicable and often difficult to cope with market conditions that vary in actual trading.
Therefore, if the nearest parameter performs much less than the optimal parameter, then this optimal parameter may be an over-sampling result, which can be considered mathematically as a singularity solution rather than the extreme value solution to be sought. From a mathematical point of view, the singularity is unstable, and in future uncertainties, once market characteristics change, the optimal parameter may become the worst parameter.
Increased filtering
Many trend strategies, when the market is trending, are very good at capturing the trend and achieving good returns, but if they work over the long term, the end result is not a small profit or a loss of money, where is the problem?
The reason for this is that the strategy involves repeated trading in a volatile market, where most of the trading is loss-making or low profitability, and the market is in a volatile market for about 70% of the time, with long-term continuous small losses, resulting in all previous profits being reversed.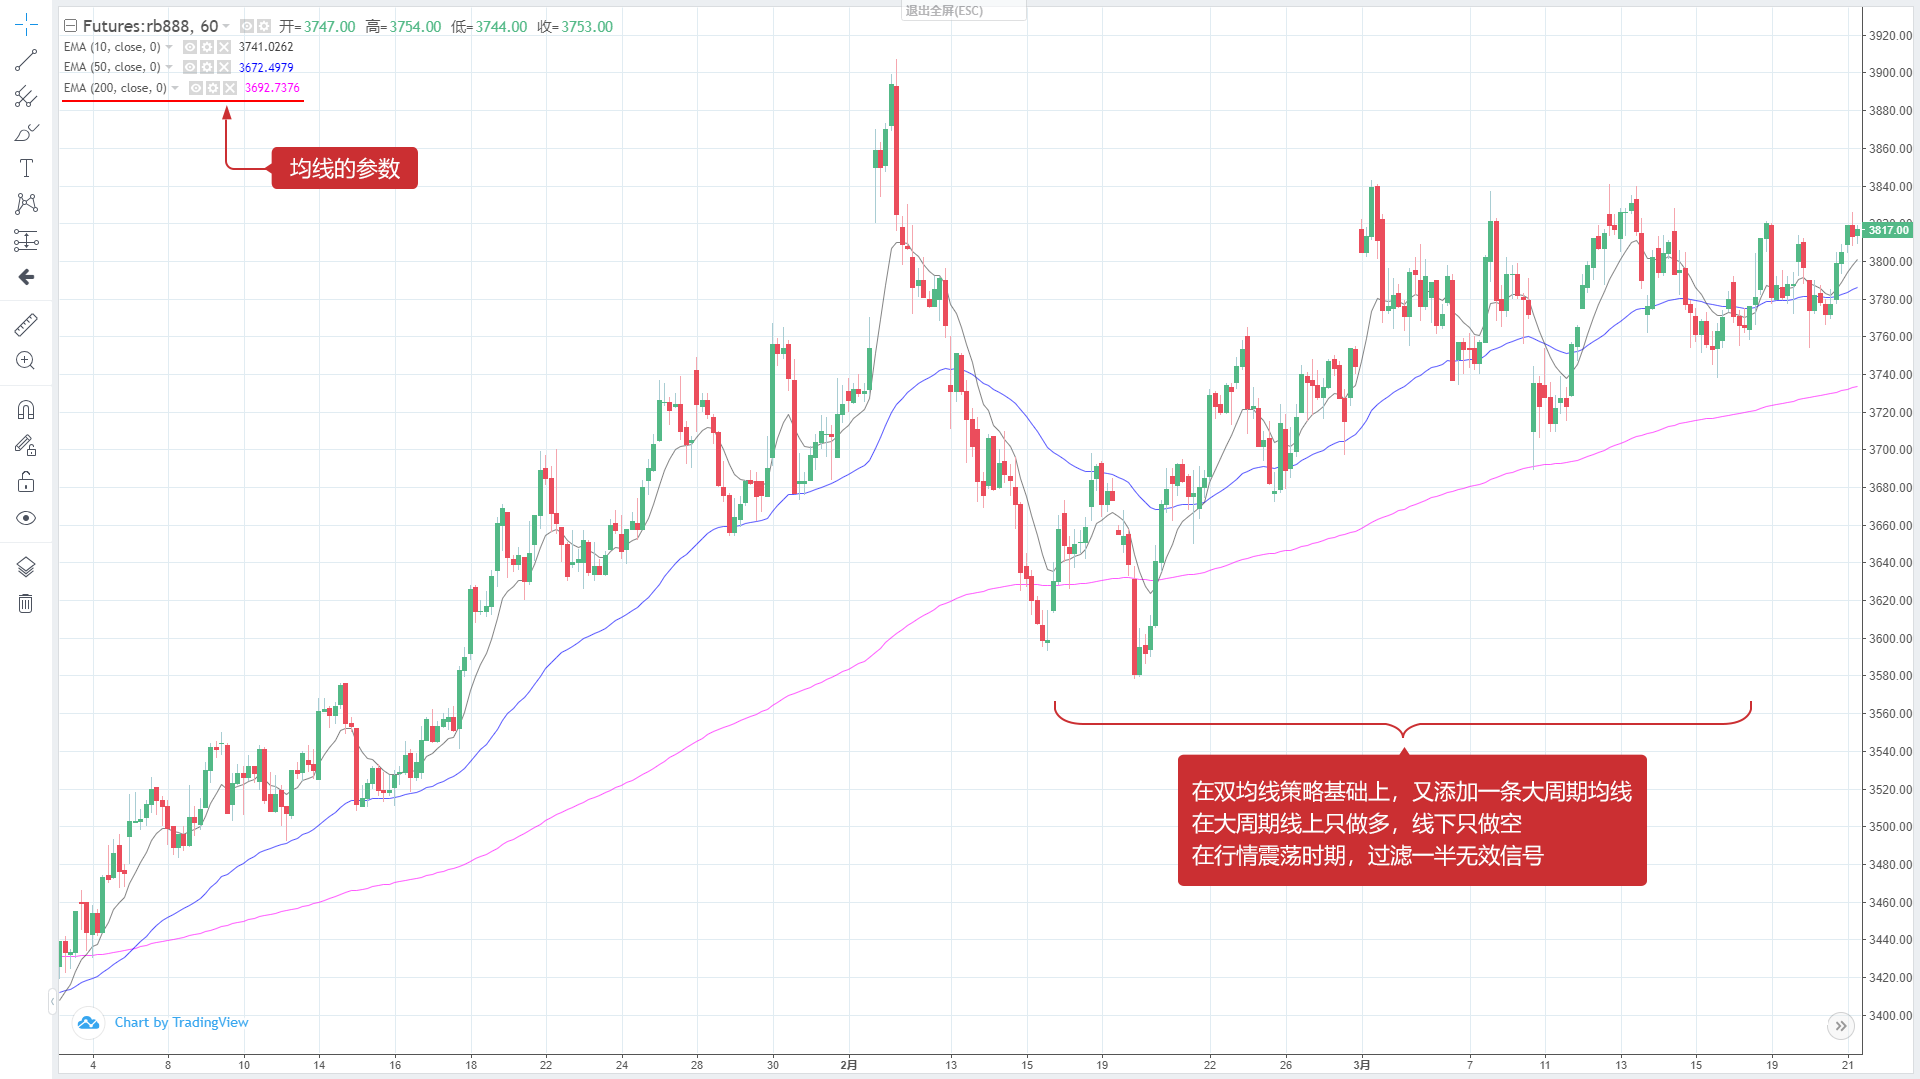 Figure 5 to 28
The solution is to add filters, which are available in many types, including loss-profit filters, risk value filters, trend pattern filters, technical indicator filters, etc. For example, adding a large cyclic homogeneous filters can reduce the number of transactions and filter out half of the wrong transactions in a turbulent market.
Smoothing the funding curve
The pursuit of quantification is a way to achieve a stable and sustainable profit, which is what the vast majority of traders would like to see. No one wants to make 50% this year, lose 30% next year, lose 40% next year, and would rather accept a 20% annual return, but it can last for a decade or more.
To achieve a smooth capital curve, a multi-strategy, multi-variety, multi-cycle, multi-parameter portfolio construction is needed. But not necessarily the more the better. There is a marginal decreasing effect, the more portfolios are added at the beginning, the better the dispersion, but the decreasing effect of dispersion begins to appear when the strategy reaches a quantitative level.
Giving Up on the Grail
Is it possible to find the Holy Grail with quantitative trading, which is a question that many traders will consider. Some traders, after a simple retest, rush into the market with the so-called perfect strategy.
But is there really a holy grail? The answer is very simple, no. In fact, it is not difficult to understand, if the market really has a law, then the higher the IQ, the higher the education, the harder the people will find the law, whether it is mathematical analysis, information monopoly, or other analytical methods, they will eventually make most of the money in the market, and for a long time, these people will monopolize the trading market, until the market can not function properly.
Summary
If the trading time is long enough, anyone can face a variety of market trends during the trading process, and these trends cannot be completely repeated in the past. As a quantitative trader, in addition to correctly examining and optimizing your trading strategy, you need to continuously monitor the market condition and constantly improve your strategy for market changes.
It is also important to realize that profits and losses are part of the overall trading strategy and that even the best trading strategy can go through a series of reversal periods, and that your trading rules and strategy should not be questioned when every trade has a loss. At least do not easily change your strategic logical framework, unless your logical framework is wrong in the first place.
After-school homework
1. Build portfolios according to the characteristics of your strategy and measure back with inventor quantified tools Try to optimize your quantitative trading strategy based on this section.
5.6 Build a probability mindset to improve your trading patterns
Summary
Trading is both a science and an art. There are many methods of trading, whether it is value investing, technical analysis, hot spots, leverage hedging, etc. On the surface, it seems logically rigorous and theoretically plausible.
Although the different trading methods start differently, the road to Rome is paved. The advantage of value investing is that a safe margin can be drawn based on price fluctuations; the advantage of technical analysis is that three assumptions give the transaction a certain scientificity.
However, they all have one thing in common: price analysis can only make rough predictions about the future, not precise predictions. Even combining fundamental analysis with technical analysis does not solve the problem of improving price accuracy, so trading is a game of probabilities from start to finish.
The game of probability
In fact, trading is not just a game of probability. People's lives, too small to cross the road (the green light, is it safe to cross the road now?), what kind of friends to make (is this friend reliable?), what kind of career to pursue (is career trading really a good career?), who to marry (will we be happy together?) etc. are all games to evaluate the probabilities of risk and reward.
A major reason many people make mistakes in trading is the lack of probability thinking, which makes trading too emotional rather than rational. Emotional is actually our primal instinct, and in the market, these primal instincts can stimulate many of our weaknesses and amplify them. This is also why most people come to the market and end up failing.
Why the deal failed
Reason one: human nature.
The vast majority of people have a weakness: they like to have a cheap share and are afraid of losing a small amount. In the market, as soon as there is a small profit, they immediately cash in and make a profit; once there is a loss, they hold a loss position, trying to make a profit, resulting in small losses that slowly accumulate into large losses.
The price is neither rising nor falling, otherwise it is stationary. In the long run, if the probability of winning and losing money is about 50% without taking into account the procedure fees and slippage points, then the trading method of the vast majority of people also becomes a negative expectation strategy with limited profit and unlimited risk.
In real life, this is very similar to the thinking of the poor and the thinking of the rich. Poor people hate risk and fear loss. They love drought savings jobs and seek security. Even if they do something, they are not absolutely sure, they are determined not to do it.
The rich are more willing to take risks, knowing that the risks and rewards are always in proportion, that only in risk is opportunity conceived, that they evaluate the risks reasonably, and that they are brave enough to bet when the risks are under control.
Reason 2: I like to make money fast.
Foreign owned institutions have made a statistic that in the long run, the annual return on net assets in most industries is unlikely to exceed 15%. On the contrary, many retailers believe that a 15% return on the market is not a good way to say hello. People like to make money fast, and in practice, they are heavy-handed and short-handed.
Re-storage Over-trading, high leverage, and quoting are all very tempting and very dangerous. If you have a 50% winning strategy, full-trading plus quoting, and if you're lucky, you may win ten or more times in a row, and wealth can change from quantity to quality.
But it only takes one mistake and it all comes down to zero. Even if you are just a heavy trader and don't distribute, there is also the risk that your account will come down to zero because you can't guarantee that you won't lose ten or more times in a row in the next market. Even heavy trading can turn a trading strategy that was originally expected into a losing and winning strategy.
The short line In the trading circle, the artificial currencies, the daily short lines, the quantized high frequency have always been very mysterious, and I do not suspect those who look at the seconds to trade, but try to convince you to give up short lines from another angle.
We judge the viability of a method not only by looking at those who succeed with it, but also by looking at those who fail with it. In other words, you can't assume that buying the lottery is the right strategy because some people bought the jackpot.
Moreover, if you look at the ranking of private products, more than three years, several of the top 100 companies are either short lines or short lines. There is no doubt that short lines are very low, and even if successful, it is difficult to maintain this method of quick money in the long term.
Reason three: prejudice
If you can, I suggest you spend 100 minutes watching a movie titled Twelve Angry Men. A movie remade in four countries, the original 1957 US version, the 1991 Japanese version, the 1997 Russian version, the 2014 Chinese version. While the film doesn't teach you how to trade, it does teach you how to look at things and learn to know yourself, which is very important.
Because human experience is limited, human cognition is also limited. Everyone, to a greater or lesser extent, has prejudices based on their own experiences and experiences. Many times, prejudice becomes the habit of most people, who take it for granted to judge many things with their own emotions.
Returning to the market, it doesn't really matter whether your judgment of the market is based on fundamental analysis or technical analysis. If your view differs from that of the majority of the market, the price is more biased towards the majority of the market, and the market will not operate according to your view.
Therefore, it is important to keep in mind that when trading, you should not rely on your judgement, but ultimately be based on the facts, based on the price. The only force that drives the price down is most people's expectations for the future. And your judgement has no weight in the market, so do not let your judgement form your own bias.
Reason four: The pursuit of perfection.
The market has actors from all walks of life, from physics, statistics, mathematics, astronomy, etc. Many are trying to explain the market with their expertise.
But the participants in the market are people, and people themselves are cognitively limited, that is, the market itself is wrong, imperfect. So how can we explain the market using these "perfect" methods?
The above lists the reasons why the vast majority of people who come to the market end up failing. In addition to the main reasons mentioned above, there are many other factors that will not be listed here in detail. In short, other obstacles to your success, besides your belief that you will win, are the others.
Those who make money in the market because they are lucky will eventually pay it back to the market. So, the futures market is a negative game market. You can only be successful if you change your mindset and build your trading strategy.
What is probability thinking?
Probability thinking, a name in the literature, commonly referred to as gambling thinking. You did not hear wrong, trading is gambling. When you hear gambling, you may associate "whoever whoever who gambles loses money or runs out of debt or divorces" and avoid it.
There are indeed some red-eyed gamblers in society. But gambling is not gambling. "Gambling" is probably one of the most misunderstood words. If your strategy is negative expectations, you are a gambler; if your strategy is positive expectations, you are a gambler.
If we take away the meaning of "gambling" and understand it as taking a certain risk and getting a certain return, then life is really "gambling"; choosing which profession to go to school, not buying a house, not getting a horse on a project, working or starting a business, etc.
Even saving money in the bank is a gamble, because you are not sure whether the future will be inflationary or whether the bank will go bankrupt (refer to the Greek debt crisis); in short, every process of life from the cradle to the grave is gambling.
How to win in the long run
The concept of a gambler needs to be further addressed, how can you win long-term? Before studying long-term strategies, let's first study the principles of long-term strategies.
That's what's in the casino: the hundred-player, the roulette wheel, the slot machine, the 21 point, etc., no matter how you change the game, the casino will eventually win. Here, in fact, is hidden a secret that the casino never tells: the law of large numbers.
How the game works
Three ducks, small bet, 4-10 is small, 11-17 is large, bet even and win money. And the jackpot has a fence, that is, three ducks the same number of points, casino owner killed, the fence is 2.8%. Then the probability of appearing large and small is 48.6%.
(0.486+0.028)100100-0.486100100=280
However, this casino strategy is flawed, and if one big player bets tens of billions of dollars and wins, the casino goes bankrupt. So, the casino sets a betting limit, and if the player exceeds this limit, he can not bet again. This way, even if the hacker may be lucky at one time to win money, in the long run, or lose to the probability, in an infinite number of poker games, the hacker will lose 2.8% of the money.
Law of large numbers
The casino owner has only a 2% advantage over the gambler, and in a single bet, the boss may be a loser, or even may experience continuous losses. But the casino owner is not frightened by losses, because he knows that his way to make money is the "law of the majority" in which it works, as long as someone continues to gamble, only 2% of the weak advantage is needed, so that he can be stable and profitable in the long term.
So the casino isn't afraid that you'll win money, it's afraid that you won't come. You've even heard about banks going bankrupt over the years, but when did you hear about casinos going bankrupt?
There are other examples of similar odds: various lotteries. The prize pool of the lottery has been increasing since the lottery was launched, and of course the money has come from the majority of lottery players. Do you know what the odds of 5 million in a double ball are?
Changes in probability
Suppose there is a coin with the same weight as the reverse side, and the probability of the word (back) and the flower (front) being thrown is 50%, and the result of each toss is unrelated to the previous one. The probability of a positive coin being thrown 10,000 times in a row is approximately 50%.
However, the probability of a positive result is not necessarily 50% if only 10 are rolled. So the casino owner must ensure that he triggers the desired strategy enough times for the desired strategy to work. This is also the reason why private investors cannot stop the strategy unless there are special circumstances when they start a quantitative trading strategy.
How to use the law of large numbers to create a long-term, win-win strategy in the financial markets will be the subject of our next series, so look forward to it!
Summary
In this article, we're going to explain how to think about trading in a scientific way from the perspective of probability, why trades fail, the right way to think about trading, the principle of the inevitable winner. I believe that if you learn, the change in thinking will be the change in your behavior, and the change in behavior will be the change in your success.
After-school homework
First, why is it that trading is a game of probability? 2 What are the other reasons for the failure of the transaction?
- DEX exchange quantitative practice ((1) -- dYdX v4 user guide
- Introduction to the Lead-Lag suite in digital currency (3)
- Introduction to Lead-Lag Arbitrage in Cryptocurrency (2)
- Introduction to the Lead-Lag suite in the digital currency (2)
- Discussion on External Signal Reception of FMZ Platform: A Complete Solution for Receiving Signals with Built-in Http Service in Strategy
- Discussing FMZ platform external signal reception: a complete set of strategies for the reception of signals from built-in HTTP services
- Introduction to Lead-Lag Arbitrage in Cryptocurrency (1)
- Introduction to the Lead-Lag suite in digital currency (1)
- Discussion on External Signal Reception of FMZ Platform: Extended API VS Strategy Built-in HTTP Service
- External signal reception on FMZ platforms: extended API vs. built-in HTTP services
- Discussion on Strategy Testing Method Based on Random Ticker Generator
- Industry giant reveals algorithmic trading: inventors quantify platforms as market strategy
- Calculation and application of DMI indicators
- An intraday trading strategy using the mean value return between SPY and IWM
- Application of technical indicators in quantitative trading
- Use JavaScript to implement a quantification policy while running the Go function in a wrapper.
- 19 professionals share their tips for trading digital currencies
- Shannon's demonic spell applied to digital currency
- Creating a Bitcoin trading robot that won't lose money
- From quantitative trading to asset management to developing CTA strategies for the ultimate payoff
- Nine trading rules that helped a trader go from $1,000 to $46,000 in less than a year
- 5.5 Trading strategy optimization
- 5.4 Why do we need an off-sample test
- 5.3 How to read the strategy backtest performance report
- 5.2 How to do quantitative trading backtesting
- 5.1 The meaning and trap of backtesting
- 4.6 How to implement strategies in C++ language
- 4.5 C++ Language Quick Start
- 4.4 How to implement strategies in Python language
- 4.3 Getting started with the Python language
- 4.2 How to implement strategic trading in JavaScript language
Hailhydra2Good article!
The vacuum is quantized mark