This is from YouTube's "Magic Double EMA Uniform Strategy".
Author: Inventors quantify - small dreams, Created: 2022-10-09 15:56:22, Updated: 2024-11-29 18:59:45
This is from YouTube's "Magic Double EMA Uniform Strategy".
In this issue, we're going to explore a "magical double EMA homogeneous strategy" from YouTube, which is called the stock and cryptocurrency market killer strategy. I watched the video and learned that this strategy is a trading view pine language strategy using two trading view indicators. Seeing the feedback in the video is very good, FMZ also supports the trading view pine language, so you can't help but want to review, test and analyze yourself. Then start working on it! That's how you start copying the strategy in the video.
Indicators used in the strategy
The EMA indicator
For simplicity of design, we don't use the Moving Average Exponential listed in the video. We use the built-in ta.ema in trading view instead.
2 VuManChu Swing Free Indicator is a free indicator.
This is an indicator in Trading View, and we need to go to Trading View and download the source code.
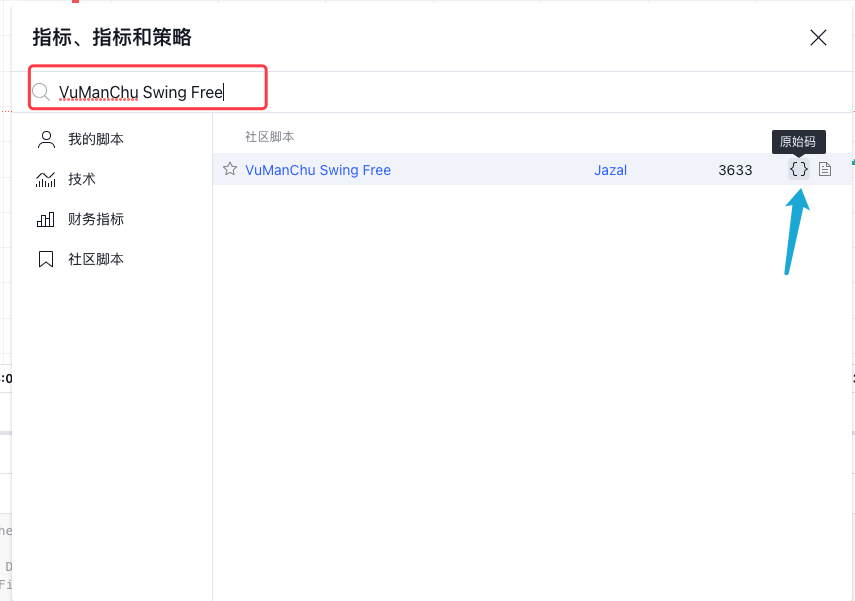
VuManChu Swing Free code is:
// This source code is subject to the terms of the Mozilla Public License 2.0 at https://mozilla.org/MPL/2.0/

// Credits to the original Script - Range Filter DonovanWall https://www.tradingview.com/script/lut7sBgG-Range-Filter-DW/
// This version is the old version of the Range Filter with less settings to tinker with

//@version=4
study(title="Range Filter - B&S Signals", shorttitle="RF - B&S Signals", overlay=true)

//-----------------------------------------------------------------------------------------------------------------------------------------------------------------
//Functions
//-----------------------------------------------------------------------------------------------------------------------------------------------------------------

//Range Size Function
rng_size(x, qty, n)=>
//    AC       = Cond_EMA(abs(x - x[1]), 1, n)
    wper      = (n*2) - 1
    avrng     = ema(abs(x - x[1]), n)
    AC = ema(avrng, wper)*qty
    rng_size = AC

//Range Filter Function
rng_filt(x, rng_, n)=>
    r          = rng_
    var rfilt  = array.new_float(2, x)
    array.set(rfilt, 1, array.get(rfilt, 0))
    if x - r > array.get(rfilt, 1)
        array.set(rfilt, 0, x - r)
    if x + r < array.get(rfilt, 1)
        array.set(rfilt, 0, x + r)
    rng_filt1 = array.get(rfilt, 0)

    hi_band   = rng_filt1 + r
    lo_band   = rng_filt1 - r
    rng_filt  = rng_filt1
    [hi_band, lo_band, rng_filt]

//-----------------------------------------------------------------------------------------------------------------------------------------------------------------
//Inputs
//-----------------------------------------------------------------------------------------------------------------------------------------------------------------

//Range Source
rng_src = input(defval=close, type=input.source, title="Swing Source")

//Range Period
rng_per = input(defval=20, minval=1, title="Swing Period")

//Range Size Inputs
rng_qty   = input(defval=3.5, minval=0.0000001, title="Swing Multiplier")

//Bar Colors
use_barcolor = input(defval=false, type=input.bool, title="Bar Colors On/Off")

//-----------------------------------------------------------------------------------------------------------------------------------------------------------------
//Definitions
//-----------------------------------------------------------------------------------------------------------------------------------------------------------------

//Range Filter Values
[h_band, l_band, filt] = rng_filt(rng_src, rng_size(rng_src, rng_qty, rng_per), rng_per)

//Direction Conditions
var fdir = 0.0
fdir    := filt > filt[1] ? 1 : filt < filt[1] ? -1 : fdir
upward   = fdir==1 ? 1 : 0
downward = fdir==-1 ? 1 : 0

//Trading Condition
longCond = rng_src > filt and rng_src > rng_src[1] and upward > 0 or rng_src > filt and rng_src < rng_src[1] and upward > 0
shortCond = rng_src < filt and rng_src < rng_src[1] and downward > 0 or rng_src < filt and rng_src > rng_src[1] and downward > 0

CondIni = 0
CondIni := longCond ? 1 : shortCond ? -1 : CondIni[1]
longCondition = longCond and CondIni[1] == -1
shortCondition = shortCond and CondIni[1] == 1

//Colors
filt_color = upward ? #05ff9b : downward ? #ff0583 : #cccccc
bar_color  = upward and (rng_src > filt) ? (rng_src > rng_src[1] ? #05ff9b : #00b36b) :
             downward and (rng_src < filt) ? (rng_src < rng_src[1] ? #ff0583 : #b8005d) : #cccccc

//-----------------------------------------------------------------------------------------------------------------------------------------------------------------
//Outputs
//-----------------------------------------------------------------------------------------------------------------------------------------------------------------

//Filter Plot
filt_plot = plot(filt, color=filt_color, transp=67, linewidth=3, title="Filter")

//Band Plots
h_band_plot = plot(h_band, color=color.new(#05ff9b, 100), title="High Band")
l_band_plot = plot(l_band, color=color.new(#ff0583, 100), title="Low Band")

//Band Fills
fill(h_band_plot, filt_plot, color=color.new(#00b36b, 92), title="High Band Fill")
fill(l_band_plot, filt_plot, color=color.new(#b8005d, 92), title="Low Band Fill")

//Bar Color
barcolor(use_barcolor ? bar_color : na)

//Plot Buy and Sell Labels
plotshape(longCondition, title = "Buy Signal", text ="BUY", textcolor = color.white, style=shape.labelup, size = size.normal, location=location.belowbar, color = color.new(color.green, 0))
plotshape(shortCondition, title = "Sell Signal", text ="SELL", textcolor = color.white, style=shape.labeldown, size = size.normal, location=location.abovebar, color = color.new(color.red, 0))

//Alerts
alertcondition(longCondition, title="Buy Alert", message = "BUY")
alertcondition(shortCondition, title="Sell Alert", message = "SELL")
Strategic logic
EMA indicator: The strategy uses two EMA averages, one fast (small cycle parameter) and one slow (large cycle parameter). The role of the double EMA averages is mainly to help us judge the direction of the market trend.
-
Multi-headed The fast line is above the slow line.
-
Blank arrays The fast line is below the slow line.
VuManChu Swing Free indicator: The VuManChu Swing Free indicator is used to send a signal, which is then combined with other conditions to determine whether to place an order. From the VuManChu Swing Free indicator source code, it can be seen: the long condition variable represents the buy signal, the short condition variable represents the sell signal.
Now let's talk about the triggering conditions of the specific trading signals:
1st, the rules for entering multiple heads: The closing price of the K line is above the EMA fast line, the two EMA averages are multi-headed (the fast line is above the slow line), and the VuManChu Swing Free indicator shows a buy signal (long condition is true). Three conditions are met: the K line is the key K line for multiple entries, and the closing price of the K line is the entry position.
2, the rules for entering blank heads (as opposed to plural heads): The closing price of the K line must be below the EMA fast line, the two EMA averages must show a blank line (the fast line is below the slow line), and the VuManChu Swing Free indicator must show a sell signal (the short condition is true). Three conditions are met, the closing price of the K line is to make a blank entry position.
The trading logic is not very simple, since there is no specific explanation of stop loss in the video, the editor is free to play here using a comparison of the middle stop loss method, using fixed point stop loss, track stop loss.
Code design
The code of the VuManChu Swing Free indicator, which we put directly into our strategy code.
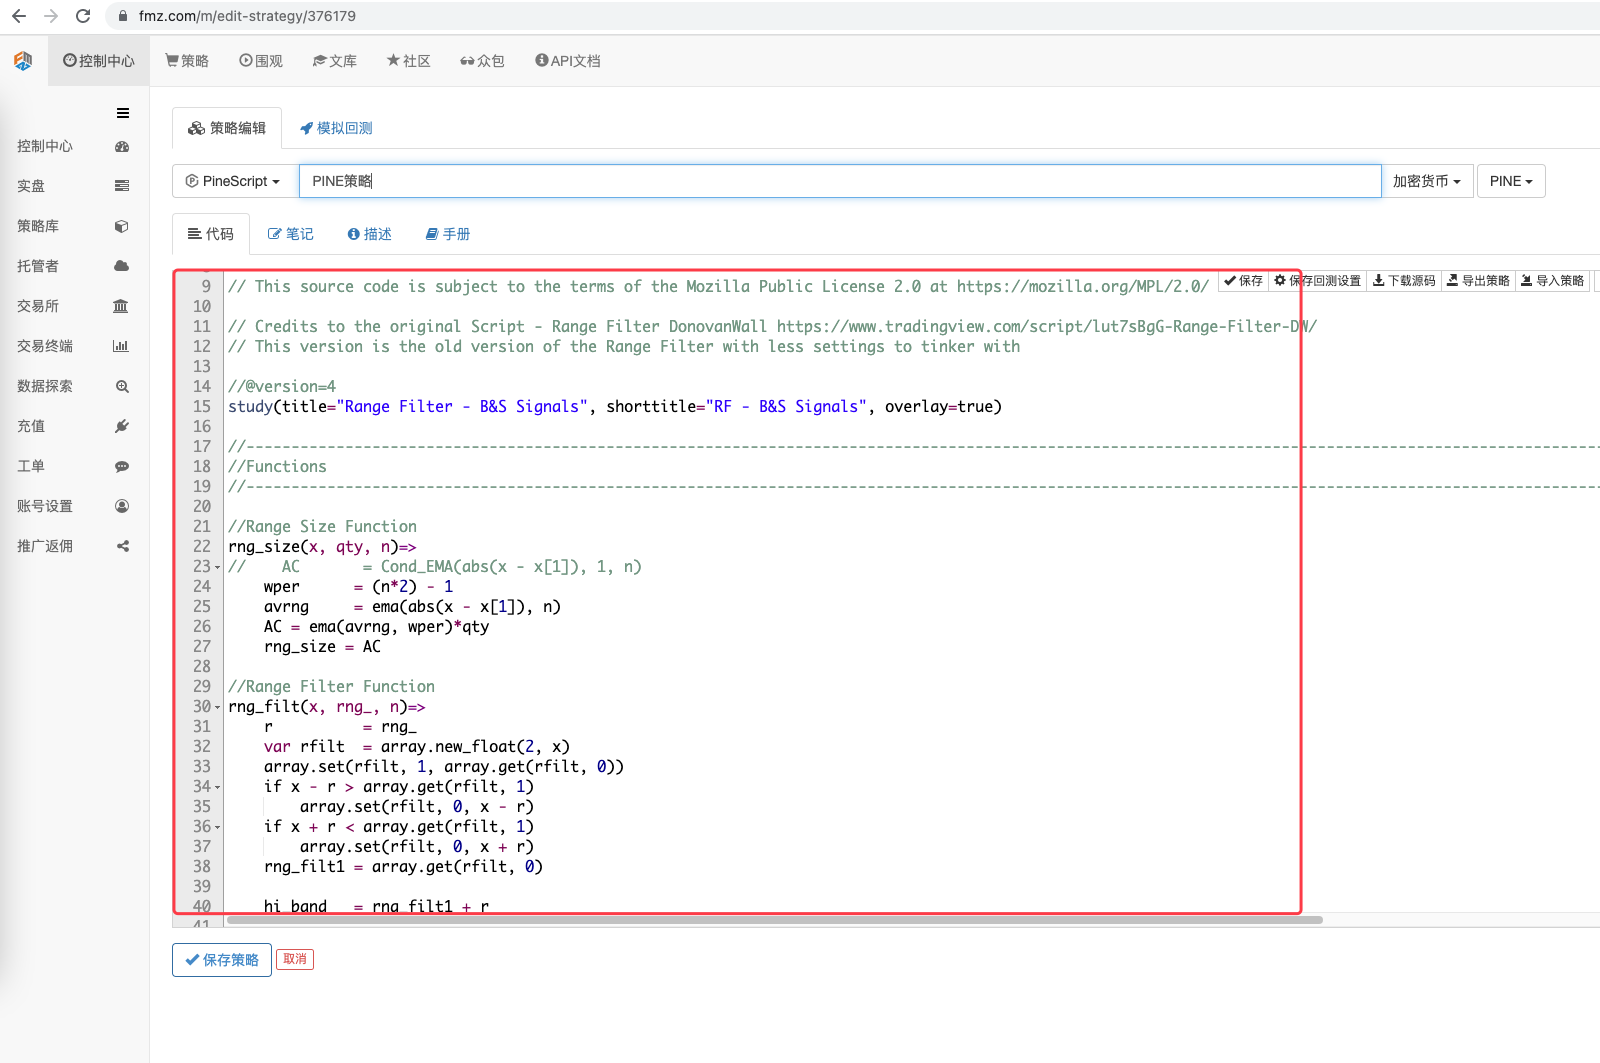
Then we wrote a piece of code in the Pine language to implement the transactional functionality:
// extend
fastEmaPeriod = input(50, "fastEmaPeriod")         // 快线周期
slowEmaPeriod = input(200, "slowEmaPeriod")        // 慢线周期
loss = input(30, "loss")                           // 止损点数
trailPoints = input(30, "trailPoints")             // 移动止盈触发点数
trailOffset = input(30, "trailOffset")             // 移动止盈偏移量(点数)
amount = input(1, "amount")                        // 下单量

emaFast = ta.ema(close, fastEmaPeriod)             // 计算快线EMA
emaSlow = ta.ema(close, slowEmaPeriod)             // 计算慢线EMA

buyCondition = longCondition and emaFast > emaSlow and close > open and close > emaFast         // 做多入场条件
sellCondition = shortCondition and emaFast < emaSlow and close < open and close < emaFast       // 做空入场条件

if buyCondition and strategy.position_size == 0
    strategy.entry("long", strategy.long, amount)
    strategy.exit("exit_long", "long", amount, loss=loss, trail_points=trailPoints, trail_offset=trailOffset)
if sellCondition and strategy.position_size == 0
    strategy.entry("short", strategy.short, amount)
    strategy.exit("exit_short", "short", amount, loss=loss, trail_points=trailPoints, trail_offset=trailOffset)
A.可以看到,当buyCondition为真时即:
1, long Condition variable is true (VuManChu Swing Free indicator gives more signals). 2, emaFast > emaSlow (EMA is arranged in multiple headings) ‖ 3, close > open (indicating the current BAR as the sunline), close > emaFast (indicating the close price above the EMA fast line);
Three more conditions are met.
B.当sellCondition为真时,则做空的三个条件成立(这里不再赘述)。
Then, if the if-condition judgment signal is triggered, use the strategy.entry function to enter the trade and set the strategy.exit function to stop, track and stop.
Full code
/*backtest
start: 2022-01-01 00:00:00
end: 2022-10-08 00:00:00
period: 15m
basePeriod: 5m
exchanges: [{"eid":"Futures_Binance","currency":"ETH_USDT"}]
args: [["ZPrecision",0,358374]]
*/

// This source code is subject to the terms of the Mozilla Public License 2.0 at https://mozilla.org/MPL/2.0/

// Credits to the original Script - Range Filter DonovanWall https://www.tradingview.com/script/lut7sBgG-Range-Filter-DW/
// This version is the old version of the Range Filter with less settings to tinker with

//@version=4
study(title="Range Filter - B&S Signals", shorttitle="RF - B&S Signals", overlay=true)

//-----------------------------------------------------------------------------------------------------------------------------------------------------------------
//Functions
//-----------------------------------------------------------------------------------------------------------------------------------------------------------------

//Range Size Function
rng_size(x, qty, n)=>
//    AC       = Cond_EMA(abs(x - x[1]), 1, n)
    wper      = (n*2) - 1
    avrng     = ema(abs(x - x[1]), n)
    AC = ema(avrng, wper)*qty
    rng_size = AC

//Range Filter Function
rng_filt(x, rng_, n)=>
    r          = rng_
    var rfilt  = array.new_float(2, x)
    array.set(rfilt, 1, array.get(rfilt, 0))
    if x - r > array.get(rfilt, 1)
        array.set(rfilt, 0, x - r)
    if x + r < array.get(rfilt, 1)
        array.set(rfilt, 0, x + r)
    rng_filt1 = array.get(rfilt, 0)

    hi_band   = rng_filt1 + r
    lo_band   = rng_filt1 - r
    rng_filt  = rng_filt1
    [hi_band, lo_band, rng_filt]

//-----------------------------------------------------------------------------------------------------------------------------------------------------------------
//Inputs
//-----------------------------------------------------------------------------------------------------------------------------------------------------------------

//Range Source
rng_src = input(defval=close, type=input.source, title="Swing Source")

//Range Period
rng_per = input(defval=20, minval=1, title="Swing Period")

//Range Size Inputs
rng_qty   = input(defval=3.5, minval=0.0000001, title="Swing Multiplier")

//Bar Colors
use_barcolor = input(defval=false, type=input.bool, title="Bar Colors On/Off")

//-----------------------------------------------------------------------------------------------------------------------------------------------------------------
//Definitions
//-----------------------------------------------------------------------------------------------------------------------------------------------------------------

//Range Filter Values
[h_band, l_band, filt] = rng_filt(rng_src, rng_size(rng_src, rng_qty, rng_per), rng_per)

//Direction Conditions
var fdir = 0.0
fdir    := filt > filt[1] ? 1 : filt < filt[1] ? -1 : fdir
upward   = fdir==1 ? 1 : 0
downward = fdir==-1 ? 1 : 0

//Trading Condition
longCond = rng_src > filt and rng_src > rng_src[1] and upward > 0 or rng_src > filt and rng_src < rng_src[1] and upward > 0
shortCond = rng_src < filt and rng_src < rng_src[1] and downward > 0 or rng_src < filt and rng_src > rng_src[1] and downward > 0

CondIni = 0
CondIni := longCond ? 1 : shortCond ? -1 : CondIni[1]
longCondition = longCond and CondIni[1] == -1
shortCondition = shortCond and CondIni[1] == 1

//Colors
filt_color = upward ? #05ff9b : downward ? #ff0583 : #cccccc
bar_color  = upward and (rng_src > filt) ? (rng_src > rng_src[1] ? #05ff9b : #00b36b) :
             downward and (rng_src < filt) ? (rng_src < rng_src[1] ? #ff0583 : #b8005d) : #cccccc

//-----------------------------------------------------------------------------------------------------------------------------------------------------------------
//Outputs
//-----------------------------------------------------------------------------------------------------------------------------------------------------------------

//Filter Plot
filt_plot = plot(filt, color=filt_color, transp=67, linewidth=3, title="Filter")

//Band Plots
h_band_plot = plot(h_band, color=color.new(#05ff9b, 100), title="High Band")
l_band_plot = plot(l_band, color=color.new(#ff0583, 100), title="Low Band")

//Band Fills
fill(h_band_plot, filt_plot, color=color.new(#00b36b, 92), title="High Band Fill")
fill(l_band_plot, filt_plot, color=color.new(#b8005d, 92), title="Low Band Fill")

//Bar Color
barcolor(use_barcolor ? bar_color : na)

//Plot Buy and Sell Labels
plotshape(longCondition, title = "Buy Signal", text ="BUY", textcolor = color.white, style=shape.labelup, size = size.normal, location=location.belowbar, color = color.new(color.green, 0))
plotshape(shortCondition, title = "Sell Signal", text ="SELL", textcolor = color.white, style=shape.labeldown, size = size.normal, location=location.abovebar, color = color.new(color.red, 0))

//Alerts
alertcondition(longCondition, title="Buy Alert", message = "BUY")
alertcondition(shortCondition, title="Sell Alert", message = "SELL")


// extend
fastEmaPeriod = input(50, "fastEmaPeriod")
slowEmaPeriod = input(200, "slowEmaPeriod")
loss = input(30, "loss")
trailPoints = input(30, "trailPoints")
trailOffset = input(30, "trailOffset")
amount = input(1, "amount")

emaFast = ta.ema(close, fastEmaPeriod)
emaSlow = ta.ema(close, slowEmaPeriod)

buyCondition = longCondition and emaFast > emaSlow and close > open and close > emaFast
sellCondition = shortCondition and emaFast < emaSlow and close < open and close < emaFast

if buyCondition and strategy.position_size == 0
    strategy.entry("long", strategy.long, amount)
    strategy.exit("exit_long", "long", amount, loss=loss, trail_points=trailPoints, trail_offset=trailOffset)
if sellCondition and strategy.position_size == 0
    strategy.entry("short", strategy.short, amount)
    strategy.exit("exit_short", "short", amount, loss=loss, trail_points=trailPoints, trail_offset=trailOffset)
Re-tested
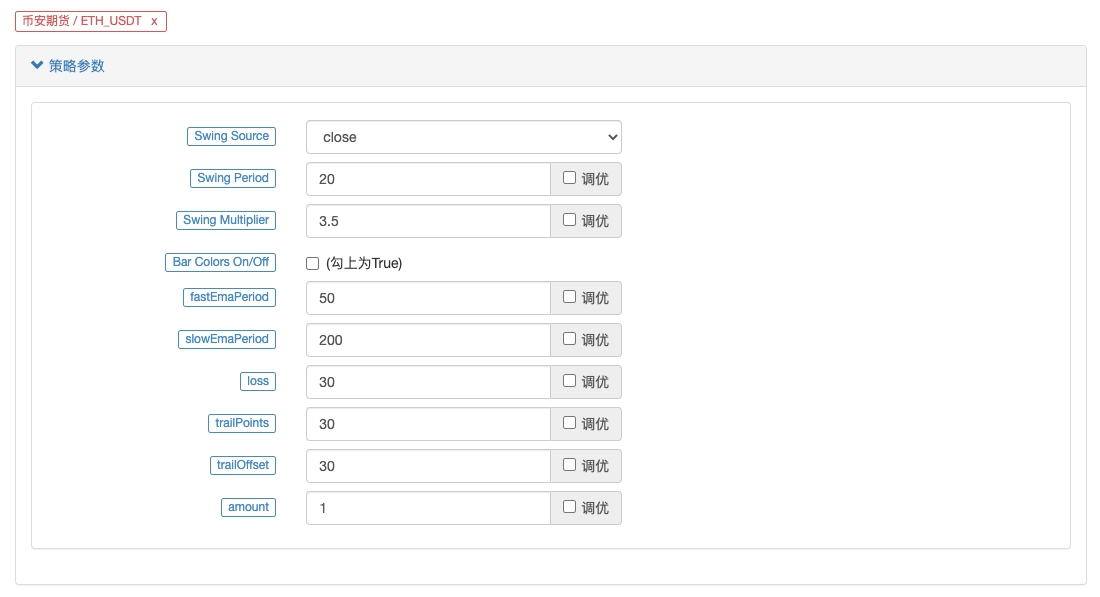
Reverse test time range selected from January 2022 to October 2022, K-line cycle 15 minutes, using closing price model reverse; market selection of Binance's ETH_USDT perpetual contract; parameter set according to the fast line 50 cycles, slow line 200 cycles, other parameters do not change by default; stop loss, tracking stop threshold number I subjectively set one point, 30 points.
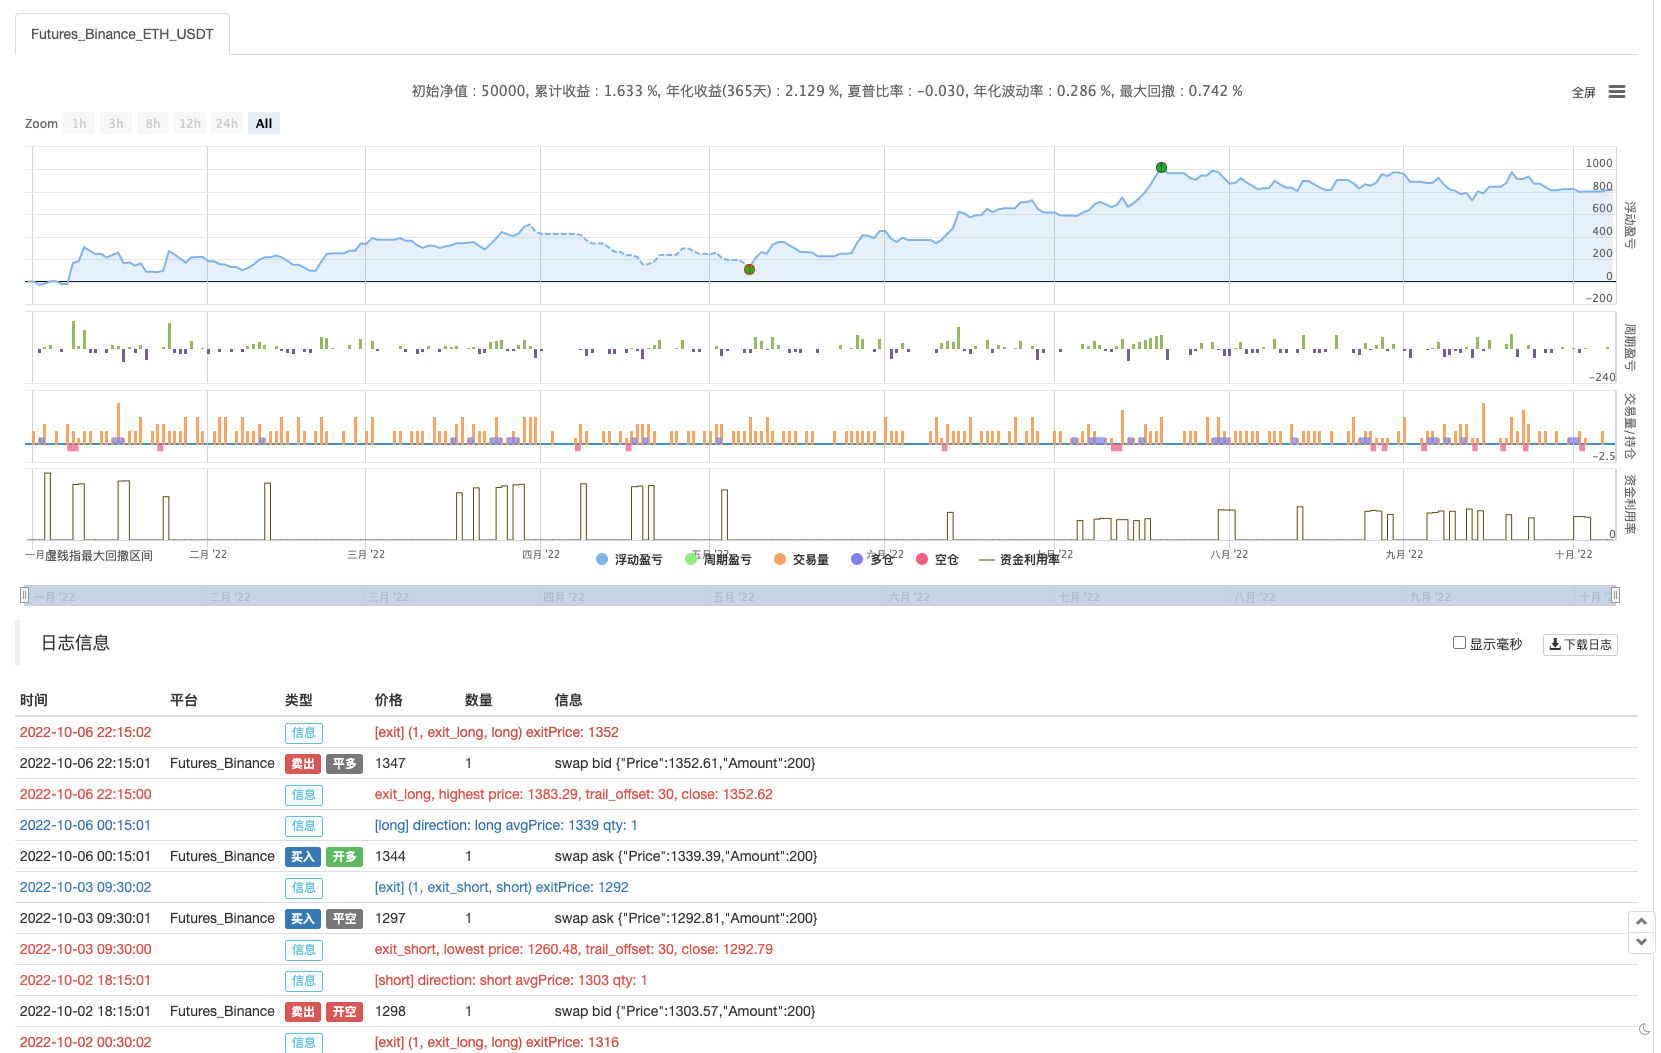
The results of the retesting of Ma Ma Ma Ma Ma Ma Ma Ma Ma Ma Ma Ma Ma Ma Ma Ma Ma Ma Ma Ma Ma Ma Ma Ma Ma Ma Ma Ma Ma Ma Ma Ma Ma Ma Ma Ma Ma Ma Ma Ma Ma Ma Ma Ma Ma Ma Ma Ma Ma Ma Ma Ma Ma Ma Ma Ma Ma Ma Ma Ma Ma Ma Ma Ma Ma Ma Ma Ma Ma Ma Ma Ma Ma Ma Ma Ma Ma Ma Ma Ma Ma Ma Ma Ma Ma Ma Ma Ma Ma Ma Ma Ma Ma Ma Ma Ma Ma Ma Ma Ma Ma Ma Ma Ma Ma Ma Ma Ma Ma Ma Ma Ma Ma Ma Ma Ma Ma Ma Ma Ma Ma Ma Ma Ma Ma Ma Ma Ma Ma Ma Ma Ma Ma Ma Ma Ma Ma Ma Ma Ma Ma Ma Ma Ma Ma Ma Ma Ma Ma Ma Ma Ma Ma Ma Ma Ma Ma Ma Ma Ma Ma Ma Ma Ma Ma Ma Ma Ma Ma Ma Ma Ma Ma Ma Ma Ma Ma Ma Ma Ma Ma Ma Ma Ma Ma Ma Ma Ma Ma Ma Ma Ma Ma Ma Ma Ma Ma Ma Ma Ma Ma Ma Ma Ma Ma Ma Ma Ma Ma Ma Ma Ma Ma Ma Ma Ma Ma Ma Ma Ma Ma Ma Ma Ma Ma Ma Ma Ma Ma Ma Ma Ma Ma Ma Ma Ma Ma Ma Ma Ma Ma Ma Ma Ma Ma Ma Ma
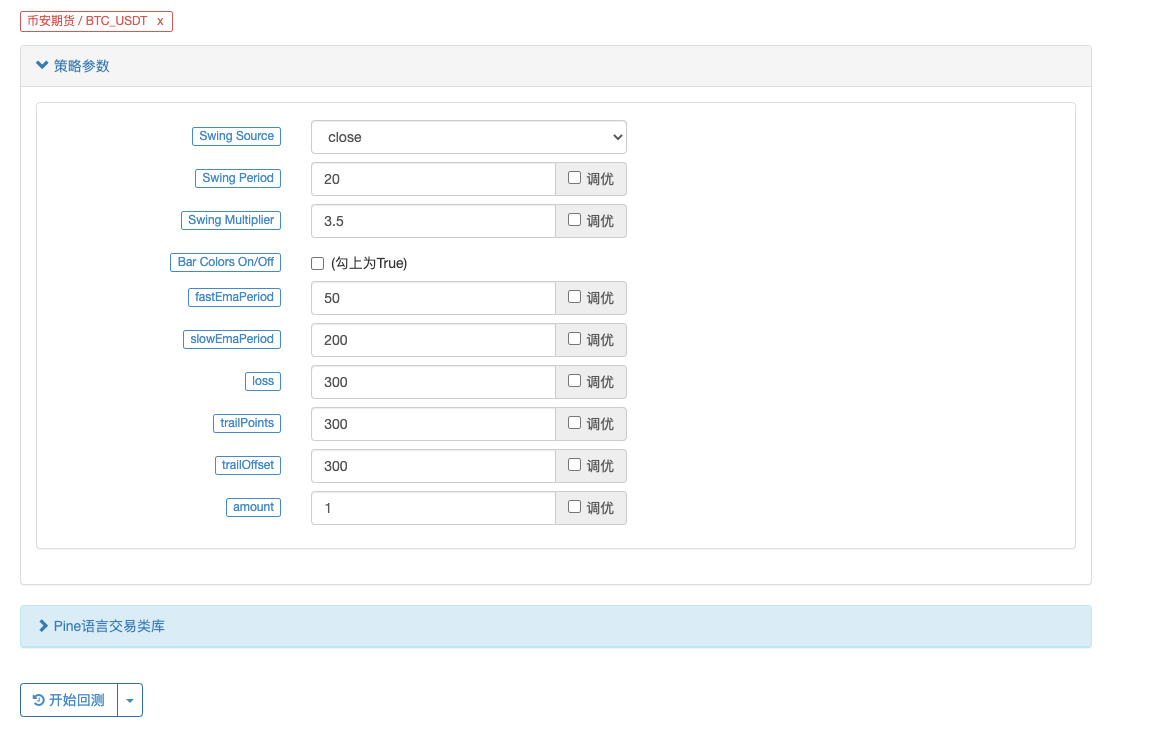
Let's try a BTC_USDT perpetual contract:
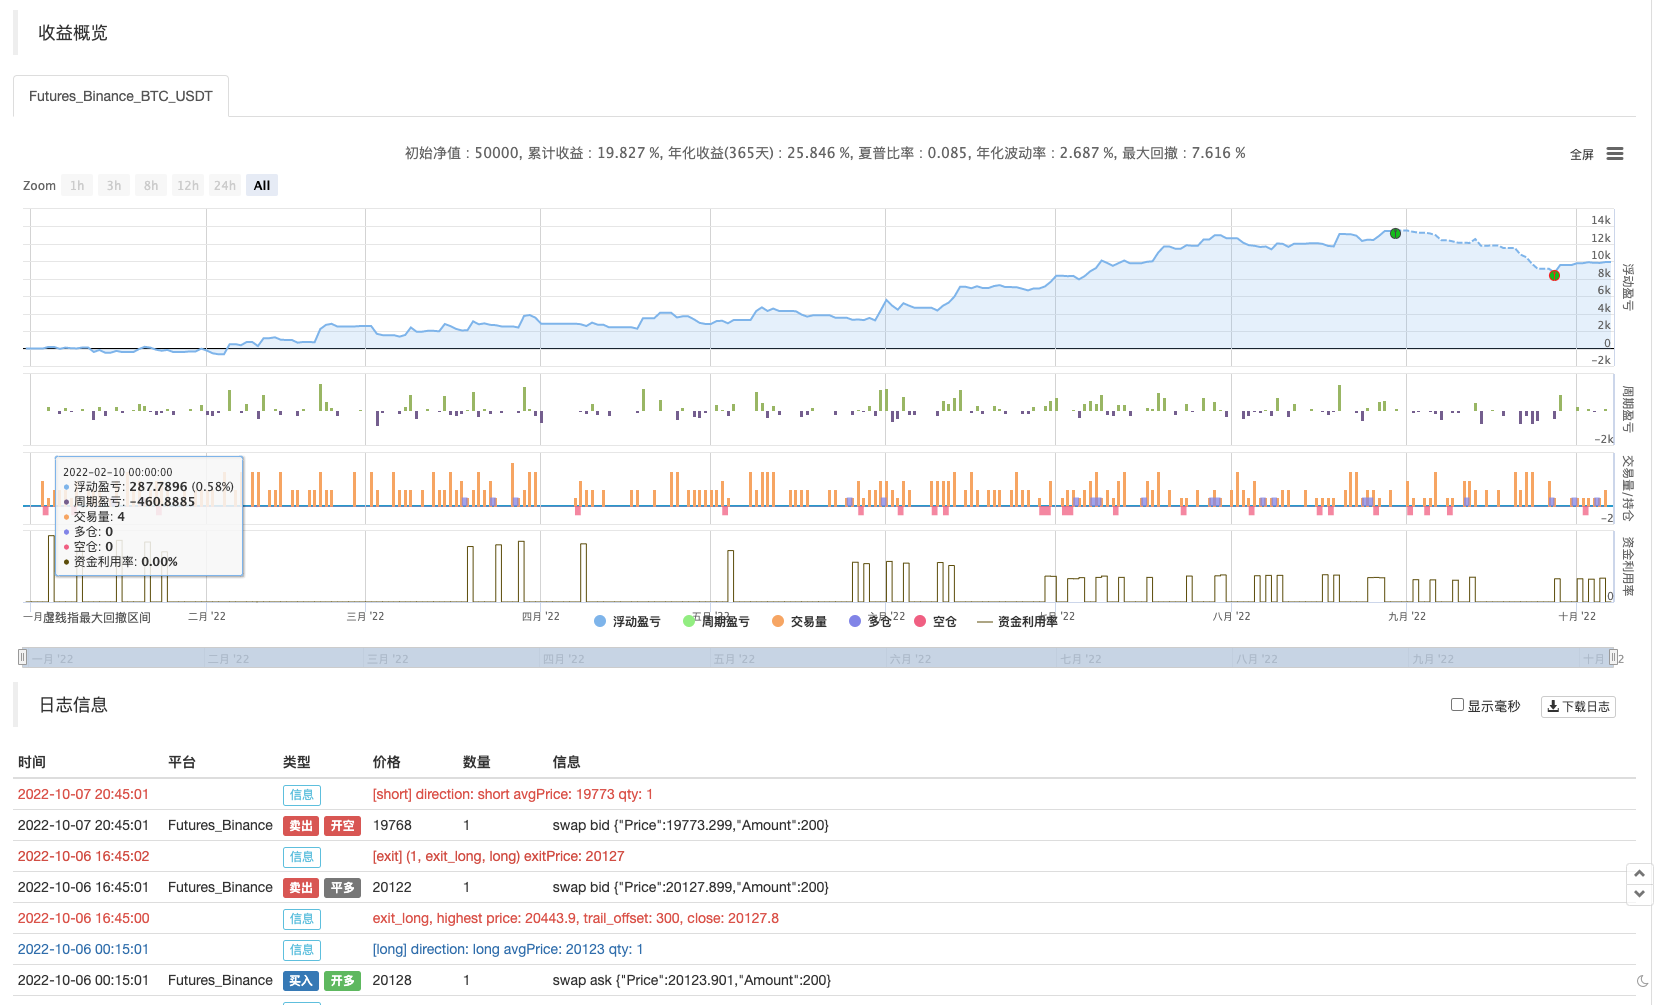
The results in BTC also exploded:

The policy address:https://www.fmz.com/strategy/385745
It seems that this trading method is still more reliable for picking up trends, and can continue to optimize the design based on this idea. In this article, we not only understand the idea of a double-slit strategy, but also learn how to process and learn the strategy of the great god of the oil pipeline. OK, the above strategy code is only a small number.
- DEX exchange quantitative practice ((1) -- dYdX v4 user guide
- Introduction to the Lead-Lag suite in digital currency (3)
- Introduction to Lead-Lag Arbitrage in Cryptocurrency (2)
- Introduction to the Lead-Lag suite in the digital currency (2)
- Discussion on External Signal Reception of FMZ Platform: A Complete Solution for Receiving Signals with Built-in Http Service in Strategy
- Discussing FMZ platform external signal reception: a complete set of strategies for the reception of signals from built-in HTTP services
- Introduction to Lead-Lag Arbitrage in Cryptocurrency (1)
- Introduction to the Lead-Lag suite in digital currency (1)
- Discussion on External Signal Reception of FMZ Platform: Extended API VS Strategy Built-in HTTP Service
- External signal reception on FMZ platforms: extended API vs. built-in HTTP services
- Discussion on Strategy Testing Method Based on Random Ticker Generator
- LeeksReaper Strategy Analysis (2)
- The "Magic Double EMA Strategy" from the YouTube Veterans
- JavaScript language implementation of Fisher indicators and drawing on FMZ
- Example of dYdX strategy design
- Design of Order Synchronization Management System Based on FMZ Quant (1)
- LeeksReaper Strategy Analysis(1)
- Deribit Options Delta Dynamic Hedging Strategy
- Recent Status and Recommended Operation of Funding Rate Strategy
- Review of Digital Currency Market in 2021 and the Simplest 10 times Strategy Missed
- Digital Currency Factor Model
- Writing a semi-automated trading tool using Pine language
- Factor model of digital currency
- Be your own savior in the deal
- Hedging strategy of cryptocurrency manual futures and spots
- Cryptocurrency spot hedging strategy design(1)
- A perpetual balance strategy suitable for bear market bottoming
- Cryptocurrency Quantitative Trading for Beginners - Taking You Closer to Cryptocurrency Quantitative (8)
- Cryptocurrency Quantitative Trading for Beginners - Taking You Closer to Cryptocurrency Quantitative (7)
- Cryptocurrency Quantitative Trading for Beginners - Taking You Closer to Cryptocurrency Quantitative (6)
- Overview and architecture of the main interface of FMZ Quant Trading Platform
The ice cream dollIn the meantime, I'm going to try to get back to you, and I'm not going to tell you what happened after January 3, 2022.
fantadongCould this strategy also be a particle?
hyc1743Dream Big, why does the icon show the signal but the real one doesn't? I've been trying to get a hold of you for a while. I'm going to go ahead and do it. I've been trying to get a hold of you for a while.
Light cloudsIn this article, I'm suggesting that you find two or three representative strategies from the oil pipeline, which are more difficult to rewrite, functions, parameters, and more methods of operation. Do a few text versions of the tutorial, such as with a similar line.delete line............................................................................................................................................................................................... I have now learned to change some not very complicated combination strategies with this double-slit strategy, I have changed a dozen combination strategies, one or two of which are really very good data retrieval results in 21-22 years, and have been tested on the run disk, but I encountered complex function parameter operations such as this: line: 62 Could not find function or function reference 'line.delete', but in the FMZ PINE Script documentation did not find the related explanation, the methodology, the loop, so I hope that the kid can get a little bit more complicated strategy to write it down, of course the commentary is also some better. Thank you very much.
What is it?Time Selection 21 April - October, BTC is worse than it used to be
yingjunIf you look at the documentation and you don't understand what this stop loss means, can you explain it? For example, the default 30 means that the BTC has fallen by 30 cents?
Light cloudsCan you please tell me if PINE can write a more complicated anti-anxiety regimen, like a hierarchical anti-anxiety regimen? If PINE can be combined with JS, it is easier to write indicators in PINE and the transaction part in JS.
yingjunReal-time will have a bug in 2022
fmzeroThe save policy suggests this is a joke. REST: sql: no rows in result set
fmzeroThe dream is to be a bully
Inventors quantify - small dreamsWell, here's a test to see.
The ice cream dollYes /upload/asset/101a198b65be7e8fe8487.png I'm not sure what you mean.
Inventors quantify - small dreamsI'm not sure if you're talking about this tactic.
Inventors quantify - small dreamsHa-ha, the trend strategy itself is to say that the market is trending in the future, otherwise it's a shock strategy.
Inventors quantify - small dreamsI'm not being polite.
hyc1743Thank you Dreama.
Inventors quantify - small dreamsHello, this is because the BUY sign shown on the chart is just a sign of the indicator in the article, with a straight line behind it. What's up? //Plot Buy and Sell Labels plotshape ((longCondition, title = "Buy Signal", text ="BUY", textcolor = color.white, style=shape.labelup, size = size.normal, location=location.belowbar, color = color.new(color.green, 0)) plotshape ((shortCondition, title = "Sell Signal", text ="SELL", textcolor = color.white, style=shape.labeldown, size = size.normal, location=location.abovebar, color = color.new(color.red, 0)) What's up? plotshape ((longCondition, title = "Buy Signal", text ="BUY The graph shows that only the longCondition condition is met. The following conditions are in this section: What's up? if buyCondition and strategy.position_size == 0 This is a list of all the different ways Strategy.entry is credited in the database. This is a list of all the different ways Exit.exit is credited in the database. if sellCondition and strategy.position_size == 0 This is a list of all the different ways Strategy.entry is credited in the database. This is a list of all the different ways Exit.exit is credited in the database. What's up?
Light cloudsNo wonder, I understand, thank you.
Inventors quantify - small dreamsline This object is not currently supported on FMZ, so some lines may not be able to be changed. Some policies use this object to participate in computations.
Inventors quantify - small dreamsIt's probably because the retesting time is too long and the data is too much.
Inventors quantify - small dreamsThere are chapters and descriptions in the Pine language tutorial, which you can find here: https://www.fmz.com/bbs-topic/9390#%E5%B8%A6%E8%B7%9F%E8%B8%AA%E6%AD%A2%E6%8D%9F%E6%AD%A2%E7%9B%88%E7%9A%84%E8%B6%85%E7%BA%A7%E8%B6%8B%E5%8A%BF%E7%AD%96%E7%95%A5
Light cloudsWell, I set it to a year or 10 months and basically it's done, and after a year I'll have this tip or a bunch of others.
Inventors quantify - small dreamsThere is no limit, this error should be too large a retest time range.
Light cloudsOK, thank you, and also, please, is there a time limit for the PINE review? I chose January 1, 2021, to October 11, 2022, and the error is:
RunError: abort(undefined) at Error at StackTrace (eval at self.onmessage (https://www.fmz.com/scripts/worker_detours.393054f7.js:1:147),
Inventors quantify - small dreamsPine should be able to design a more sophisticated stop-gap, which is not currently available in embedded JS code.
Inventors quantify - small dreamsYou can send a screenshot to see the specific error report.
Inventors quantify - small dreamsOh, I'm sorry, the policy address was misplaced, it's been changed.