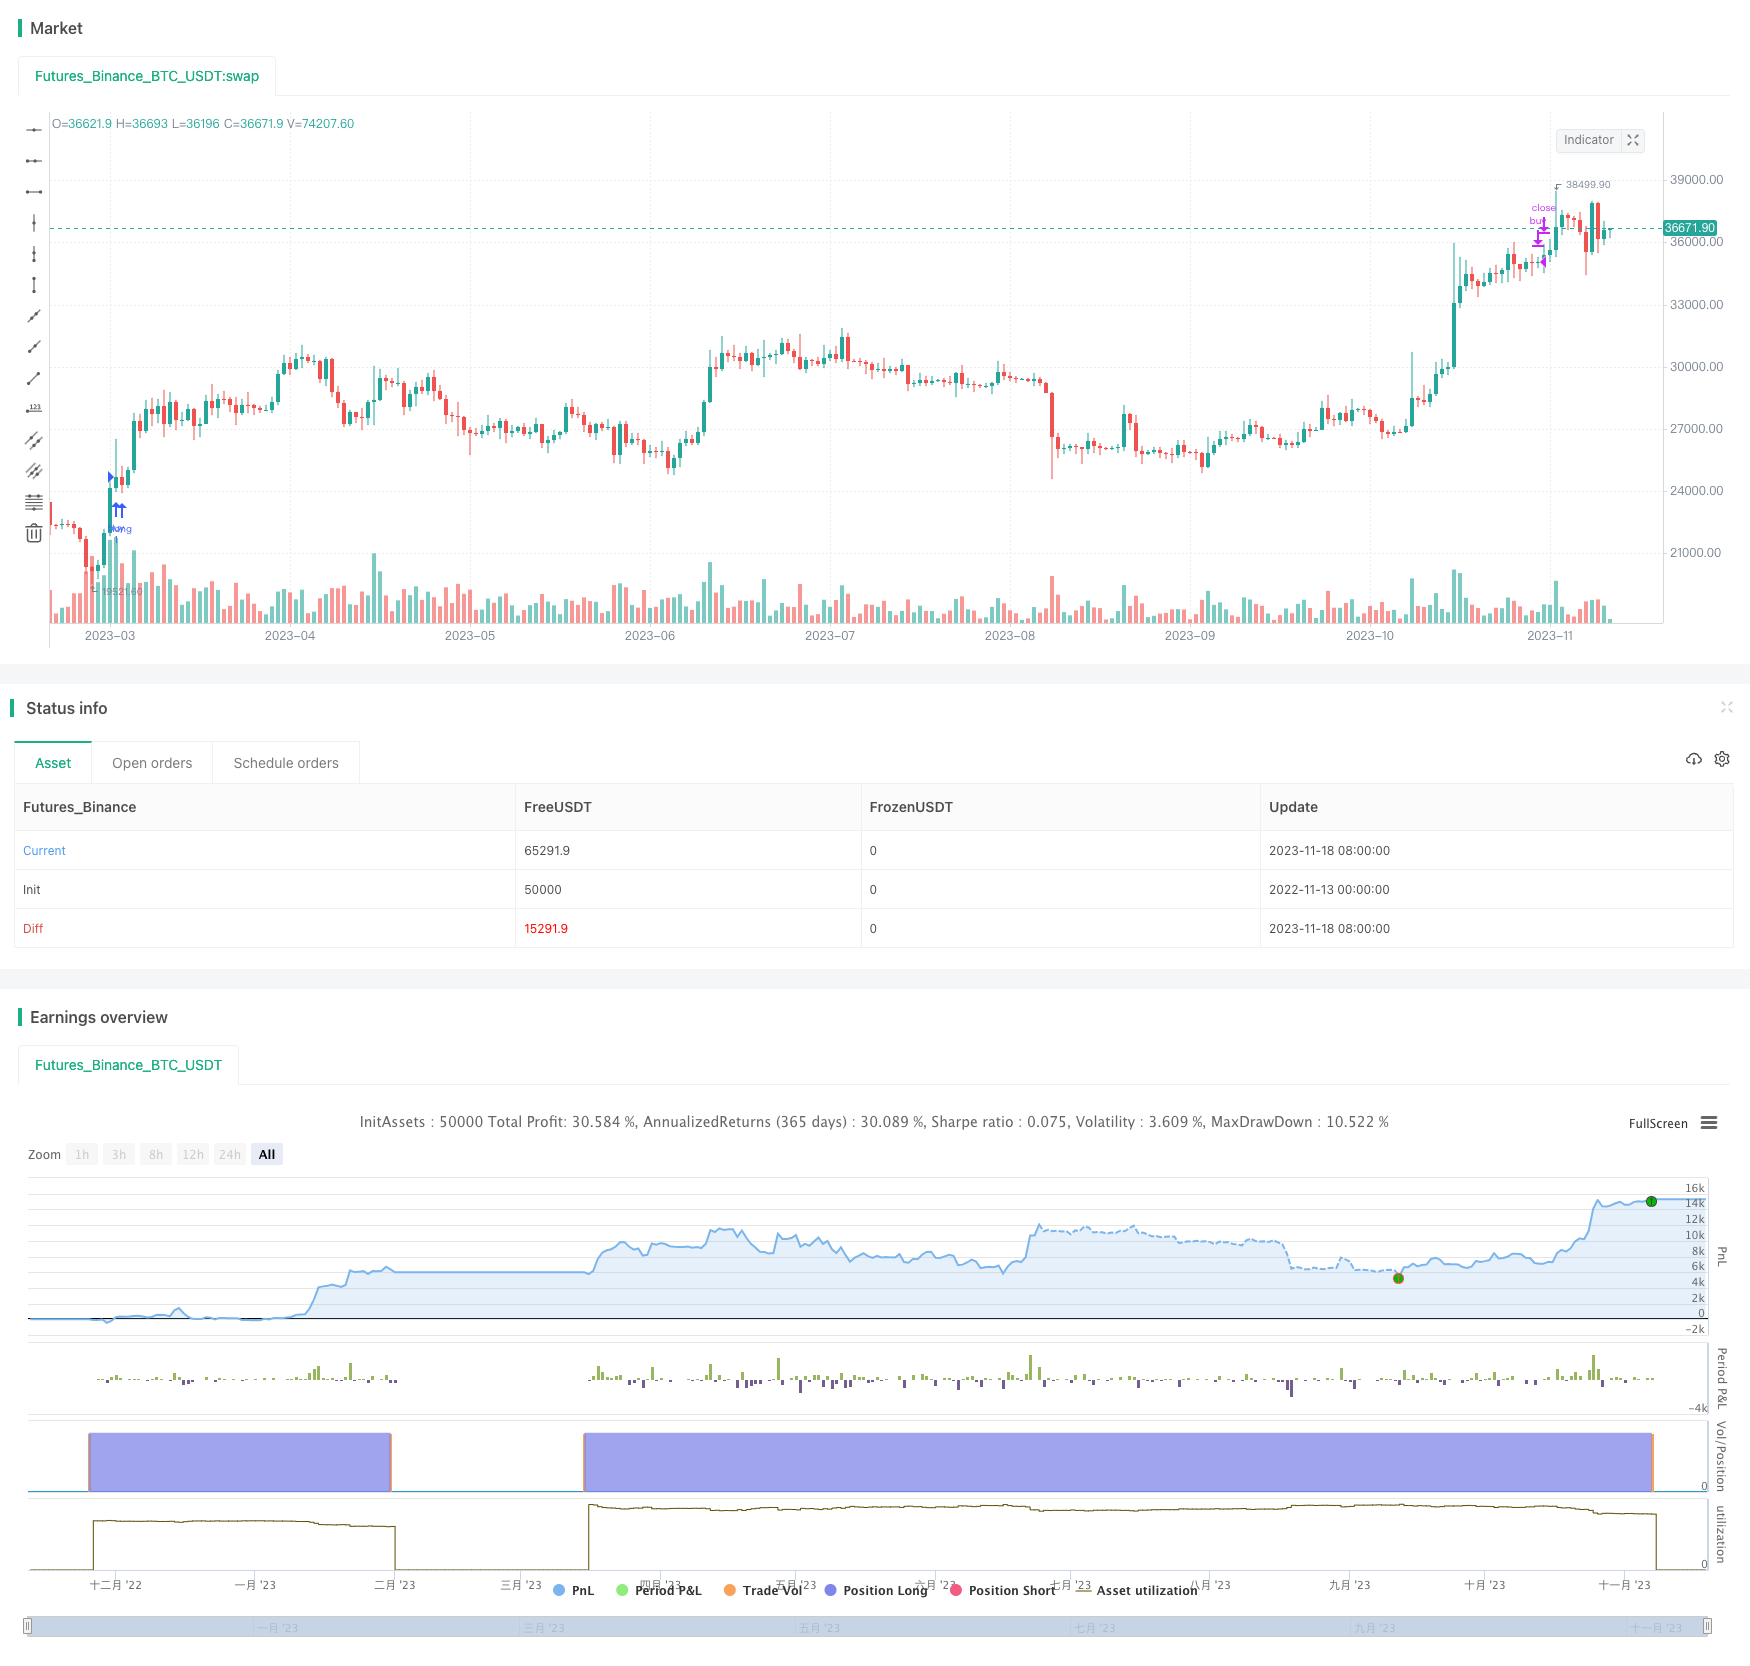
Overview
This strategy combines the Moving Average Convergence Divergence (MACD) indicator and the Relative Strength Index (RSI) indicator to set buy and sell conditions for catching reversal opportunities.
Strategy Logic
Calculate the MACD indicator, including the fast line, slow line and signal line. Crossovers between the fast line and slow line are trading signals.
Calculate the RSI indicator and set overbought and oversold threshold values. The RSI indicator can determine overbought and oversold conditions.
Combine the crossover signals from the MACD and the overbought/oversold readings from the RSI to formulate the buy and sell conditions:
Buy condition: The MACD fast line crosses above the slow line (golden cross) while the RSI indicator just fell back from the overbought zone, signaling a reversal.
Sell condition: The MACD fast line crosses below the slow line (death cross) while the RSI indicator enters the overbought zone, signaling a reversal.
This allows utilizing the strengths of both powerful indicators to accurately buy and sell at reversal points.
Advantage Analysis
MACD can identify trends and trading opportunities. RSI gauges overbought/oversold conditions. Using both improves accuracy.
Using two indicators filters out false signals that can occur with a single indicator.
MACD combined with RSI allows buying before reversals and selling after reversals to capture turns.
The strategy has a moderate frequency, tracking trends and catching reversals flexibly.
Risk Analysis
MACD can give false signals in choppy markets. RSI parameters need optimization to avoid false signals.
Short-term volatility may stop out positions, causing losses.
RSI and MACD parameters need optimization to avoid too many or too few signals.
Strict risk and money management are crucial for live trading.
Optimization Directions
Optimize MACD fast/slow line parameters for best combinations.
Optimize RSI overbought/oversold thresholds to prevent false signals.
Add a stop loss to control single trade risk.
Consider adding filters like Bollinger Bands or KDJ for extra confirmation.
Test various entry/exit strategies like breakouts or trend following.
Summary
This strategy combines the strengths of MACD and RSI for reversals. But parameter tuning, risk control and money management are key for live performance. The flexibility makes it suitable for different market conditions and worth live testing and tracking.
/*backtest
start: 2022-11-13 00:00:00
end: 2023-11-19 00:00:00
period: 1d
basePeriod: 1h
exchanges: [{"eid":"Futures_Binance","currency":"BTC_USDT"}]
*/

//@version=5
// © sabirt
strategy(title='MACD and RSI', overlay=true, shorttitle='MACD&RSI')
//MACD Settings
fastMA = input.int(title='Fast moving average', defval=12, minval=1)
slowMA = input.int(title='Slow moving average', defval=26, minval=1)
signalLength = input.int(9, minval=1)

//RSI settings
RSIOverSold = input.int(35, minval=1)
RSIOverBought = input.int(80, minval=1)
src = close
len = input.int(14, minval=1, title='Length')
up = ta.rma(math.max(ta.change(src), 0), len)
down = ta.rma(-math.min(ta.change(src), 0), len)
rsi = down == 0 ? 100 : up == 0 ? 0 : 100 - 100 / (1 + up / down)
wasOversold = rsi[0] <= RSIOverSold or rsi[1] <= RSIOverSold or rsi[2] <= RSIOverSold or rsi[3] <= RSIOverSold or rsi[4] <= RSIOverSold or rsi[5] <= RSIOverSold
wasOverbought = rsi[0] >= RSIOverBought or rsi[1] >= RSIOverBought or rsi[2] >= RSIOverBought or rsi[3] >= RSIOverBought or rsi[4] >= RSIOverBought or rsi[5] >= RSIOverBought


[currMacd, _, _] = ta.macd(close[0], fastMA, slowMA, signalLength)
[prevMacd, _, _] = ta.macd(close[1], fastMA, slowMA, signalLength)
signal = ta.ema(currMacd, signalLength)

avg_1 = math.avg(currMacd, signal)
crossoverBear = ta.cross(currMacd, signal) and currMacd < signal ? avg_1 : na
avg_2 = math.avg(currMacd, signal)
crossoverBull = ta.cross(currMacd, signal) and currMacd > signal ? avg_2 : na

strategy.entry('buy', strategy.long, when=crossoverBull and wasOversold)
strategy.close('buy', when=crossoverBear and wasOverbought)