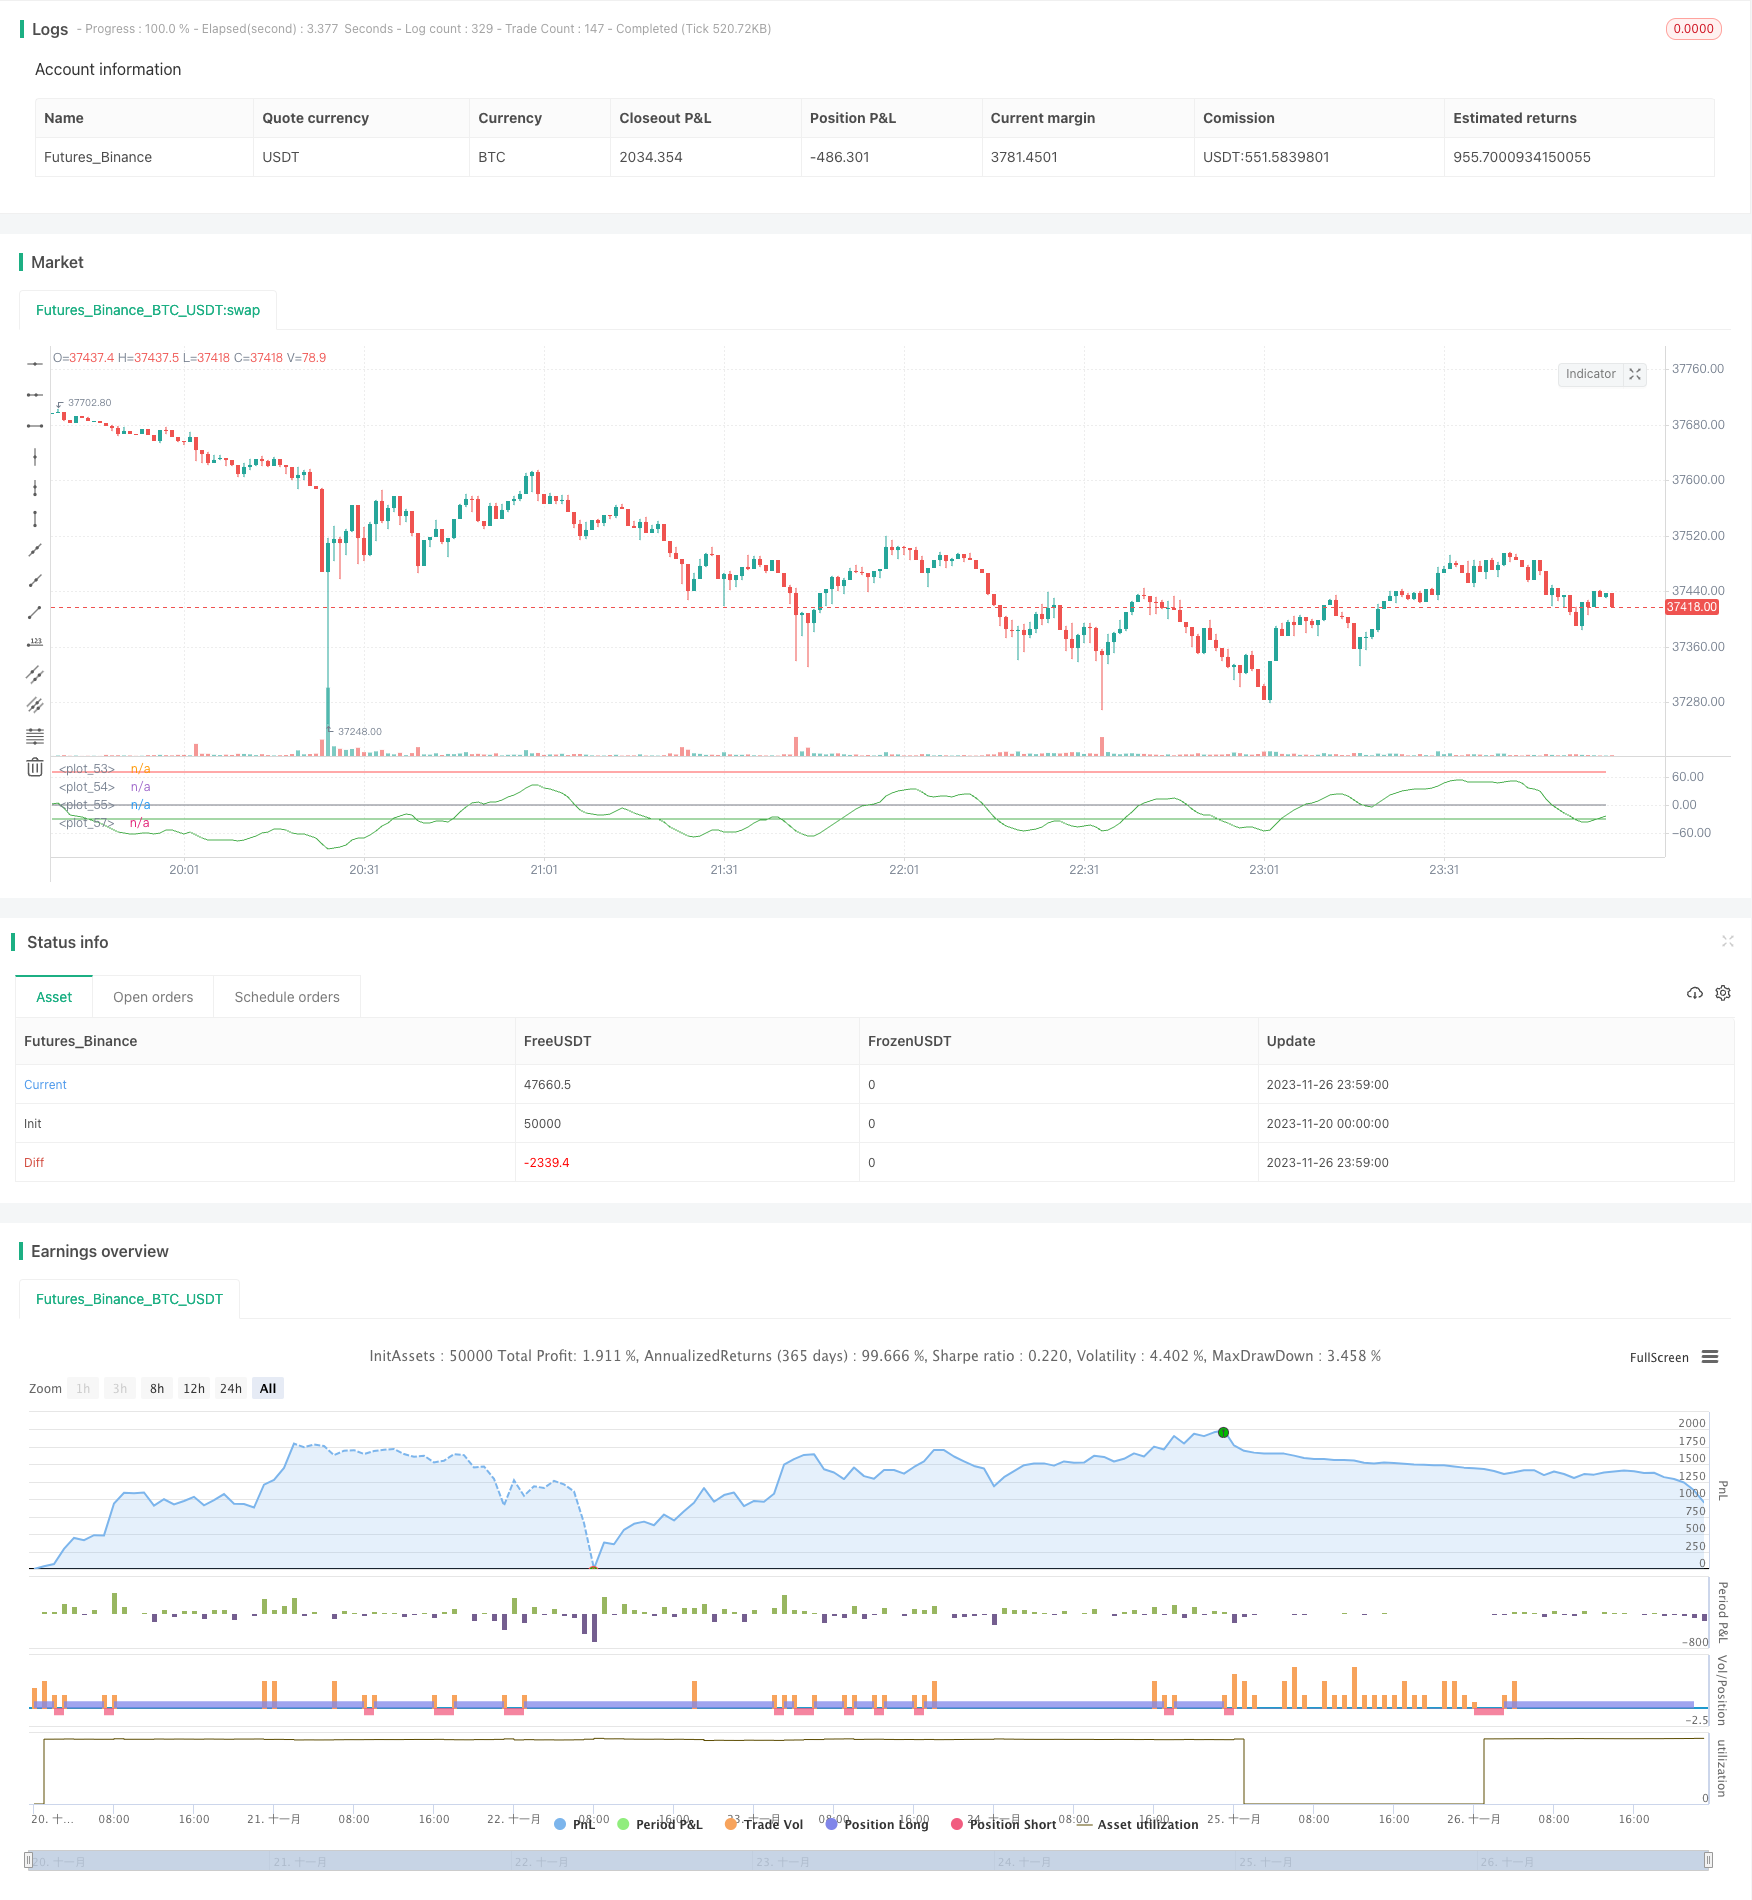
Wave Trend Based Quantitative Trading Strategy
Author: ChaoZhang, Date: 2023-11-28 16:17:31Tags:

Overview
This strategy is designed based on the Wave Trend indicator. The Wave Trend indicator combines price channel and moving average to effectively identify market trends and generate trading signals. This strategy enters long or short positions when the Wave Trend line crosses over key levels representing overbought or oversold status.
Strategy Logic
- Calculate the triangular moving average ap of price, as well as the exponential moving average esa of ap.
- Calculate the exponential moving average d of absolute difference between ap and esa.
- Derive the volatility indicator ci.
- Compute the n2 period moving average of ci to get the Wave Trend indicator wt1.
- Set overbought and oversold threshold lines.
- Go long when wt1 crosses above oversold line, go short when wt1 crosses below overbought line.
Advantage Analysis
- Wave Trend breaks of overbought/oversold levels effectively catch trend reversal points and generate accurate trading signals.
- Combining price channel and moving average theories, the indicator avoids frequent false signals.
- Applicable to all timeframes and variety of trading instruments.
- Customizable parameters provide good user experience.
Risks and Solutions
- Significant whipsaws can cause bad signals, high risk. Can use shorter holding periods or combine with other indicators for signal filtering.
- No position sizing and stop loss mechanisms, risks of losses. Can set fixed position size rules and moving stops.
Optimization Directions
- Consider combining with other indicators like KDJ and MACD to form strategy combos, enhancing stability.
- Design automatic stop loss like trailing stops, volatility stops to limit per trade loss.
- Utilize machine learning algorithms on historical data to auto tune parameters and improve strategy performance.
Conclusion
This strategy identifies trends and overbought/oversold levels using Wave Trend indicator, forming an effective trend following strategy. Compared to short-term oscillators, Wave Trend avoids false signals and provides better stability. With proper risk control methods, it can achieve steady profits. Further performance boost can be expected from parameters and model tuning.
/*backtest
start: 2023-11-20 00:00:00
end: 2023-11-27 00:00:00
period: 1m
basePeriod: 1m
exchanges: [{"eid":"Futures_Binance","currency":"BTC_USDT"}]
*/


//@author SoftKill21
//@version=4

strategy(title="WaveTrend strat", shorttitle="WaveTrend strategy")
n1 = input(10, "Channel Length")
n2 = input(21, "Average Length")
Overbought = input(70, "Over Bought")
Oversold = input(-30, "Over Sold ")

// BACKTESTING RANGE

// From Date Inputs
fromDay = input(defval = 1, title = "From Day", minval = 1, maxval = 31)
fromMonth = input(defval = 1, title = "From Month", minval = 1, maxval = 12)
fromYear = input(defval = 2001, title = "From Year", minval = 1970)

// To Date Inputs
toDay = input(defval = 1, title = "To Day", minval = 1, maxval = 31)
toMonth = input(defval = 12, title = "To Month", minval = 1, maxval = 12)
toYear = input(defval = 2020, title = "To Year", minval = 1970)

// Calculate start/end date and time condition
DST = 1 //day light saving for usa
//--- Europe
London = iff(DST==0,"0000-0900","0100-1000")
//--- America
NewYork = iff(DST==0,"0400-1500","0500-1600")
//--- Pacific
Sydney = iff(DST==0,"1300-2200","1400-2300")
//--- Asia
Tokyo = iff(DST==0,"1500-2400","1600-0100")

//-- Time In Range
timeinrange(res, sess) => time(res, sess) != 0

london = timeinrange(timeframe.period, London)
newyork = timeinrange(timeframe.period, NewYork)

startDate = timestamp(fromYear, fromMonth, fromDay, 00, 00)
finishDate = timestamp(toYear, toMonth, toDay, 00, 00)
time_cond = true //and (london or newyork)

ap = hlc3
esa = ema(ap, n1)
d = ema(abs(ap - esa), n1)
ci = (ap - esa) / (0.015 * d)
tci = ema(ci, n2)

wt1 = tci
wt2 = sma(wt1,4)

plot(0, color=color.gray)
plot(Overbought, color=color.red)
plot(Oversold, color=color.green)

plot(wt1, color=color.green)
longButton = input(title="Long", type=input.bool, defval=true)
shortButton = input(title="Short", type=input.bool, defval=true)

if(longButton==true)
    strategy.entry("long",1,when=crossover(wt1,Oversold) and time_cond)
    strategy.close("long",when=crossunder(wt1, Overbought))

if(shortButton==true)
    strategy.entry("short",0,when=crossunder(wt1, Overbought) and time_cond)
    strategy.close("short",when=crossover(wt1,Oversold))

//strategy.close_all(when= not (london or newyork),comment="time")
if(dayofweek == dayofweek.friday)
    strategy.close_all(when= timeinrange(timeframe.period, "1300-1400"), comment="friday")
More
- Dual Entry Position Averaging Trailing Stop Loss Strategy
- RSI Moving Average Crossover Trend Strategy
- Dynamic Support and Resistance Strategy Based on Historical Data
- Noro's Bollinger Tracking Strategy
- EMA Reverse Buy-Sell Strategy
- Harami Closing Price Strategy
- Momentum Trading Strategy Based on CMO and WMA
- P-Signal Multi Timeframe Trading Strategy
- Commodity Momentum Index Strategy
- Double Turtle Breakthrough Strategy
- Ichimoku Kumo Twist Gold-Absorbing Strategy
- Stepped Trailing Stop with Partial Profit Taking Strategy
- TSI and CCI Hull Moving Average Trend Tracking Strategy
- Reverse Engineering RSI Strategy
- Dual CCI Quantitative Strategy
- Dual EMA Crossover Breakout Strategy
- Multi Timeframe MACD Strategy
- Super scalping strategy based on RSI and ATR channels
- Donchian Trend Strategy
- Multi-SMA Moving Average Crossover Strategy