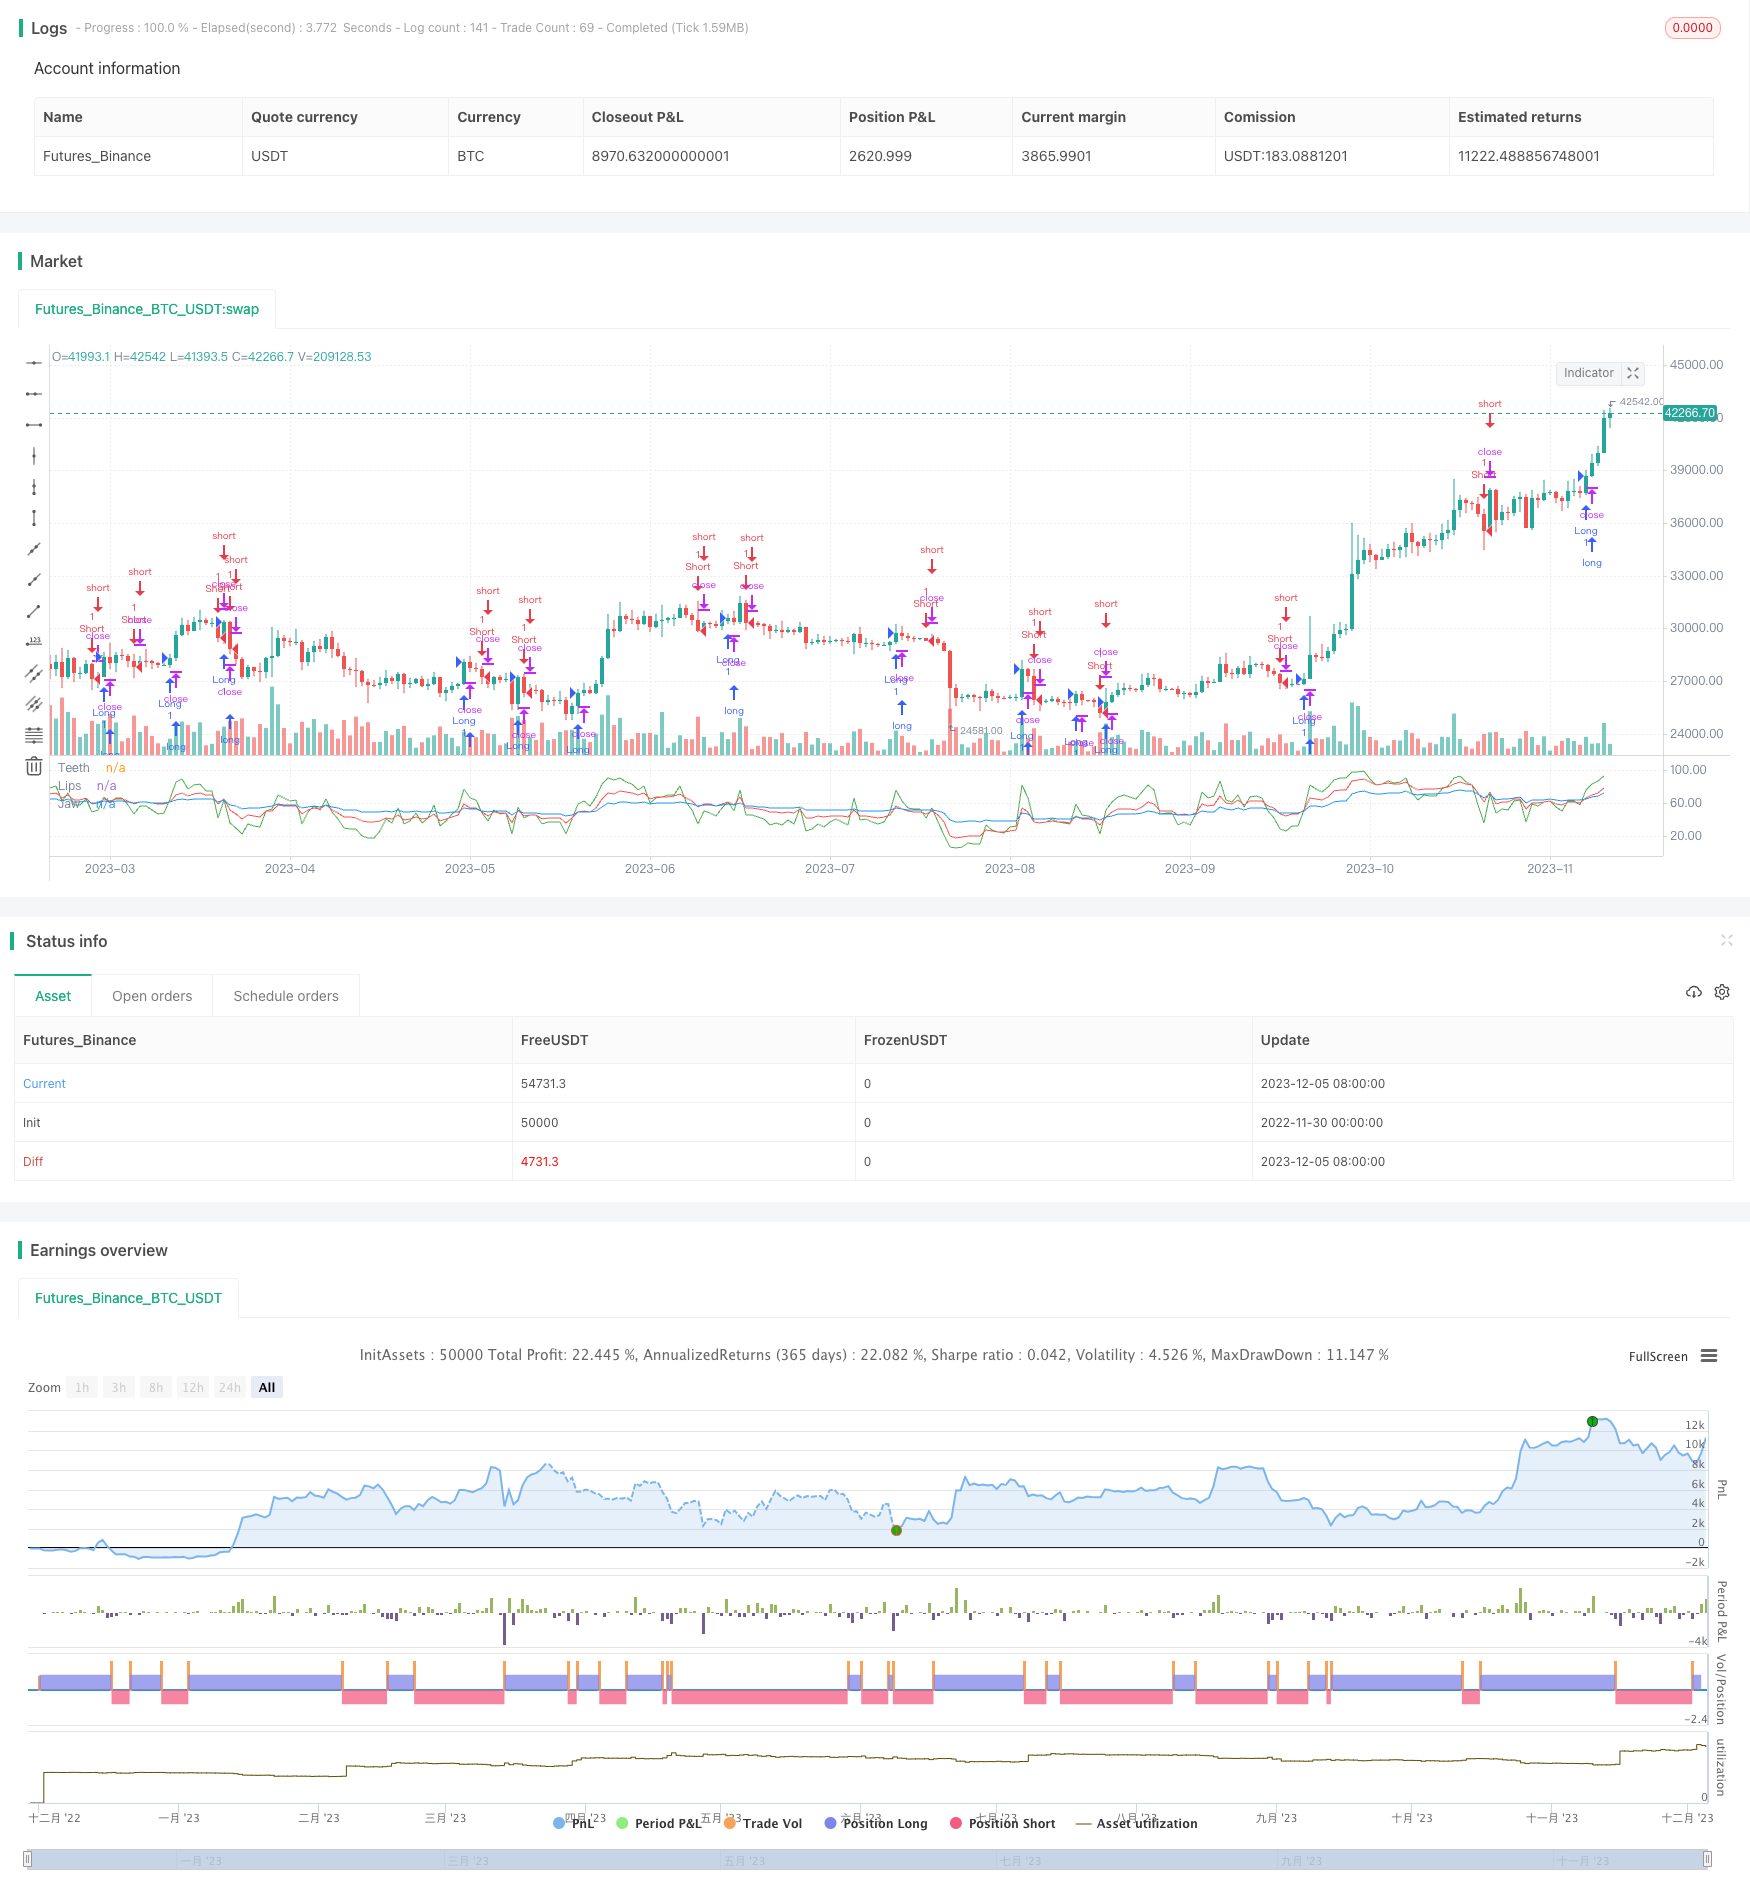
Overview
The Alligator RSI trading strategy is a quantitative trading strategy that uses a combination of multiple Relative Strength Index (RSI) moving averages to determine market trends and generate trading signals. The strategy draws inspiration from how alligators hunt, opening trades when short-term RSI lines cross long-term RSI lines.
Strategy Logic
The Alligator RSI trading strategy utilizes three RSI lines - 5-period, 13-period and 34-period. The 5-period RSI line is called the “Teeth” line, the 13-period line the “Lips” line and the 34-period line the “Jaw” line. When the “Teeth” or “Lips” line crosses above the “Jaw” line, a long signal is generated. When the “Teeth” or “Lips” line crosses below the “Jaw” line, a short signal is triggered.
The key lies in capturing crosses between short-term and long-term RSI lines to gauge the relationship between short-term and long-term trends, and identify reversal opportunities. When short-term RSI crosses long-term RSI, it signals a reversal in short-term price action, allowing profits from the impending long-term trend reversal by taking a position in the opposite direction.
Advantage Analysis
The Alligator RSI trading strategy has the following advantages:
- Captures market reversals, profit from trend reversals
- Multiple RSI MAs confirm signals, avoid false signals
- Simple and easy-to-understand logic, easy to understand and implement
- Adjustable parameters, adjustable parameters
- Applicable across markets and timeframes, works on various markets and timeframes
Risk Analysis
The Alligator RSI trading strategy also has the following risks:
- Prone to false signals, prone to false signals
- Struggles during range-bound markets, struggles during range-bound markets
- Potentially large drawdowns, potentially large drawdowns
- Time-consuming parameter tuning, time-consuming parameter tuning
- Potential overtrading, potentially overtrading
These risks can be mitigated by combining additional indicators, optimizing parameters and adjusting position sizing appropriately.
Optimization Directions
The Alligator RSI trading strategy can be optimized in the following ways:
- Combine other technical indicators like Bollinger Bands, candlestick patterns to filter false signals
- Optimize RSI parameters to find best MA parameter combination
- Adjust position sizing and stop loss based on market conditions
- Test parameter effectiveness across different products and timeframes
- Incorporate machine learning to dynamically optimize parameters
Conclusion
The Alligator RSI trading strategy uses RSI MA crosses to capture market reversal opportunities. It is simple, usable for algo-trading but has some flaws. Parameter optimization and indicator combinations can enhance this strategy to make it a steady profitable algorithmic trading strategy.
/*backtest
start: 2022-11-30 00:00:00
end: 2023-12-06 00:00:00
period: 1d
basePeriod: 1h
exchanges: [{"eid":"Futures_Binance","currency":"BTC_USDT"}]
*/

//@version=3
strategy("RSI Alligator", overlay=false)

jaws = rsi(close, 34)
teeth = rsi(close, 5)
lips = rsi(close, 13)
plot(jaws, color=blue, title="Jaw")
plot(teeth, color=green, title="Teeth")
plot(lips, color=red, title="Lips")


longCondition = crossover(rsi(close, 13), rsi(close, 34)) and (rsi(close, 5) > rsi(close, 34))
longCondition1 = crossover(rsi(close, 5), rsi(close, 34)) and (rsi(close, 13) > rsi(close, 34))
if (longCondition)
    strategy.entry("Long", strategy.long)
if (longCondition1)
    strategy.entry("Long", strategy.long)

shortCondition = crossunder(rsi(close, 13), rsi(close, 34)) and (rsi(close, 5) < rsi(close, 34))
shortCondition1 = crossunder(rsi(close, 5), rsi(close, 34)) and (rsi(close, 13) < rsi(close, 34))
if (shortCondition)
    strategy.entry("Short", strategy.short)
if (shortCondition1)
    strategy.entry("Short", strategy.short)

    // === BACKTESTING: EXIT strategy ===
sl_inp = input(10, title='Stop Loss %', type=float)/100
tp_inp = input(90, title='Take Profit %', type=float)/100

stop_level = strategy.position_avg_price * (1 - sl_inp)
take_level = strategy.position_avg_price * (1 + tp_inp)

strategy.exit("Stop Loss/Profit", "Long", stop=stop_level, limit=take_level)