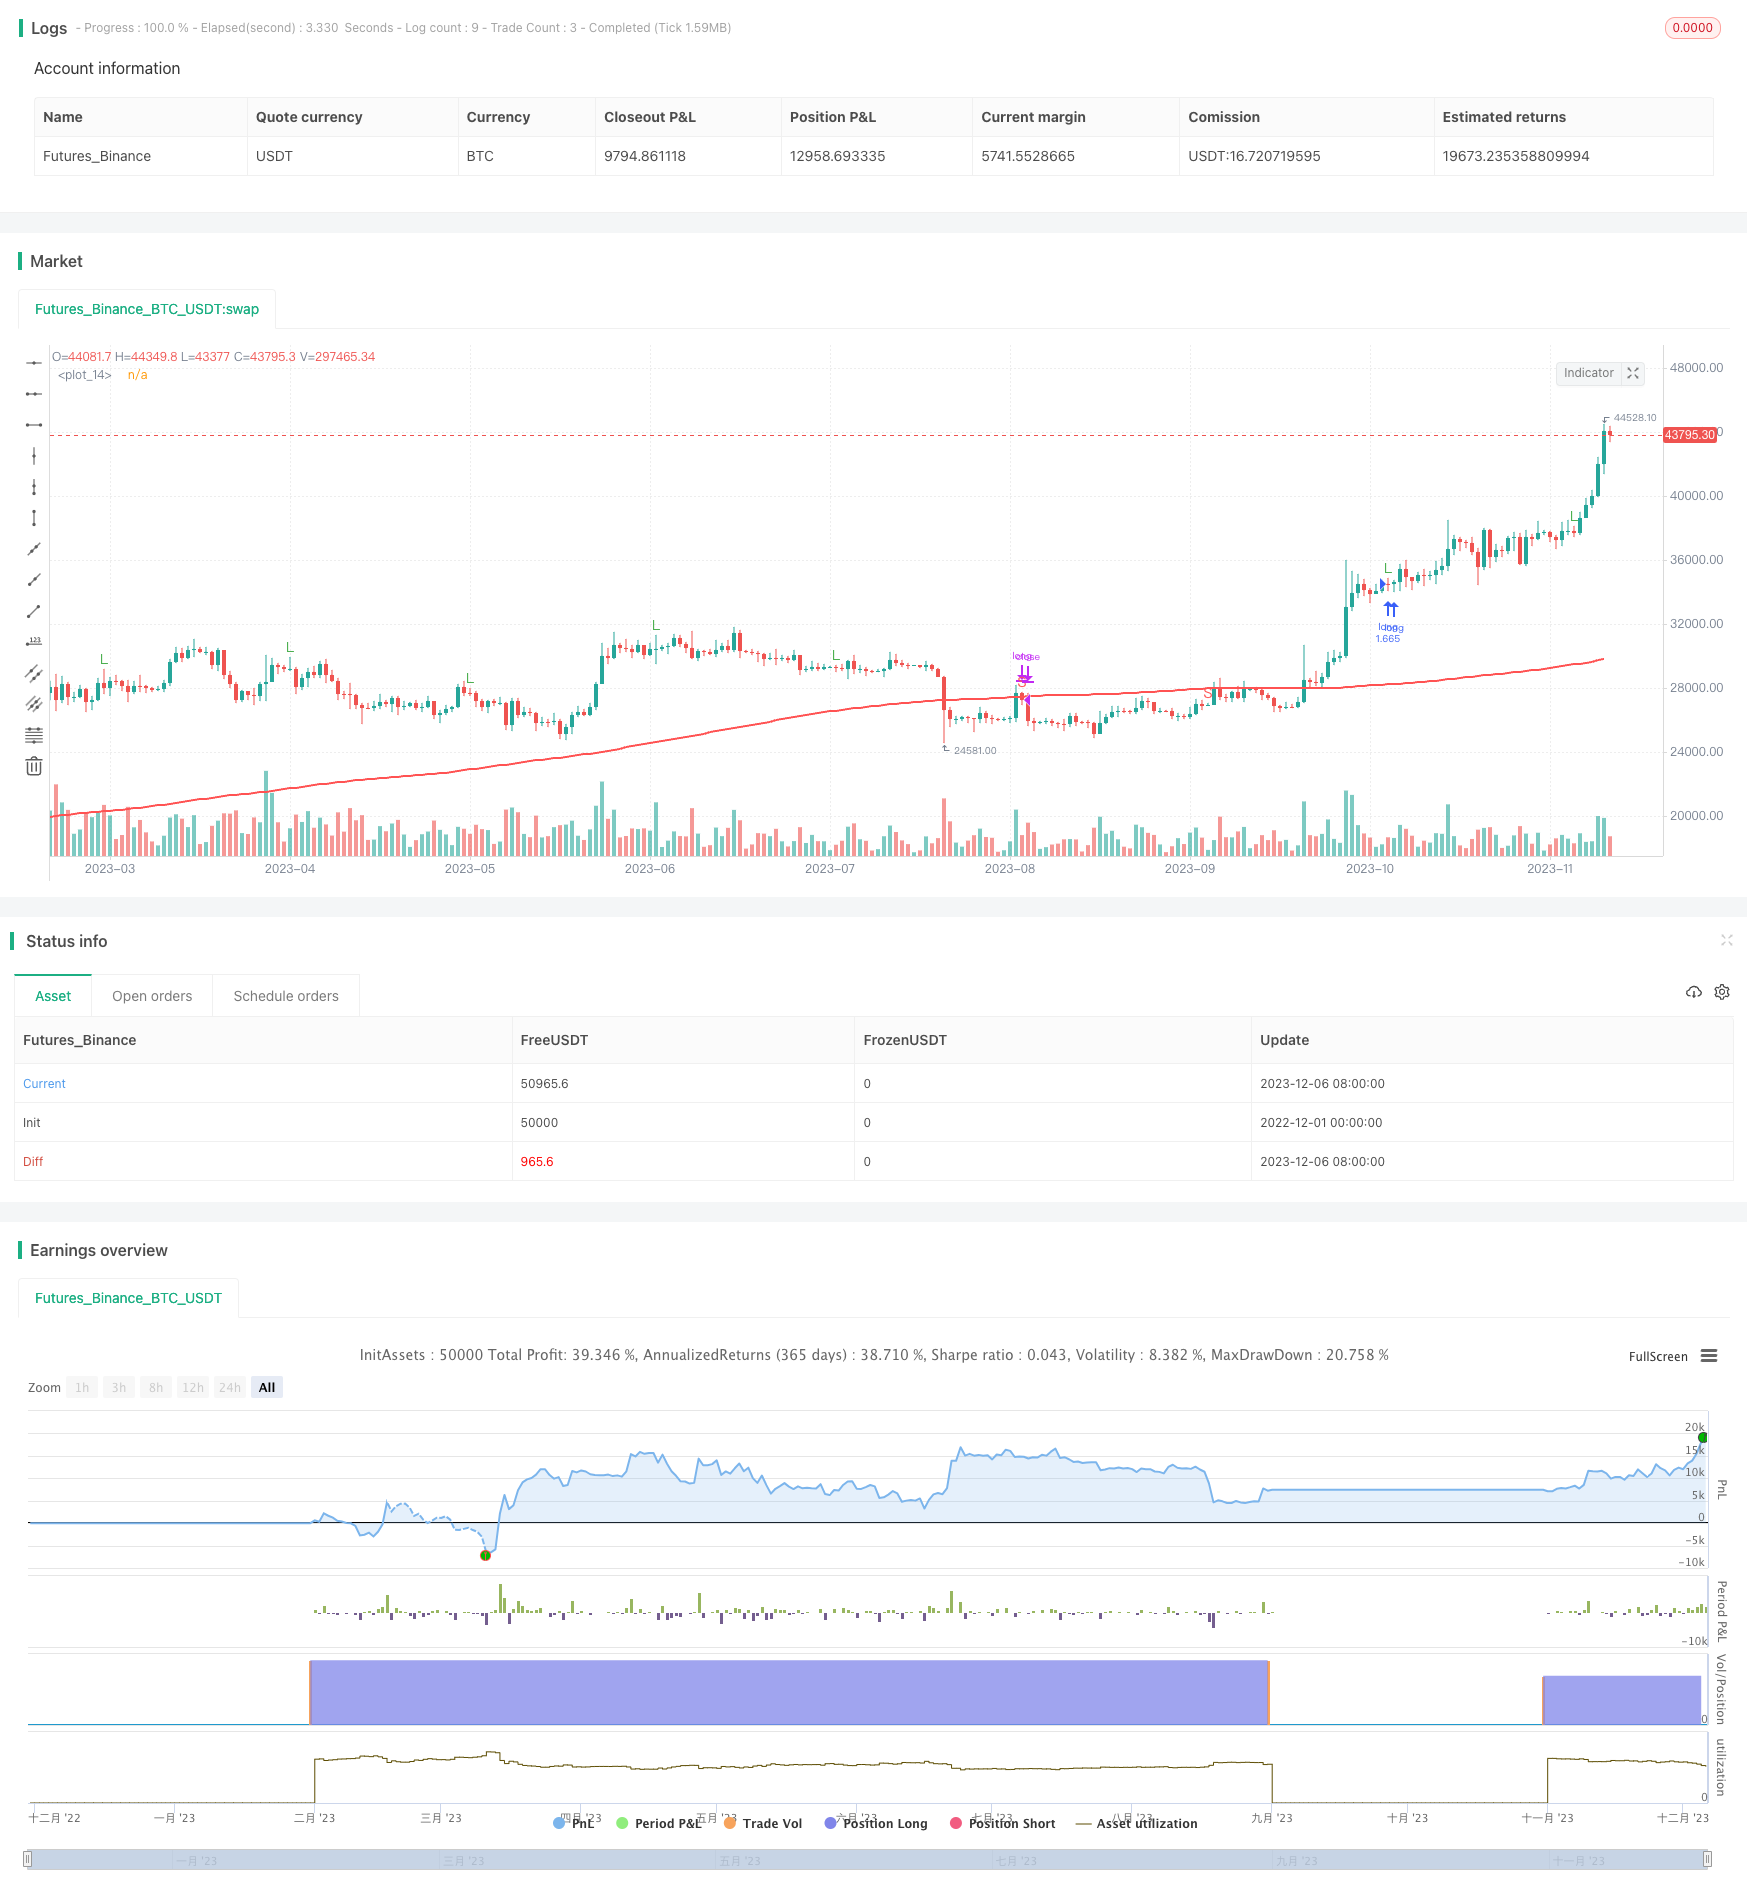
End of Month Breakout on 200 Day Moving Average Strategy
Author: ChaoZhang, Date: 2023-12-08 16:02:08Tags:

Overview
This strategy is based on the price breakout of the 200-day moving average at month end to capture the trend direction of stock prices. A long position will be established when the price breaks through the 200-day MA, otherwise the position will be cleared.
Strategy Principle
- Use the 200-day simple moving average dma200 as an indicator to judge the price trend
- On the last trading day of each month, judge whether the closing price close is higher than dma200
- If the closing price breaks through the 200-day MA, establish a full long position at the opening of next trading day
- If the closing price breaks below the 200-day MA, clear all positions at the opening of next trading day
- This can achieve the effect of trend following, establishing positions when stock prices enter an upward trend and avoiding downward trends
Advantage Analysis
- The advantage of the strategy is that it is simple and effective, easy to understand and implement
- Taking positions at month end can reduce trading frequency and minimize trading costs and slippage impacts
- The 200-day MA is a very commonly used medium and long term trend judgment indicator, effective for most stocks
- The strategy has relatively small drawdown and maximum decline, with controllable risks
Risk Analysis
- The 200-day MA may not be sensitive enough for some stocks to capture price reversals in time
- There is only 1 trading point per month for taking positions, which may miss upside/downside opportunities
- The strategy may fail to judge correctly when the overall market trend is uncertain
- Other indicators should be combined to reduce these risks
Optimization Directions
- Consider increasing trading points at beginning or middle of month to improve strategy frequency
- Add indicators like Bollinger Bands to judge price fluctuation and avoid wrong trades
- Evaluate fitting effects of different MA parameters on different stocks to find optimal parameter combinations
- Establish dynamic position sizing mechanisms to stop loss actively when drawdown gets too high
Summary
The strategy is relatively simple and practical overall, effectively capturing medium and long term price trends of stocks through month end breakout of the 200-day MA, with relatively small drawdown and risks. By combining more indicators and dynamic optimizations, the stability and profitability of the strategy can be further enhanced.
/*backtest
start: 2022-12-01 00:00:00
end: 2023-12-07 00:00:00
period: 1d
basePeriod: 1h
exchanges: [{"eid":"Futures_Binance","currency":"BTC_USDT"}]
*/

// This source code is subject to the terms of the Mozilla Public License 2.0 at https://mozilla.org/MPL/2.0/
// © muscleriot
//200 dma
//2000-2016 backtested
//1 signal per month only at end of month
//If > 200DMA enter long
//If < 200DMA goto cash
//results: 318% drawdown 17% vs 125% with 55% drawdown for buy and hold
//@version=5
strategy("200DMA last DOM - ajh", overlay =true,default_qty_type=strategy.percent_of_equity, default_qty_value=100)
// Use 100% of  equity always

dma200 = ta.sma(close, 200)
plot(dma200, color=color.red, linewidth = 2)
//e =dayofmonth(time)
// backtesting date range
from_day = input.int(defval=1, title="From Day", minval=1, maxval=31)
from_month = input.int(defval=1, title="From Month", minval=1, maxval=12)
from_year = input.int(defval=2018, title="From Year", minval=1900)

to_day = input.int(defval=1, title="To Day", minval=1, maxval=31)
to_month = input.int(defval=1, title="To Month", minval=1, maxval=12)
to_year = input.int(defval=9999, title="To Year", minval=1900)

time_cond = time > timestamp(from_year, from_month, from_day, 00, 00) and
   time < timestamp(to_year, to_month, to_day, 23, 59)


xLong = dayofmonth(time) == 30 and (close > dma200) ? true : na
xSell = dayofmonth(time) == 30 and (close < dma200) ? true : na
plotchar(xLong, "long","L", color=color.green)
plotchar(xSell, "Sell","S", color=color.red)
if (xLong == true) and time_cond
    strategy.entry("long", strategy.long)
if (xSell == true) and time_cond
    strategy.close("long")
More
- Bollinger Percentage Bands Trading Strategy
- Trailing Take Profit Trailing Stop Loss Strategy
- Y-Profit Maximizer Strategy
- Breakout Trend Following Strategy
- SuperTrend-based Trend Tracking Strategy
- Strategy Based on Exponential Moving Average and MACD Indicator
- Index Trading Strategy Based on Bollinger Bands
- Exponential Moving Average Bounce Strategy
- Price Volatility Breakout Strategy Based on Double Moving Averages
- SuperTrend and DEMA Based Trend Following Strategy
- OBV Pyramid Strategy Based on Coinrule Script
- Quantitative Trading Based on Moving Average Envelope and ATR Trailing Stop
- ADX Crossover Trend Trading Strategy
- Crypto Bull Run Tracking Strategy
- SuperTrend Engulfing Strategy
- ADX-Based One-Hour TENKAN KIJUN Cross Trend Tracking Strategy
- MACD Moving Average Bull Bear Conversion Strategy
- Moving Average Crossover Strategy
- Price Channel and MACD Based Multi Timeframe Trading Strategy
- Binomial Moving Average Trend Strategy