Overview
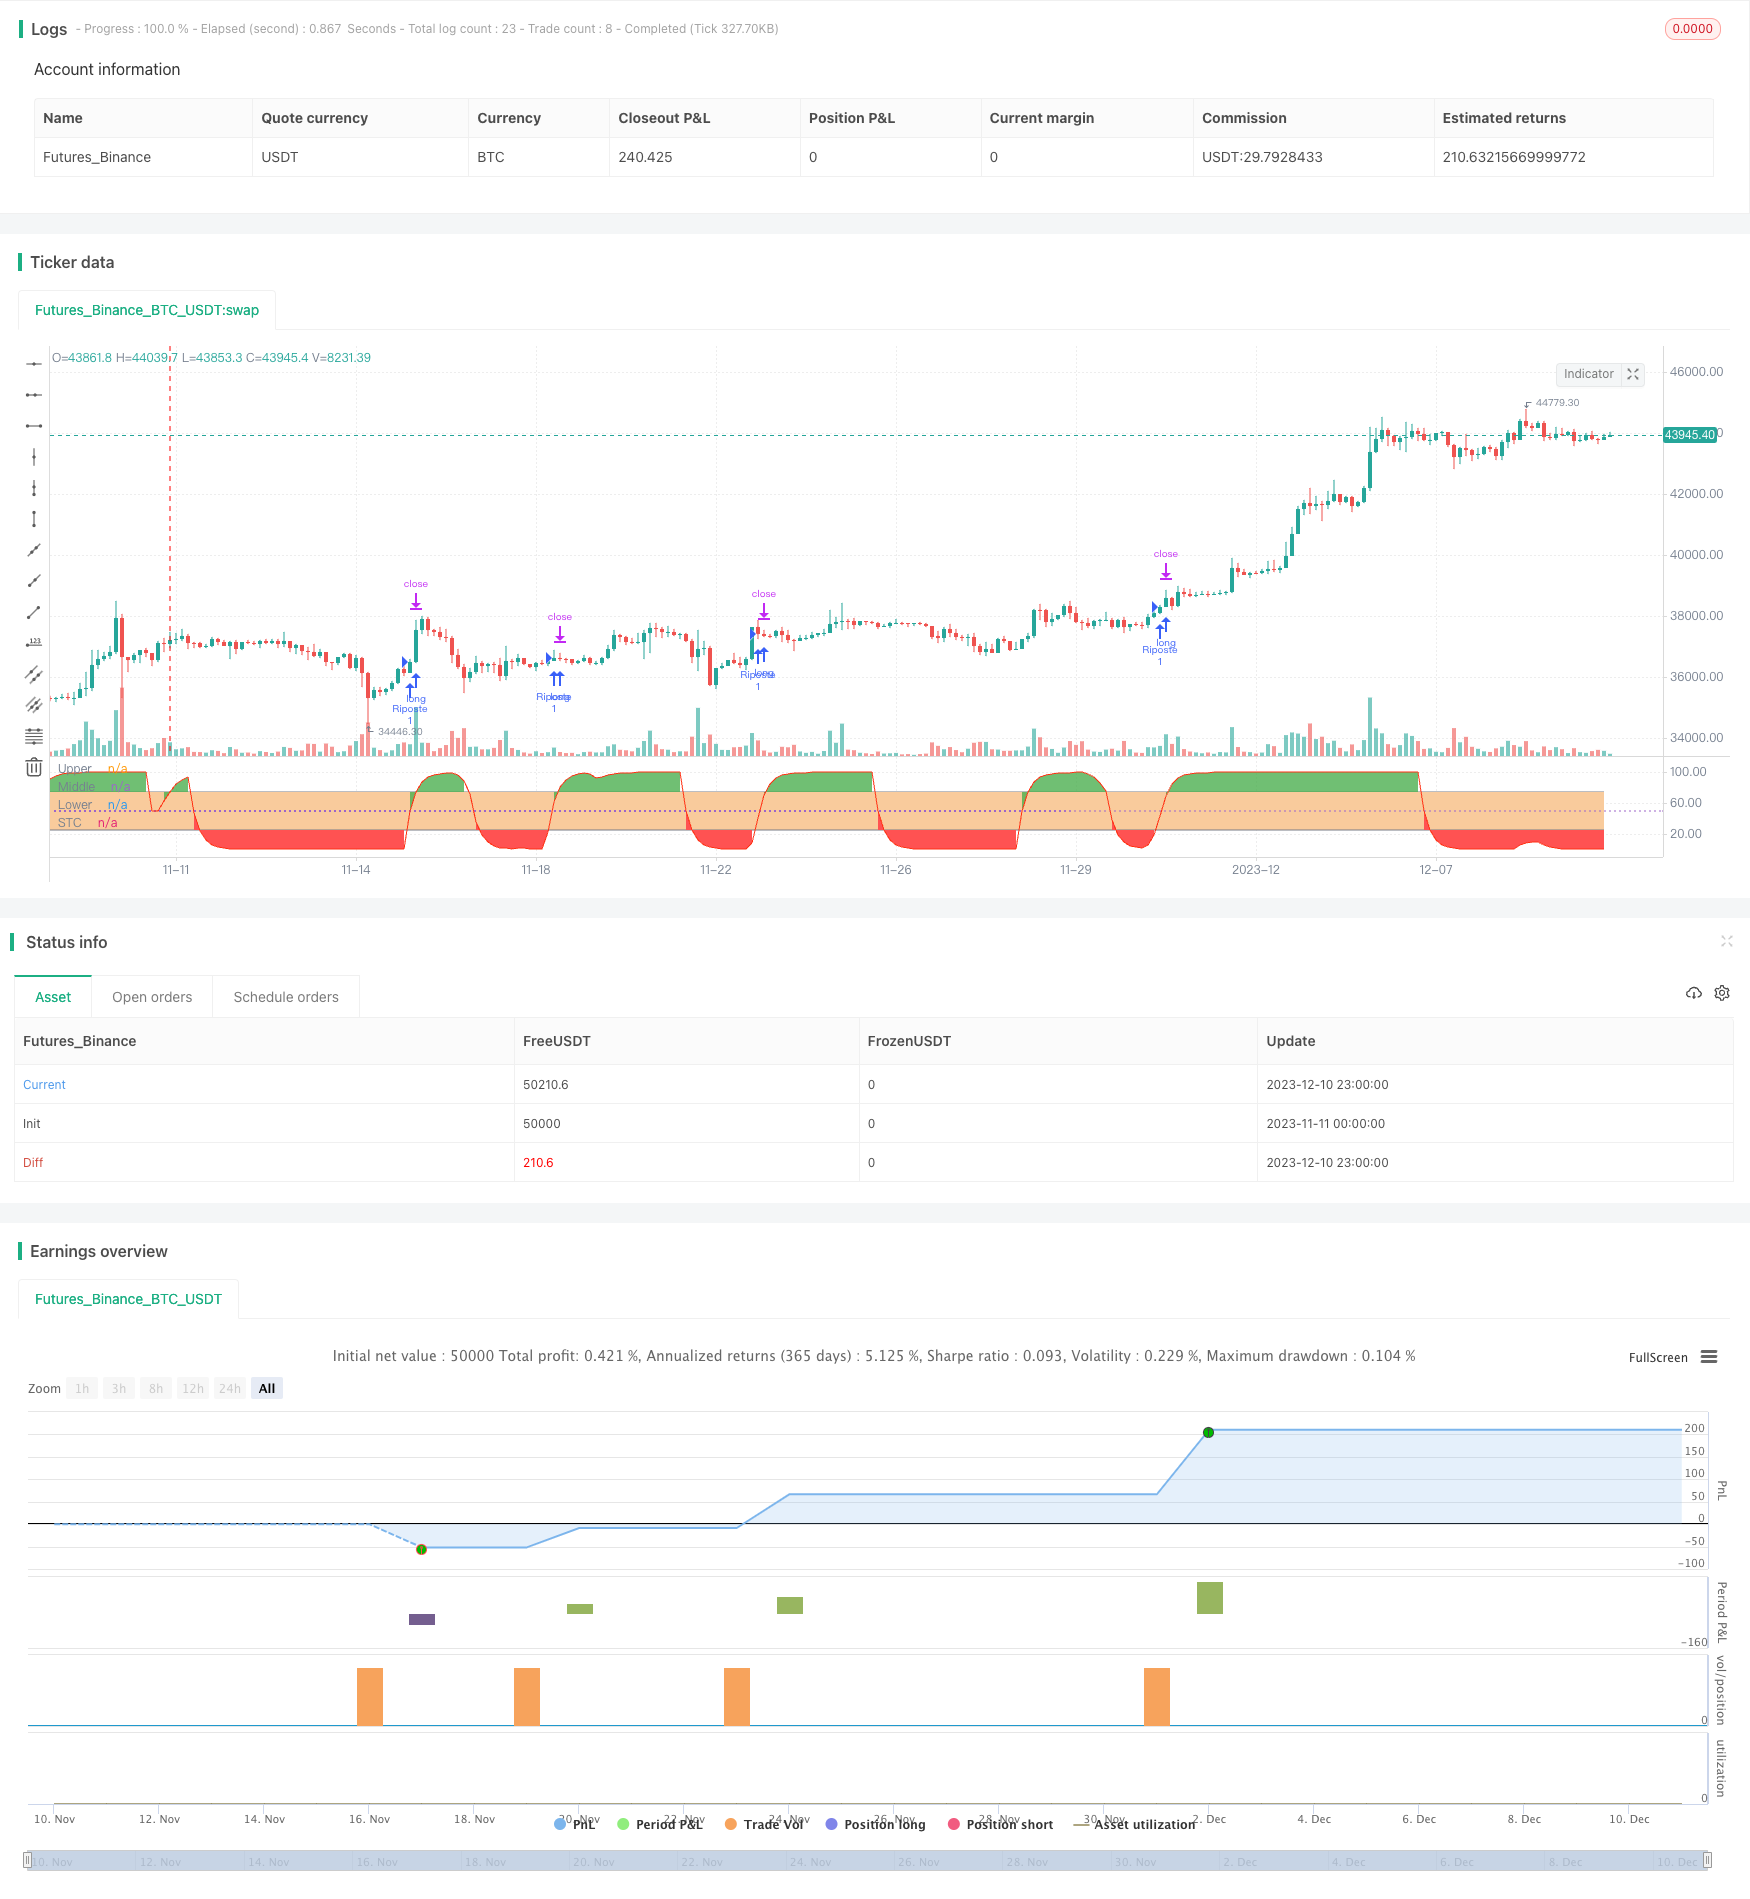
This strategy is named “Schaff Trend Cycle with Double Moving Average Crossover Strategy”. The main idea is to determine long and short positions based on the Schaff Trend Cycle (STC) indicator and double moving average crossover. Specifically, when the STC breaks out of the overbought or oversold areas, the price is above the fast exponential moving average, and the fast EMA is above the slow EMA, a long position is opened. Conversely, a short position is opened.
Strategy Logic
The strategy relies primarily on two technical indicators:
Trend indicator: STC indicator to determine trend direction. The STC includes the MACD, Stochastic, and STC indicator line. An upward breakout from the 0-25 zone signals a bullish trend, while a downward breakout from the 75-100 zone signals a bearish trend.
Moving average crossover: Fast simple moving average (default period 35) crosses above/below the slow SMA (default period 200). A bullish signal triggered when the fast SMA crosses above the slow SMA. A bearish signal triggered on the opposite crossover.
The trading signal logic is defined as follows:
Long signal: STC breaks above the 25 line, fast SMA is above slow SMA, and close price is above fast SMA.
Short signal: STC breaks below 75 line, fast SMA is below slow SMA, and close price is below fast SMA.
Advantage Analysis
The advantages of this strategy include:
Reliable trading signals from combining trend and moving average indicators. STC determines overall trend, while double MAs generate specific entry signals.
Customizable moving average periods. MA periods can be optimized for different market conditions.
Controllable risk. STC identifies overbought/oversold levels to avoid buying tops and selling bottoms. Target stops set 400 point profit/loss range.
Risk Analysis
There are some risks to consider:
Potential for STC false breakouts. Needs to be confirmed by price action.
More false signals from MA crosses. Requires tuning of MA periods.
Only trades in one direction at a time. Limits space for open positions. Consider allowing dual-directional trading.
No handling of spread risk in margin FX trading. Spread could be substantial in live trading.
Optimization
Possible optimization paths include:
Adjust STC overbought/oversold parameters.
Optimize MA periods to improve crossover signal reliability.
Add additional filters like Bollinger Bands to reduce false breakout trades.
Implement dual-directional trading logic to increase capacity.
Add stop loss logic to control loss per trade.
Conclusion
In summary, this strategy combines trend and moving average crossover indicators to determine trend direction and timing of entries. With proper risk controls, it can achieve good returns. The straightforward logic makes it easy to understand and optimize across different market conditions, well-suited for beginners.
/*backtest
start: 2023-11-11 00:00:00
end: 2023-12-11 00:00:00
period: 3h
basePeriod: 15m
exchanges: [{"eid":"Futures_Binance","currency":"BTC_USDT"}]
*/

//@version=4
// Shaff Trend Cycle coded by Alex Orekhov (everget)
// Strategy and its additional conditions provided by greenmask
// Schaff Trend Cycle script may be freely distributed under the MIT license.
strategy("STC", shorttitle="STC")

fastLength = input(title="MACD Fast Length", type=input.integer, defval=23)
slowLength = input(title="MACD Slow Length", type=input.integer, defval=50)
cycleLength = input(title="Cycle Length", type=input.integer, defval=10)
d1Length = input(title="1st %D Length", type=input.integer, defval=3)
d2Length = input(title="2nd %D Length", type=input.integer, defval=3)
src = close
highlightBreakouts = input(title="Highlight Breakouts ?", type=input.bool, defval=true)

macd = ema(src, fastLength) - ema(src, slowLength)
k = nz(fixnan(stoch(macd, macd, macd, cycleLength)))
d = ema(k, d1Length)
kd = nz(fixnan(stoch(d, d, d, cycleLength)))
stc = ema(kd, d2Length)
stc := 	stc > 100 ? 100 : stc < 0 ? 0 : stc
stcColor = not highlightBreakouts ? (stc > stc[1] ? color.green : color.red) : #ff3013
stcPlot = plot(stc, title="STC", color=stcColor, transp=0)
upper = 75
lower = 25
transparent = color.new(color.white, 100)
upperLevel = plot(upper, title="Upper", color=color.gray)
hline(50, title="Middle", linestyle=hline.style_dotted)
lowerLevel = plot(lower, title="Lower", color=color.gray)

fill(upperLevel, lowerLevel, color=#f9cb9c, transp=90)

upperFillColor = stc > upper and highlightBreakouts ? color.green : transparent
lowerFillColor = stc < lower and highlightBreakouts ? color.red : transparent

fill(upperLevel, stcPlot, color=upperFillColor, transp=80)
fill(lowerLevel, stcPlot, color=lowerFillColor, transp=80)
strategy.initial_capital = 50000
ordersize=floor(strategy.initial_capital/close)
targetvalue = input(title="Target/stop", type=input.integer, defval=400)

ma1length = input(title="SMA1", type=input.integer, defval=35)
ma2length = input(title="SMA2", type=input.integer, defval=200)
ma1 = ema(close,ma1length)
ma2 = ema(close,ma2length)

bullbuy = crossover(stc, lower) and ma1>ma2 and close>ma1
bearsell = crossunder(stc, upper) and ma1<ma2 and close<ma1

if (bullbuy)
    strategy.entry("Riposte", strategy.long, ordersize)
    strategy.exit( "Riposte close", from_entry="Riposte", qty_percent=100, profit=targetvalue,loss=targetvalue)

if (bearsell)
    strategy.entry("Riposte", strategy.short, ordersize)
    strategy.exit( "Riposte close", from_entry="Riposte", qty_percent=100, profit=targetvalue,loss=targetvalue)

//plotshape(bullbuy,  title= "Purple", location=location.belowbar, color=#006600, transp=0, style=shape.circle, size=size.tiny, text="Riposte")
//plotshape(bearsell,  title= "Purple", location=location.abovebar, color=#006600, transp=0, style=shape.circle, size=size.tiny, text="Riposte")