Golden Cross Optimized Moving Average Crossover Trading Strategy
Author: ChaoZhang, Date: 2023-12-19 13:37:33Tags:

Overview
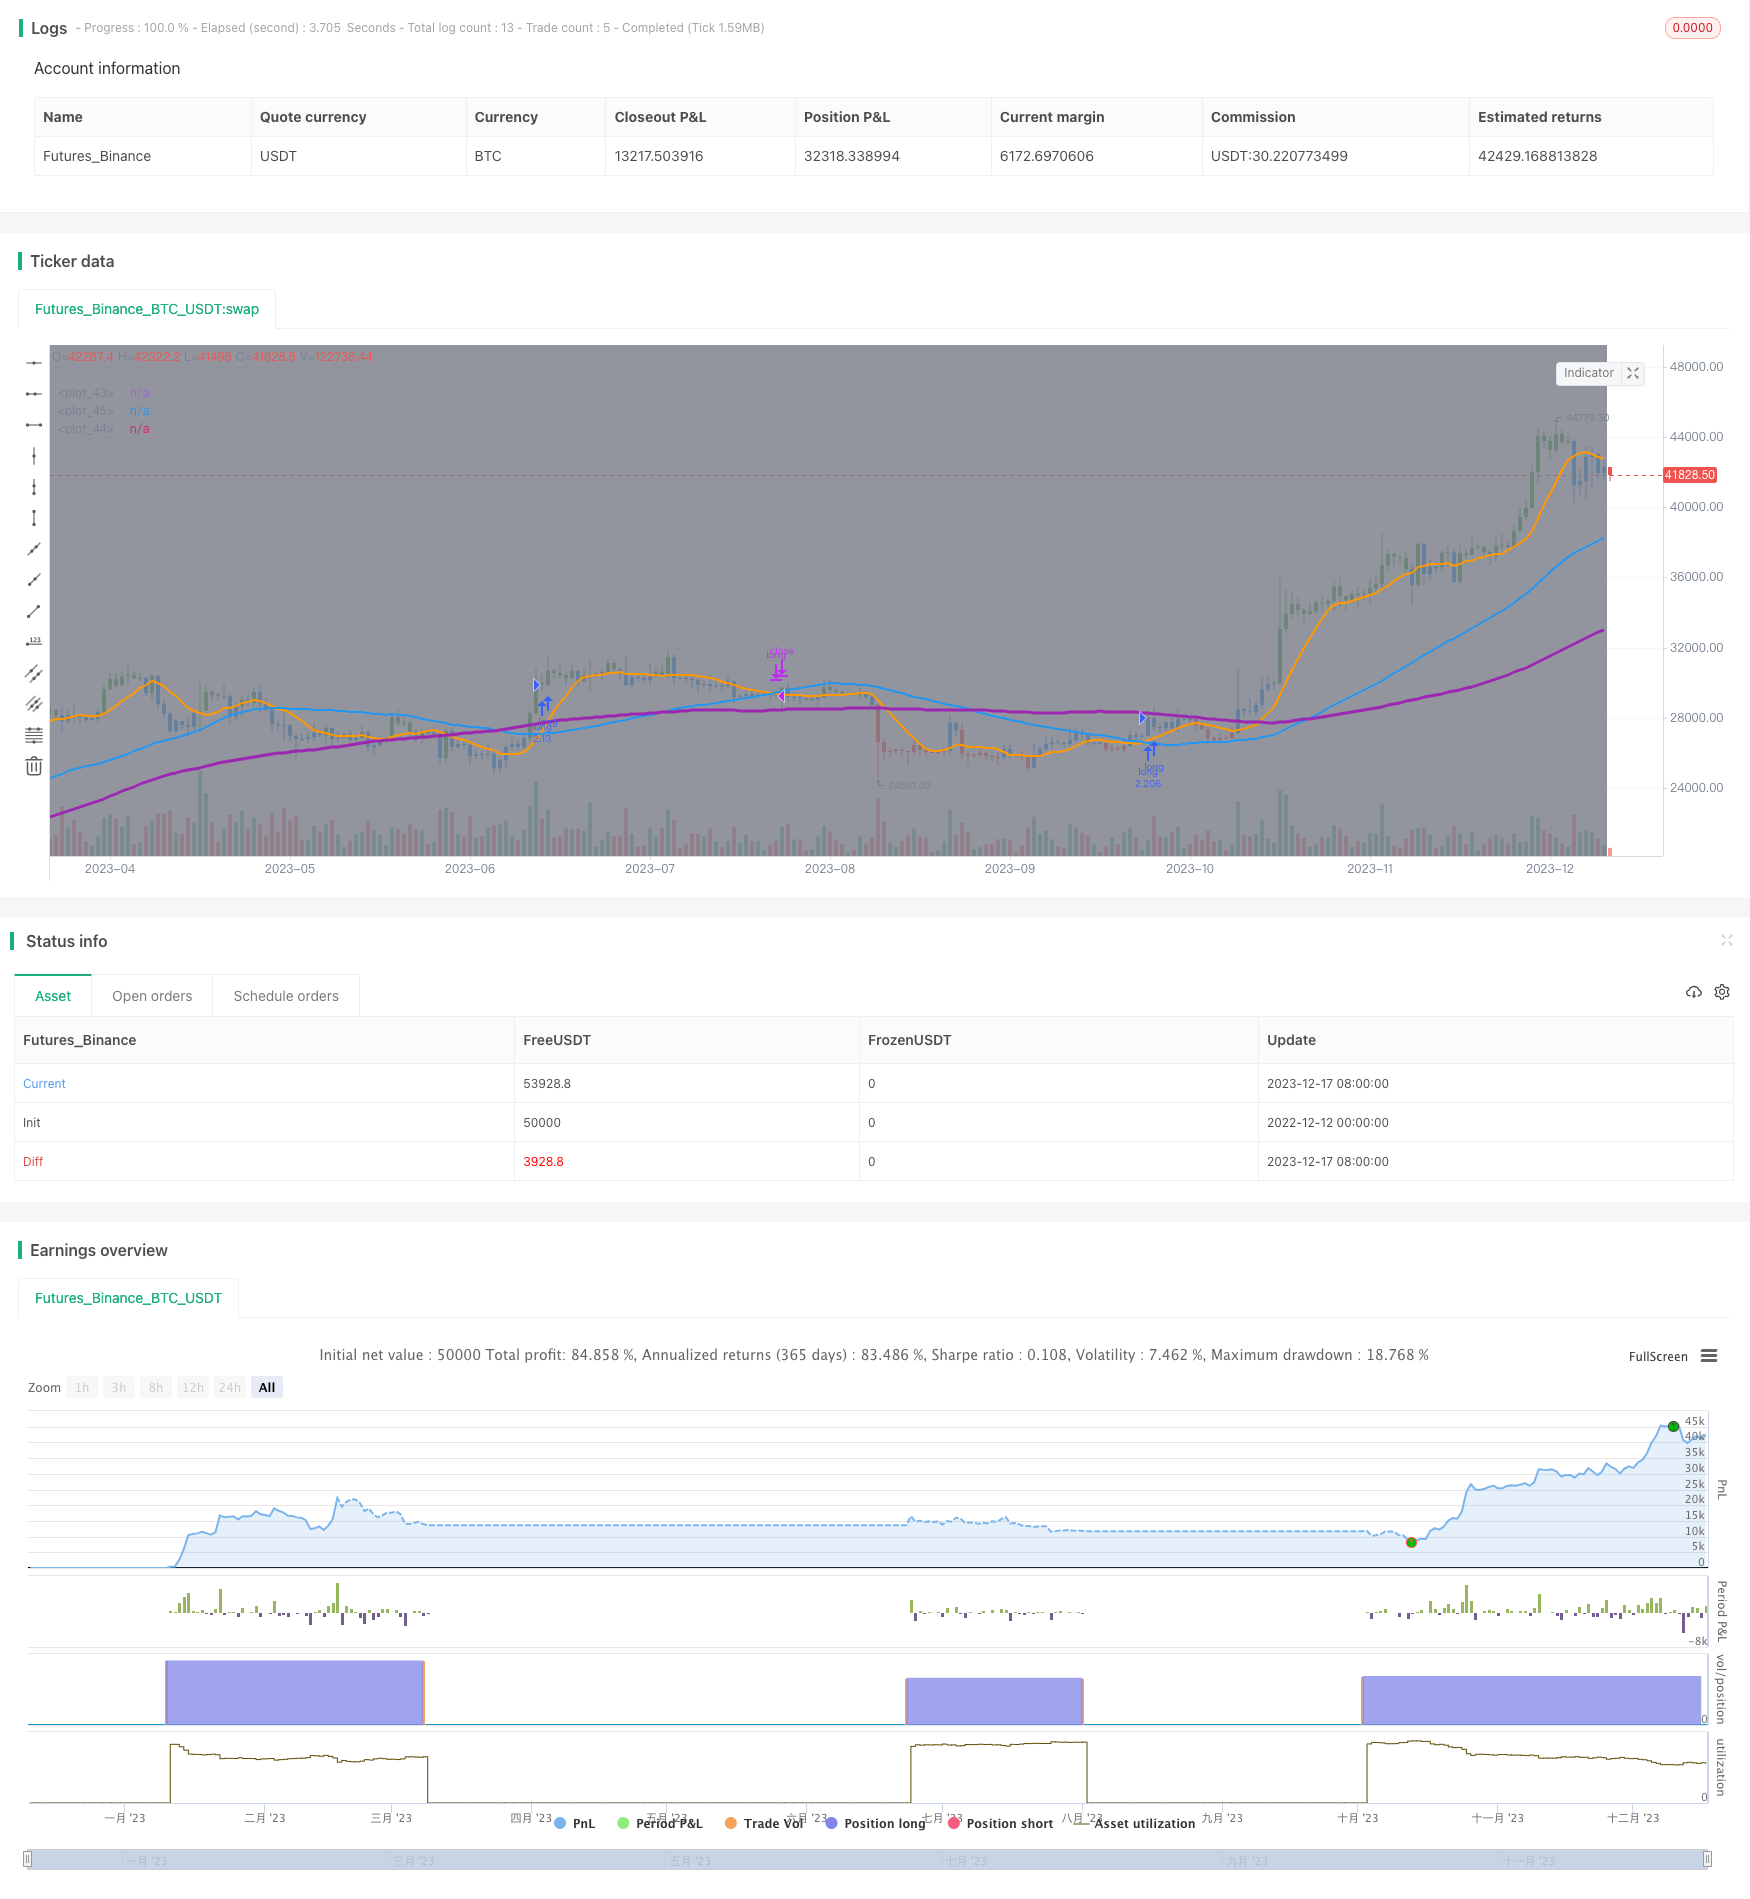
This strategy optimizes the conventional moving average crossover strategy by setting three moving averages with different periods, constructing a golden cross pattern with 9-period, 50-period and 100-period moving averages. It generates buy signals when the short-term MA crosses above the medium-term MA while the long-term MA is in an uptrend. The strategy name is “Optimized Golden Cross Moving Average Crossover Trading Strategy”.
Strategy Logic
The strategy utilizes three moving averages with periods of 9, 50 and 100. The 9-period MA is the short-term MA, 50-period MA is the medium-term MA, and 100-period MA is the long-term MA. Trading signals are generated by the crossover between the short-term MA and medium-term MA. Specifically, when the long-term MA is in an uptrend (above the medium-term MA), a buy signal is triggered when the short-term MA crosses above the medium-term MA. A sell signal is triggered when the short-term MA crosses below the medium-term MA.
Advantage Analysis
Compared with the conventional dual moving average crossover strategy, this strategy adds the condition of judging medium and long-term trends before generating trading signals, which can effectively filter out some invalid signals. When long-term trends are unclear, the strategy will not generate signals, avoiding being trapped in consolidation. At the same time, this strategy is suitable for capturing trending moves in the short and medium term, reducing the possibility of aggressive entry.
Risk Analysis
When setting parameters for this strategy, the combination of moving average periods needs to be adjusted. Different period combinations will have an impact on the strategy’s effectiveness. If the period parameters are not set properly, there is a risk of generating too many false signals. In addition, traders need to be aware of potential systemic risks and timely stop losses to mitigate risks.
Optimization Directions
Consider incorporating other indicators to aid in judging market trends, such as MACD, BOLL, etc., and set stricter entry conditions, or incorporate volatility indicators to construct adaptive moving averages so that parameters can automatically adjust based on market conditions to further optimize the strategy.
Conclusion
Based on the conventional dual moving average crossover, this strategy adds long-term MA judgment and filter conditions, which can effectively filter out false signals and is suitable for capturing short to medium-term trending moves. It is a simple and practical trend-following strategy. However, traders still need to pay attention to parameter optimization and systemic risks, and formulate scientific risk management strategies.
/*backtest
start: 2022-12-12 00:00:00
end: 2023-12-18 00:00:00
period: 1d
basePeriod: 1h
exchanges: [{"eid":"Futures_Binance","currency":"BTC_USDT"}]
*/

//@version=4
strategy("Golden Cross, SMA 100, Moving Average Strategy (by Coinrule)", shorttitle="Golden_Cross_Strat_MA100_optimized", overlay=true, initial_capital = 1000,process_orders_on_close=true, default_qty_type = strategy.percent_of_equity, default_qty_value = 100)

// Input
switch1=input(true, title="Enable Bar Color?")
switch2=input(false, title="Show Fast Moving Average")
switch3=input(true, title="Show Slow Moving Average")

//Calculate Moving Averages
movingaverage_fast = sma(close, input(9))
movingaverage_slow = sma(close, input(100))
movingaverage_normal= sma(close, input(50))

//Backtest dates
fromMonth = input(defval = 1,    title = "From Month",      type = input.integer, minval = 1, maxval = 12)
fromDay   = input(defval = 1,    title = "From Day",        type = input.integer, minval = 1, maxval = 31)
fromYear  = input(defval = 2020, title = "From Year",       type = input.integer, minval = 1970)
thruMonth = input(defval = 1,    title = "Thru Month",      type = input.integer, minval = 1, maxval = 12)
thruDay   = input(defval = 1,    title = "Thru Day",        type = input.integer, minval = 1, maxval = 31)
thruYear  = input(defval = 2112, title = "Thru Year",       type = input.integer, minval = 1970)
showDate  = input(defval = true, title = "Show Date Range", type = input.bool)

start     = timestamp(fromYear, fromMonth, fromDay, 00, 00)        // backtest start window
finish    = timestamp(thruYear, thruMonth, thruDay, 23, 59)        // backtest finish window
window()  => time >= start and time <= finish ? true : false       // create function "within window of time"


// Calculation
bullish_cross = crossover(movingaverage_fast, movingaverage_normal)
bearish_cross = crossunder(movingaverage_fast, movingaverage_normal)

//Entry and Exit
if bullish_cross and window() and movingaverage_slow > movingaverage_normal
    strategy.entry("long", strategy.long)

strategy.close("long", when = bearish_cross and window())

// Colors
bartrendcolor = close > movingaverage_fast and close > movingaverage_slow and change(movingaverage_slow) > 0 ? color.green : close < movingaverage_fast and close < movingaverage_slow and change(movingaverage_slow) < 0 ? color.red : color.blue
barcolor(switch1?bartrendcolor:na)

// Output
plot(movingaverage_fast, color=color.orange, linewidth=2)
plot(movingaverage_slow, color=color.purple, linewidth=3)
plot(movingaverage_normal, color=color.blue, linewidth=2)

bgcolor(color = showDate and window() ? color.gray : na, transp = 90)
- This BIST stocks 4-stage quantitative acquisition strategy
- Kifier's Hidden MFI/STOCH Divergence/Trend Breaker Trading Strategy
- MACD Quantitative Trading Strategy
- Dual Moving Average Trend Tracking Strategy
- A Momentum Tracking Mean Reversion Strategy
- Directional Movement Index Dual-direction Trading Strategy
- Bollinger Band Breakout Trading Strategy
- Laguerre RSI Trading Strategy
- Dynamic Re-entry Buy-only Strategy
- The Solid as a Rock VIP Quant Strategy
- Crossing Moving Average Strategy
- The Wave Trend Trading Strategy Based on LazyBear
- Eight Day Extended Run Strategy
- Moving Average Pullback Strategy
- Dynamic MA Crossover Trend Following Strategy
- Stochastic Moving Average Strategy
- Momentum Oscillation Crossing Bollinger Bands with Moving Average Strategy
- RSI Bollinger Bands Short-term Trading Strategy
- Super Trend Tracking Stop Loss Strategy
- MACD Trend Following Intraday Strategy