This BIST stocks 4-stage quantitative acquisition strategy
Author: ChaoZhang, Date: 2023-12-19 15:21:22Tags:

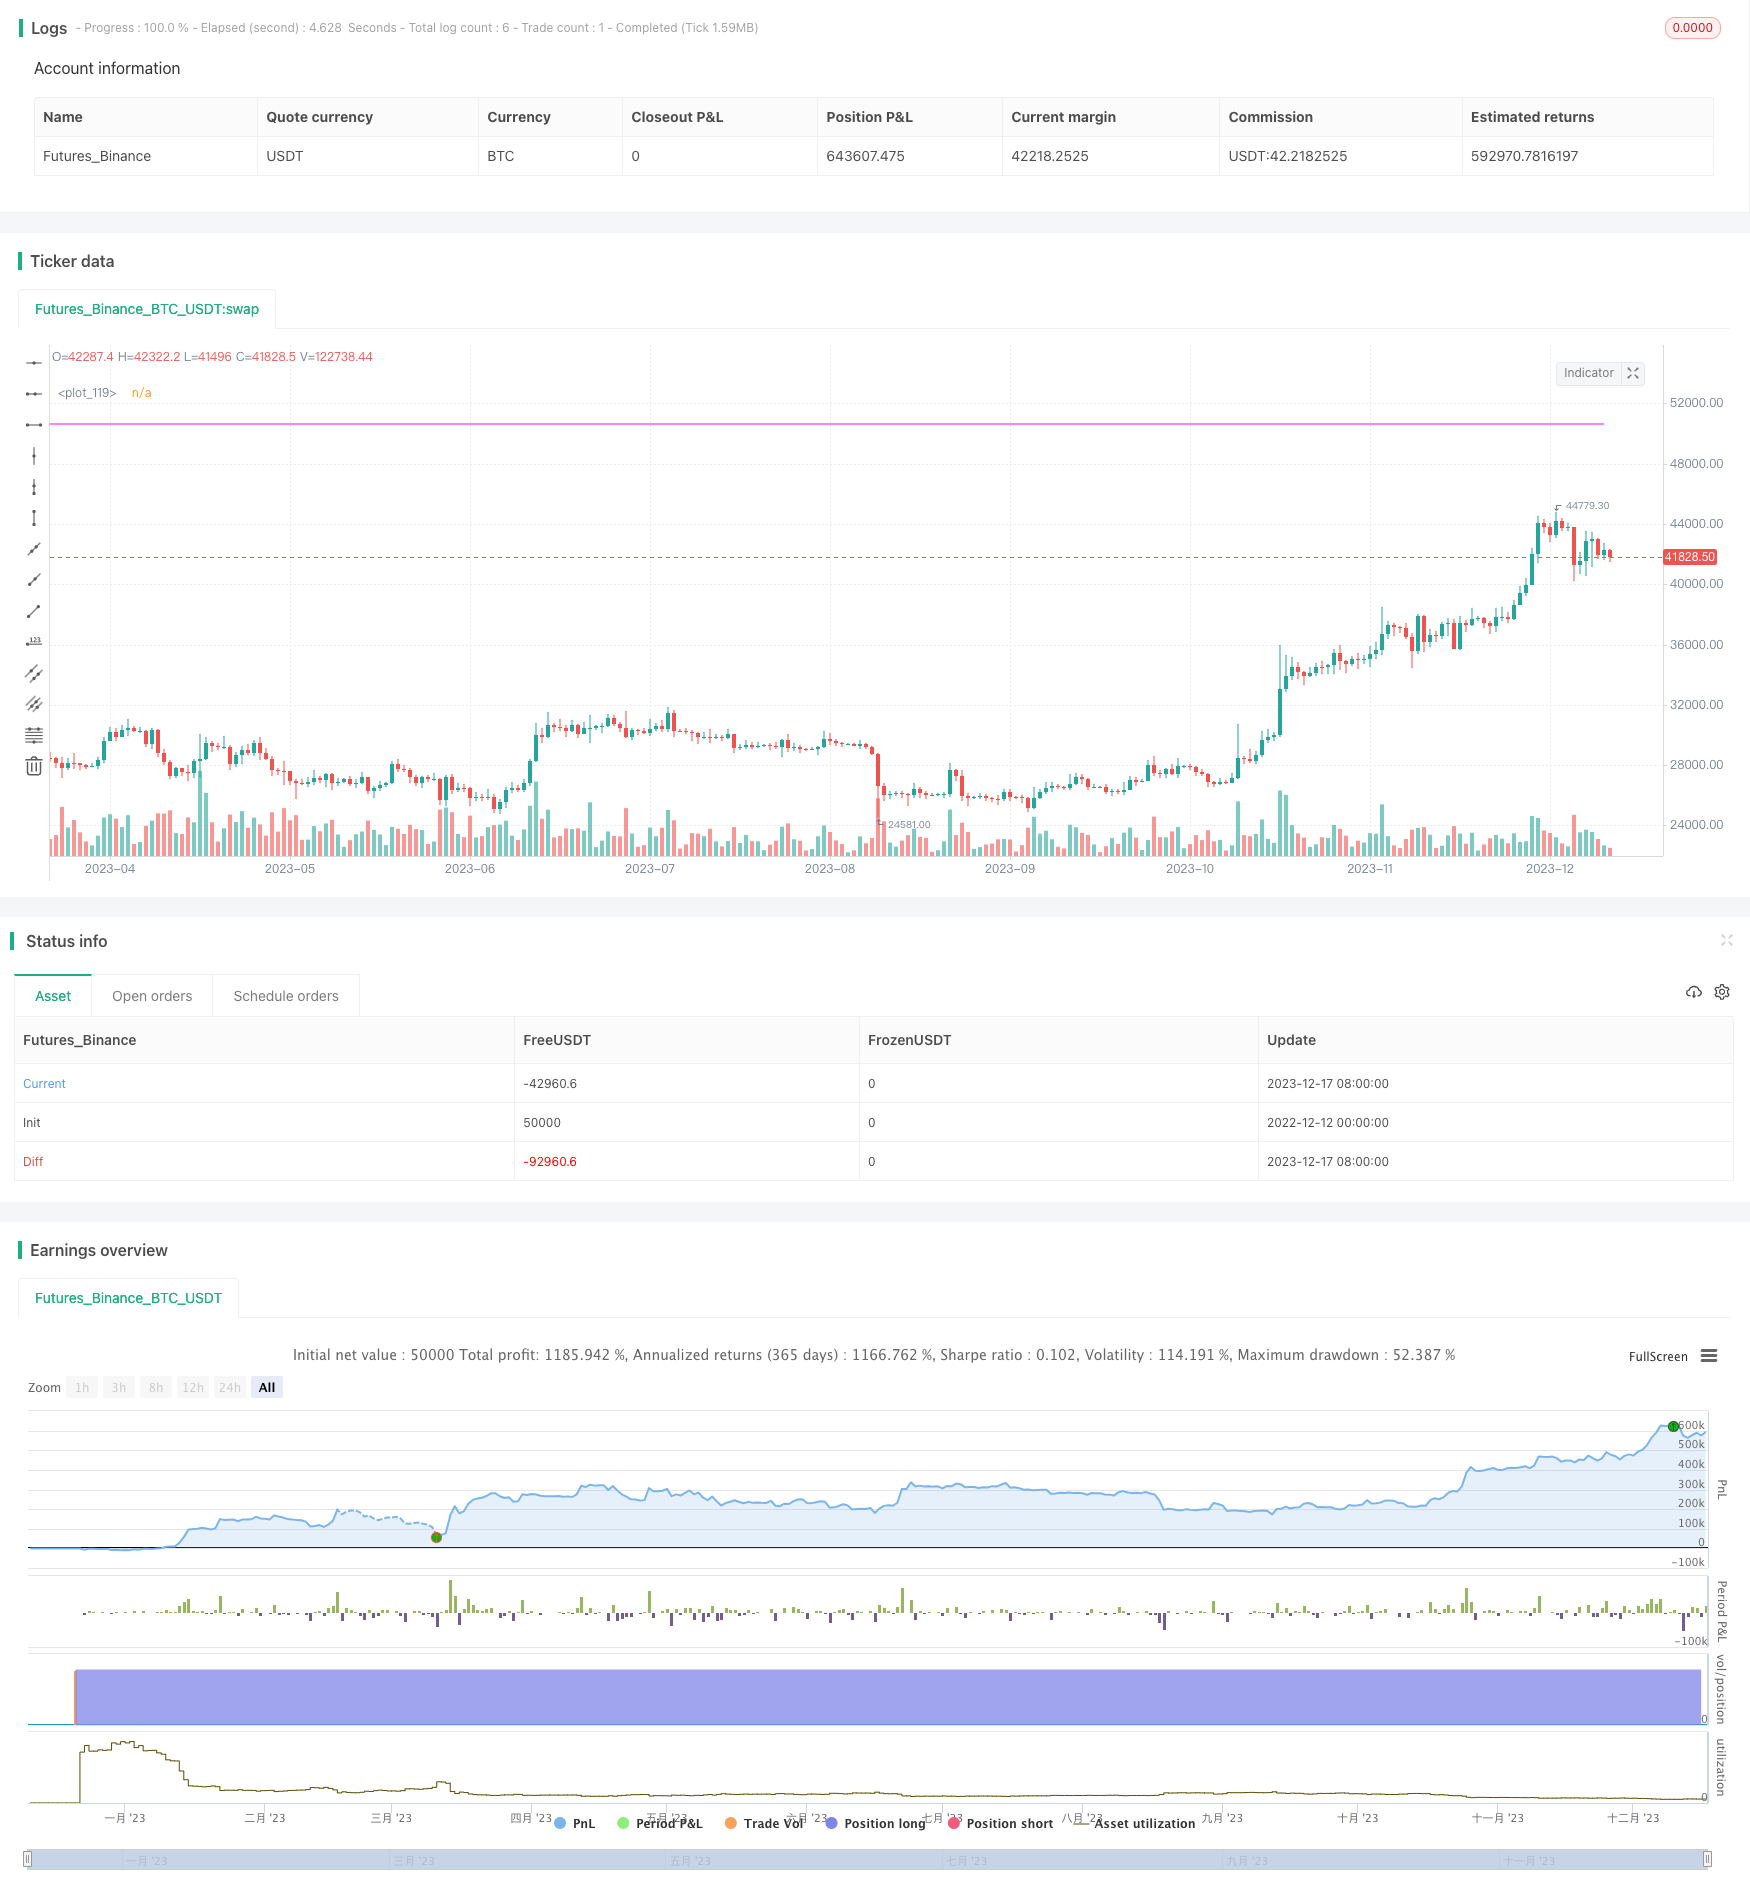
This BIST stocks 4-stage quantitative acquisition strategy is based on a four-stage buying to track the wave movements. It enters the market during post-manipulation and sells when buyer demand increases. This strategy is suitable for stocks with large fluctuations, and achieves better cost control through stage-by-stage purchases.
Strategy Principles
This strategy first calculates the resistance and support lines. The resistance line is determined by the intersection of the close price and the oscillating moving average of the high price, while the support line is determined by the intersection of the close price and the oscillating moving average of the low price.
When the price breaks below the support line, if the price is within the set buying range from the resistance line, it will buy in 25% of the position in the first stage. Then it will buy another 25% of the position around the first buy price, and so on for 4 times, eventually holding 100% of the position.
When the stock price exceeds twice the opening cost, it will close out all positions.
Advantages of the Strategy
- Lower buying costs through four-stage purchases
- Better entry points by tracking stock fluctuations
- Reasonable take profit point for decent returns
Risks and Solutions
-
Continued stock decline without stop loss, leading to large losses
- Set reasonable stop loss to effectively control losses
-
Improper parameter settings make multiple buy points too close to diversify costs
- Set appropriate price differences between buying stages
-
Stop loss point too wide to effectively control losses
- Set suitable stop distance based on actual trading environment and psychological tolerance
Optimization Directions
-
Adjust parameters for different types of stocks to better fit their characteristics
-
Add volatility indicators to buy when volatility rises
-
Optimize take profit by using trailing stop to achieve higher returns
-
Add stop loss settings to cut losses when price breaks certain levels
Summary
The BIST stocks 4-stage quantitative acquisition strategy is well suited for popular concept stocks overall. By staging the purchases, it can effectively utilize the volatility of the stocks to get better costs when prices pull back. Also, the reasonable take profit and stop loss settings allow it to perform well in risk control. With continual parameter adjustments and optimizations based on actual market environments, this strategy can reliably deliver alpha.
/*backtest
start: 2022-12-12 00:00:00
end: 2023-12-18 00:00:00
period: 1d
basePeriod: 1h
exchanges: [{"eid":"Futures_Binance","currency":"BTC_USDT"}]
*/

// This source code is subject to the terms of the Mozilla Public License 2.0 at https://mozilla.org/MPL/2.0/
// © Cantalk

//@version=5
strategy("BİST_100 HİSSELERİ 1_SAAT 4 KADEME ALIM",overlay = true, pyramiding=4, initial_capital=10000, process_orders_on_close=true, commission_type=strategy.commission.percent, commission_value=0.002)


LB2 = input(30, title="Alım_Üst_Çizgi")
LB = input(90, title="Alım_Alt_Çizgi")
Barcolor=input(true,title="Barcolor")
Bgcolor=input(true,title="Bgcolor")
//////////////////////////////////////////////////////////////////////

//////////////////////////////////////////////////////////////////////////////////////
RDirenc = ta.valuewhen(ta.cross(ta.hma(close, LB2), close), ta.highest(high, LB2), 1)
SDestek = ta.valuewhen(ta.cross(close, ta.hma(close, LB)), ta.lowest(low, LB), 1)


//plot(RDirenc,title="Resistance", color=#f7d707fc, linewidth =2)
//plot(SDestek,title="Support", color=#064df4, linewidth = 2)

//////////////////////////////////////////////////////////////////////////////////////////////////////////////////////////

LB22 = input(40, title="Satım_Üst_Çizgi")
LB1 = input(300, title="Satım_Alt_Çizgi")

Barcolor2=input(true,title="Barcolor2")
Bgcolor2=input(true,title="Bgcolor2")
//////////////////////////////////////////////////////////////////////

//////////////////////////////////////////////////////////////////////////////////////
RDirenc2 = ta.valuewhen(ta.cross(ta.hma(close, LB22), close), ta.highest(high, LB22), 1)
SDestek2 = ta.valuewhen(ta.cross(close, ta.hma(close, LB1)), ta.lowest(low, LB1), 1)


//plot(RDirenc2,title="Resistance2", color=#f40a0afc, linewidth =2)
//plot(SDestek2,title="Support2", color=#0eed0e, linewidth = 2)

//colors=if(close>RDirenc, color= #008000,if(SDestek<close,color=#FFFF00,color=#FF0000))

aralik_yuzde_alis = ((RDirenc-SDestek)/SDestek)*100
fark = input(25.0, title="Alış Aralığı %")


aralik_yuzde_satis = ((RDirenc2-SDestek2)/SDestek2)*100
fark2 = input(45.0, title="Satış aralığı %")


buyProcess = input(0.12, "ALIM YERİ %")
//buyProcess2 = input(0.10, "ALIM YERİ-2 %")
//buyProcess3 = input(0.10, "ALIM YERİ-3 %")


buy1 = strategy.position_avg_price - (strategy.position_avg_price * buyProcess)

buy2 = buy1 - (strategy.position_avg_price * buyProcess)

buy3 = buy2 - (strategy.position_avg_price * buyProcess)

buy4 = buy3 - (strategy.position_avg_price * buyProcess)


//////////////////////////////////////////////////////////////////////////////////////////////////////////////////////////////////
isLong1 = if ta.crossover(close, SDestek) and aralik_yuzde_alis < fark
    1
else
    0


isLong2 = if ta.crossover(close, SDestek) and (close <=  buy1)
    1
else
    0

isLong3 = if ta.crossover(close, SDestek) and (close <=  buy2)
    1
else
    0

isLong4 = if ta.crossover(close, SDestek) and (close <= buy3)
    1
else
    0


message_long_entry  = input("long entry message")
message_long_exit   = input("long exit message")


fullProfit = input(2.00, "PROFİT SATIŞ SEVİYESİ")
profit = strategy.position_avg_price * fullProfit
///////////////////////////////////////////////////////////////////////////////////////////////////////////////////////////////////
//////////////////////////////////////////////////////////////////////////////////////////////////////////////////////////////////

strategy.entry(id = "BUY-1", direction = strategy.long, qty = 25, when = (isLong1 and strategy.position_size == 0), alert_message = message_long_entry)
strategy.entry(id = "BUY-2", direction = strategy.long, qty = 25, when = (isLong2 and strategy.position_size == 25), alert_message = message_long_entry)
strategy.entry(id = "BUY-3", direction = strategy.long, qty = 25, when = (isLong3 and strategy.position_size == 50), alert_message = message_long_entry)
strategy.entry(id = "BUY-4", direction = strategy.long, qty = 25, when = (isLong4 and strategy.position_size == 75), alert_message = message_long_entry)


buyclose1 = if  (close >= (strategy.position_avg_price + profit)) and aralik_yuzde_satis > fark2
    close


strategy.exit("EXİT",qty_percent = 100, stop = buyclose1)


aritmeticClose =  strategy.position_avg_price + profit
plot(aritmeticClose, color = color.rgb(248, 5, 240), linewidth = 1, style = plot.style_linebr)
- Bollinger Band Short-term Reversion Quantitative Strategy Based on Moving Average
- Gradient MACD Quant Strategy
- Dual-Track Fast Quantitative Reversal Trading Strategy
- Heikin Ashi and Kaufman Adaptive Moving Average Trading Strategy
- Momentum Breakout Trading Strategy
- Ichimoku Moving Average Crossover Strategy
- Momentum and Volume Trading Strategy
- Fractal Breakout Strategy
- Bill Williams Awesome Oscillator Trading Strategy
- Volatility Finite Volume Elements Strategy
- Kifier's Hidden MFI/STOCH Divergence/Trend Breaker Trading Strategy
- MACD Quantitative Trading Strategy
- Dual Moving Average Trend Tracking Strategy
- A Momentum Tracking Mean Reversion Strategy
- Directional Movement Index Dual-direction Trading Strategy
- Bollinger Band Breakout Trading Strategy
- Laguerre RSI Trading Strategy
- Dynamic Re-entry Buy-only Strategy
- The Solid as a Rock VIP Quant Strategy
- Golden Cross Optimized Moving Average Crossover Trading Strategy