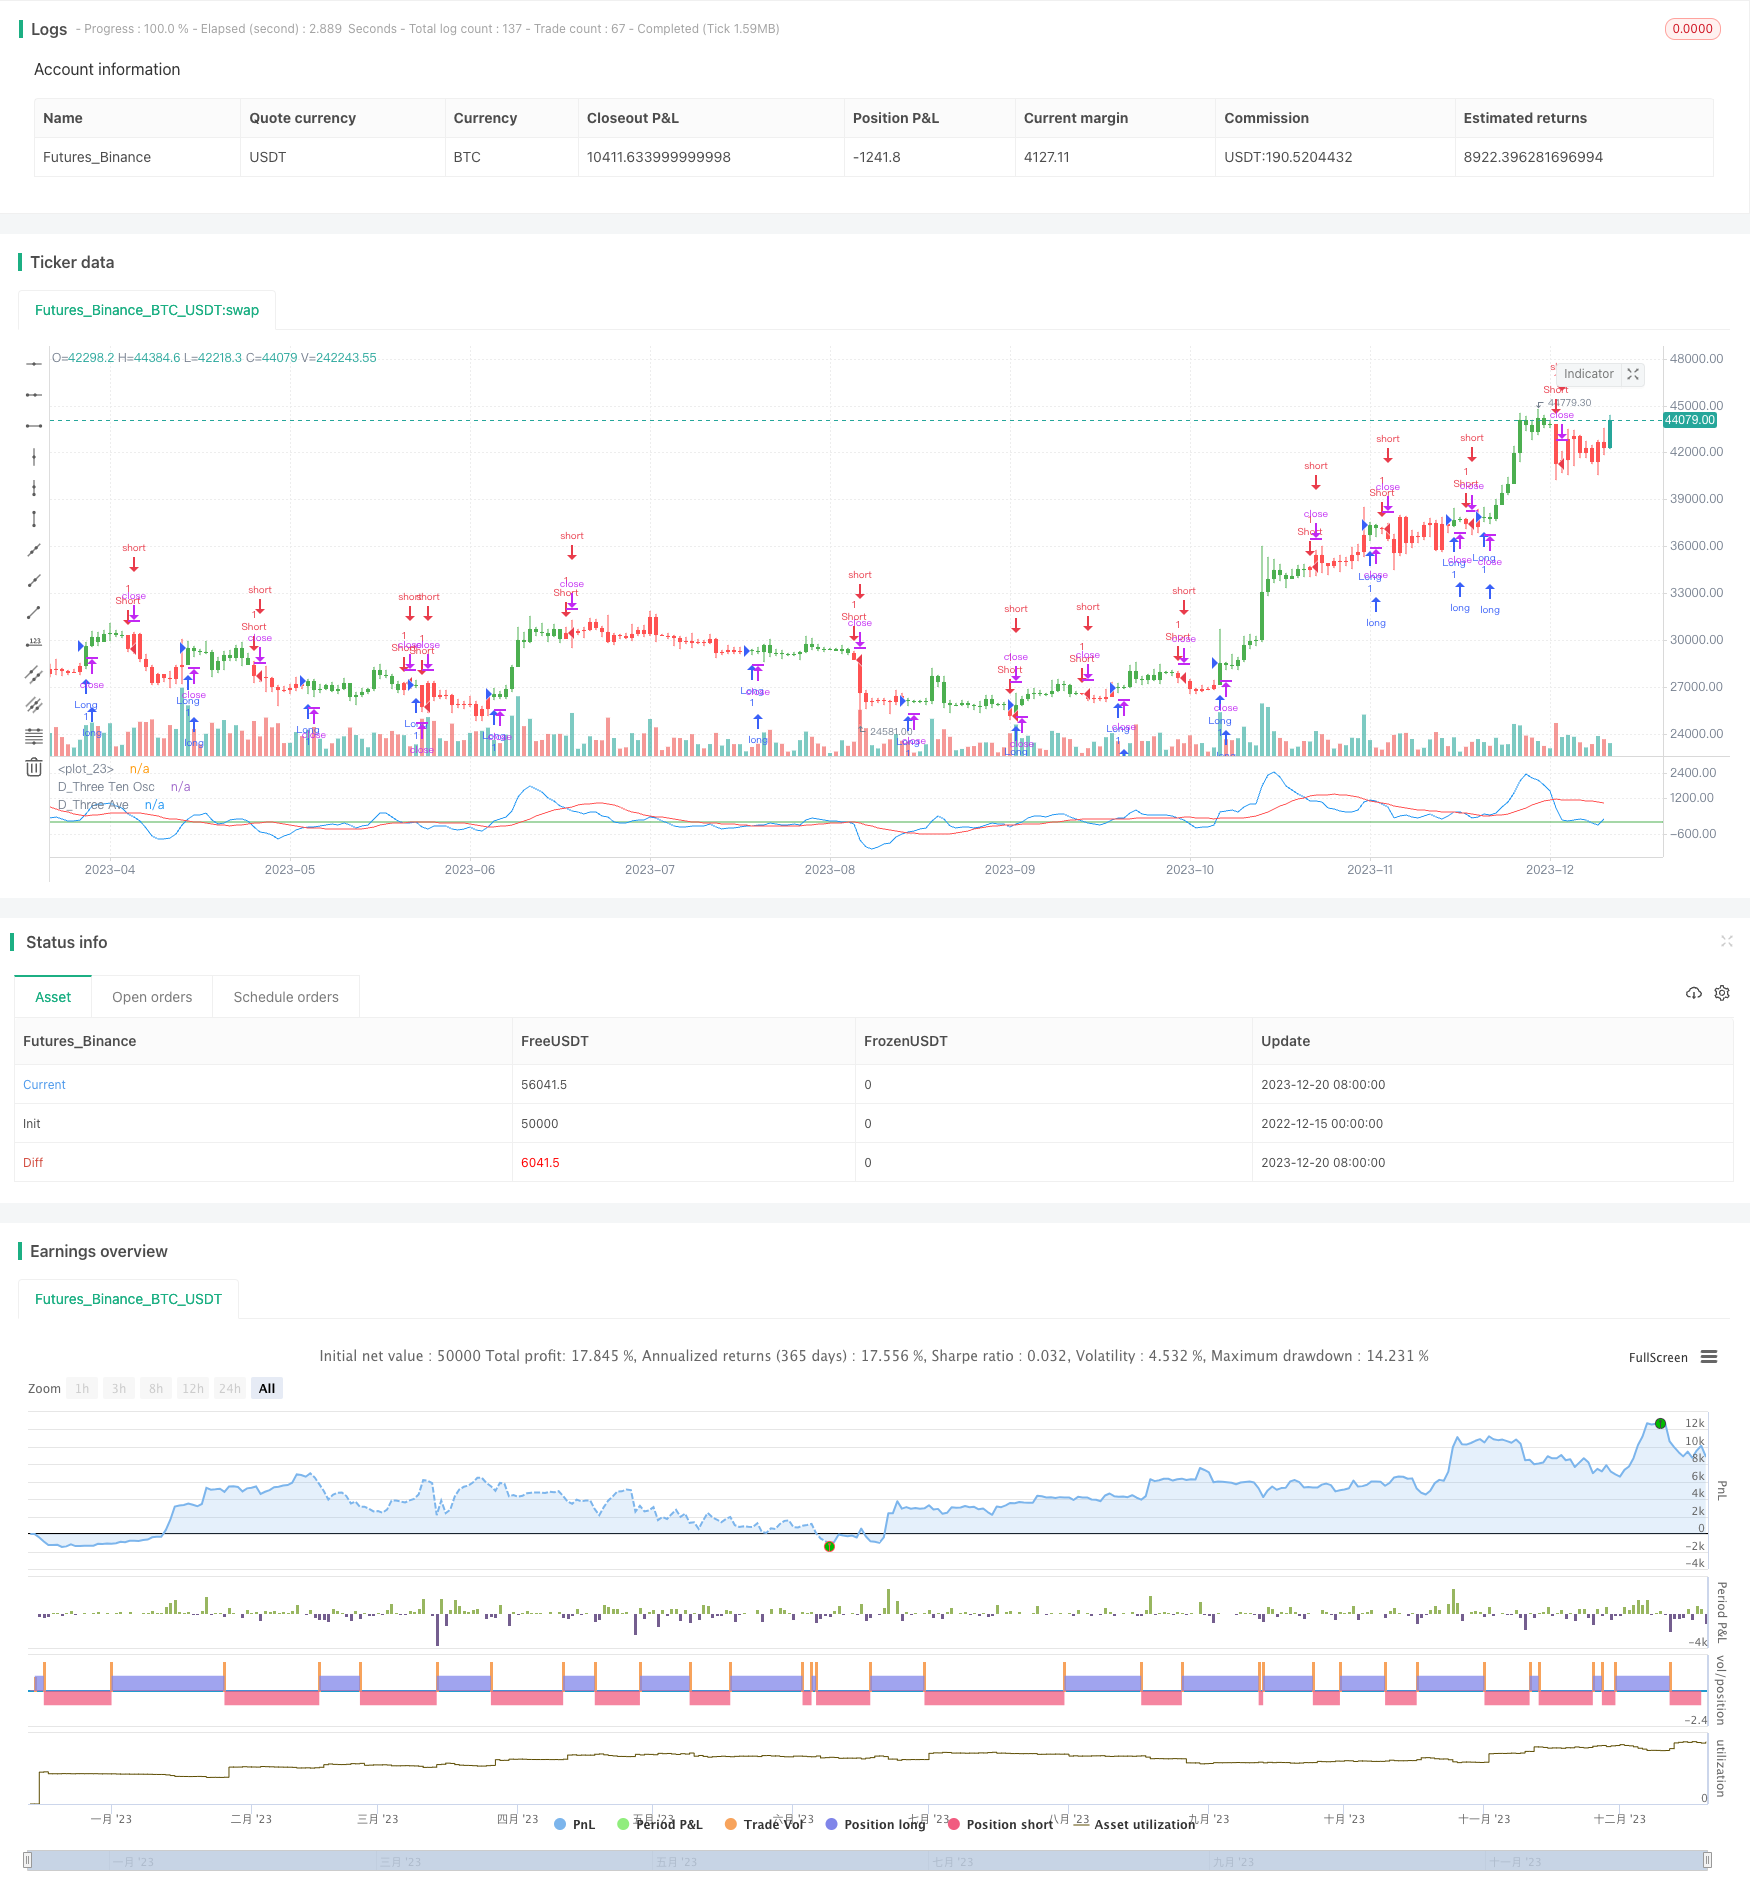
Oscillator Index Transformation Strategy
Author: ChaoZhang, Date: 2023-12-22 14:21:28Tags:

Overview
The Oscillator Index Transformation strategy utilizes the crossovers between Bressert’s 3-10 oscillator index and its 16-day simple moving average to generate trading signals. It is suitable for intraday and overnight trading.
Strategy Logic
The strategy is based on Bressert’s 3-10 oscillator index, which is the difference between 3-day and 10-day exponential moving averages. It goes long when the fast line (3-10 oscillator) crosses above the slow line (16-day SMA), and goes short when the fast line crosses below the slow line.
Specifically, the strategy first calculates the 3-day EMA, 10-day EMA and their difference as the oscillator index. It then calculates the 16-day simple moving average of the oscillator index as the signal line. It goes long when the oscillator index crosses above the signal line and goes short when it crosses below. Reversal trades are allowed.
Advantages Analysis
- Uses the classic Bressert oscillator index which is quite effective
- Forms clear trading signals with fast and slow line crossovers
- Allows reversal trades to adapt to different market regimes
- Can be used in both intraday and overnight trading
Risk Analysis
- Bressert oscillator performance is unstable with profit/loss fluctuations
- Fast and slow line crossovers may generate false signals
- Reversal trades have higher risks and should be used cautiously
- Requires stop loss for intraday and position sizing for overnight trades
Optimization Directions
- Optimize parameters by adjusting moving average periods
- Add filters using other indicators or price action
- Add stop loss strategy to limit single trade loss size
- Optimize capital management to reduce overall drawdown impact
Conclusion
The Oscillator Index Transformation strategy is a short-term trading strategy generating signals from 3-10 oscillator and signal line crossovers. It is simple and practical for both intraday and overnight usage, but has inherent PnL fluctuations and false signals risks. Additional filters, stop loss and position sizing are required to refine the strategy. With proper optimization it can achieve consistent alpha.
/*backtest
start: 2022-12-15 00:00:00
end: 2023-12-21 00:00:00
period: 1d
basePeriod: 1h
exchanges: [{"eid":"Futures_Binance","currency":"BTC_USDT"}]
*/

//@version=2
////////////////////////////////////////////////////////////
//  Copyright by HPotter v1.0 27/03/2017
// TradeStation does not allow the user to make a Multi Data Chart with
// a Tick Bar Chart and any other type a chart. This indicator allows the
// user to plot a daily 3-10 Oscillator on a Tick Bar Chart or any intraday interval.
// Walter Bressert's 3-10 Oscillator is a detrending oscillator derived
// from subtracting a 10 day moving average from a 3 day moving average.
// The second plot is an 16 day simple moving average of the 3-10 Oscillator.
// The 16 period moving average is the slow line and the 3/10 oscillator is
// the fast line.
// For more information on the 3-10 Oscillator see Walter Bressert's book
// "The Power of Oscillator/Cycle Combinations"
//
// You can change long to short in the Input Settings
// Please, use it only for learning or paper trading. Do not for real trading.
////////////////////////////////////////////////////////////
strategy(title="D_Three Ten Osc", shorttitle="D_Three Ten Osc")
Length1 = input(3, minval=1)
Length2 = input(10, minval=1)
Length3 = input(16, minval=1)
reverse = input(false, title="Trade reverse")
hline(0, color=green, linestyle=line)
xPrice =  request.security(syminfo.tickerid,"D", hl2)
xfastMA = ema(xPrice, Length1)
xslowMA = ema(xPrice, Length2)
xMACD = xfastMA - xslowMA
xSignal = sma(xMACD, Length3)
pos = iff(xSignal > xMACD, -1,
	     iff(xSignal < xMACD, 1, nz(pos[1], 0)))
possig = iff(reverse and pos == 1, -1,
          iff(reverse and pos == -1, 1, pos))
if (possig == 1)
    strategy.entry("Long", strategy.long)
if (possig == -1)
    strategy.entry("Short", strategy.short)
barcolor(possig == -1 ? red: possig == 1 ? green : blue )
plot(request.security(syminfo.tickerid, "D", xMACD), color=blue, title="D_Three Ten Osc")
plot(request.security(syminfo.tickerid, "D", xSignal), color=red, title="D_Three Ave")
- Fast Scalping RSI Switching Strategy v1.7
- Moving Average Crossover Quantitative Strategy
- Reversal Breakout Oversold RSI Strategy
- Dual Moving Average Bollinger Band Trend Tracking Strategy
- Sentiment Based XBT Futures Trading Strategy
- Parabolic SAR Momentum Reversal Strategy
- Empirical Mode Decomposition Based Quantitative Trading Strategy
- Dynamic Pyramiding Strategy
- YinYang RSI Volume Trend Trading Strategy
- Quad MA Trend Scalper Strategy
- Golden Cross Dead Cross Dual Moving Average MACD Trend Tracking Strategy
- This is an experimental quantitative trading strategy
- Single Moving Average Crossover Bollinger Bands Strategy
- The RSI breakout strategy is a quantitative trading strategy
- The moving average crossover strategy is a quantitative trading strategy
- Momentum Breakout Moving Average Trading Strategy
- Slow Heiken Ashi Exponential Moving Average Trading Strategy
- High-Performance Algorithmic Trading Strategy Based on Quantitative Models
- Bollinger Momentum Breakout Strategy
- Parabolic SAR and EMA Trend Tracking Strategy