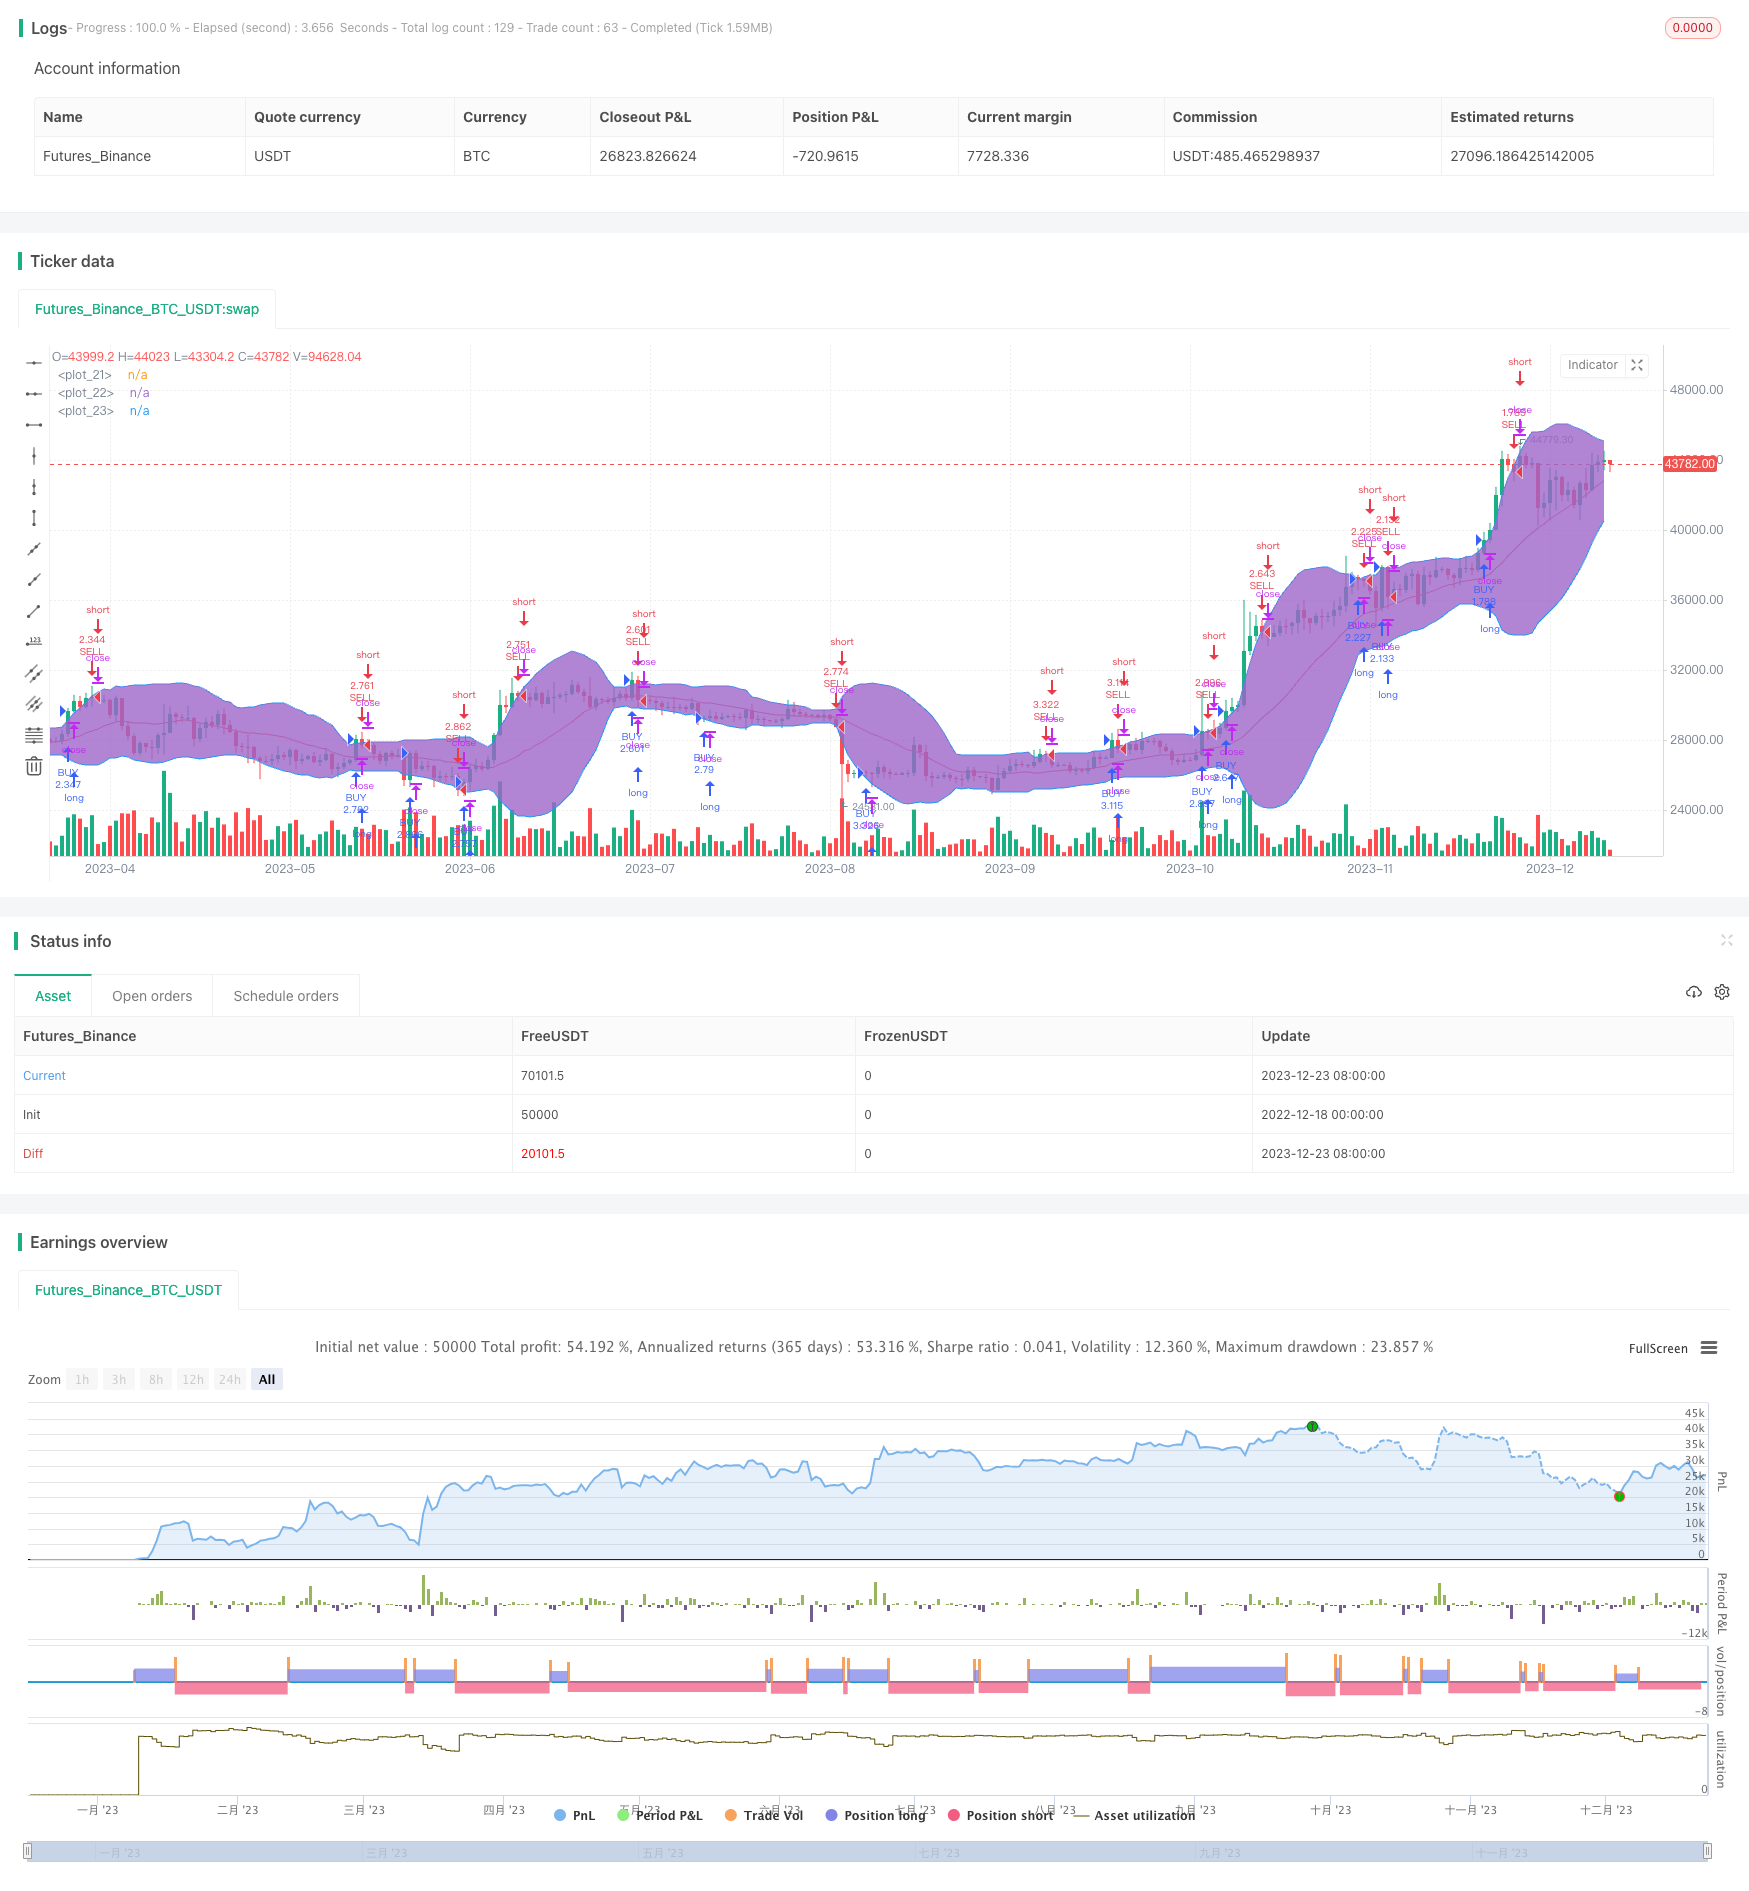
Overview
The Dual Bollinger Band Volatility Tracking strategy is a quantitative trading strategy that captures price volatility by building double Bollinger Bands for tracking. The strategy leverages the upper and lower rails of the Bollinger Bands to capture market volatility opportunities in real time.
Strategy Principle
The strategy first calculates the N-day moving average as the baseline, then calculates the upper and lower rails based on multiples of standard deviation to construct the Bollinger Bands. The strategy employs double Bollinger Bands, where both the upper and lower rails are multiples of the standard deviation. Once the double Bollinger Bands are formed, a buy signal is triggered when the price breaks through the upper rail, and a sell signal is triggered when the price breaks through the lower rail, capturing price volatility opportunities on the Bollinger Bands.
The strategy also sets a time window to make the backtest more TARGET and prevent early data from affecting the test results. The whole strategy workflow is: construct double Bollinger Bands, crossovers of price and rails as trade signals, set time window to avoid impact from early data.
Advantage Analysis
The biggest advantage of this strategy is that it can capture price volatility in real time by breaking through the upper and lower rails of the Bollinger Bands to determine the OPERATION direction. Compared with other indicators, Bollinger Bands react to the market more sensitively and can form trade signals within a shorter period of time. In addition, the double Bollinger Bands set a wider channel so that the likelihood of price breakout is greater, allowing the strategy to capture more trading opportunities.
Risk Analysis
The main risks of this strategy lie in the parameter settings of the N-day period and standard deviation multiples that construct the Bollinger Bands. If the parameters are not set appropriately, it will lead to Bollinger Bands that are too wide or too narrow, thus missing trade opportunities or generating false signals. In addition, no stop loss is set for the dual-directional trading, which may lead to enlarged losses.
The solutions are to optimize the parameters and evaluate the shape of Bollinger Bands in real time; also, to set up stop loss strategies based on historical data to control single loss.
Optimization Directions
The main aspects to optimize for this strategy:
Optimize parameters of the Bollinger Bands, adjust N-day period and standard deviation multiples to better suit different market characteristics.
Increase order renewal mechanisms to place additional orders after some profit is captured from original orders, so as to expand profit space.
Set up stop loss strategies so as to exit positions when prices break through the upper or lower rails of the Bollinger Bands in unfavorable directions, controlling losses.
Incorporate other indicators to screen signals and avoid false signals in volatile markets.
Conclusion
The Dual Bollinger Band Volatility Tracking strategy captures price volatility in real time by constructing double-sided Bollinger Bands, being able to seize more short-term trading opportunities. The advantages of this strategy are sensitivity to market changes and fast signal generation. The main risks come from inappropriate parameter settings and lack of stop loss. We can make the strategy more stable and efficient through multi-dimensional optimization.
/*backtest
start: 2022-12-18 00:00:00
end: 2023-12-24 00:00:00
period: 1d
basePeriod: 1h
exchanges: [{"eid":"Futures_Binance","currency":"BTC_USDT"}]
*/

//@version=3
strategy("BB_BB", overlay=true,default_qty_type=strategy.percent_of_equity, default_qty_value=100.0, pyramiding=0)
length = input(20, minval=1)
src = input(close, title="Source")
mult = input(2.0, minval=0.001, maxval=50)
FromMonth = input(defval = 1, title = "From Month", minval = 1, maxval = 12)
FromDay = input(defval = 1, title = "From Day", minval = 1, maxval = 31)
FromYear = input(defval = 2017, title = "From Year", minval = 2017)
ToMonth = input(defval = 1, title = "To Month", minval = 1, maxval = 12)
ToDay = input(defval = 1, title = "To Day", minval = 1, maxval = 31)
ToYear = input(defval = 9999, title = "To Year", minval = 2017)
start = timestamp(FromYear, FromMonth, FromDay, 00, 00) // backtest start window
finish = timestamp(ToYear, ToMonth, ToDay, 23, 59) // backtest finish window
window() => true // create function "within window of time"


basis = sma(src, length)
dev = mult * stdev(src, length)
upper = basis + dev
lower = basis - dev
plot(basis, color=red)
p1 = plot(upper, color=blue)
p2 = plot(lower, color=blue)
fill(p1, p2)

buy = crossover(sma(close,1), upper) or crossover(sma(close,1), lower)
sell = crossunder(sma(close,1), upper) or crossunder(sma(close,1), lower)

if(buy)
    strategy.entry("BUY", strategy.long, when = window())
if(sell)
    strategy.entry("SELL", strategy.short, when = window())