Single-Side Entry Strategy Based on Moving Average
Author: ChaoZhang, Date: 2023-12-25 14:09:49Tags:

Overview
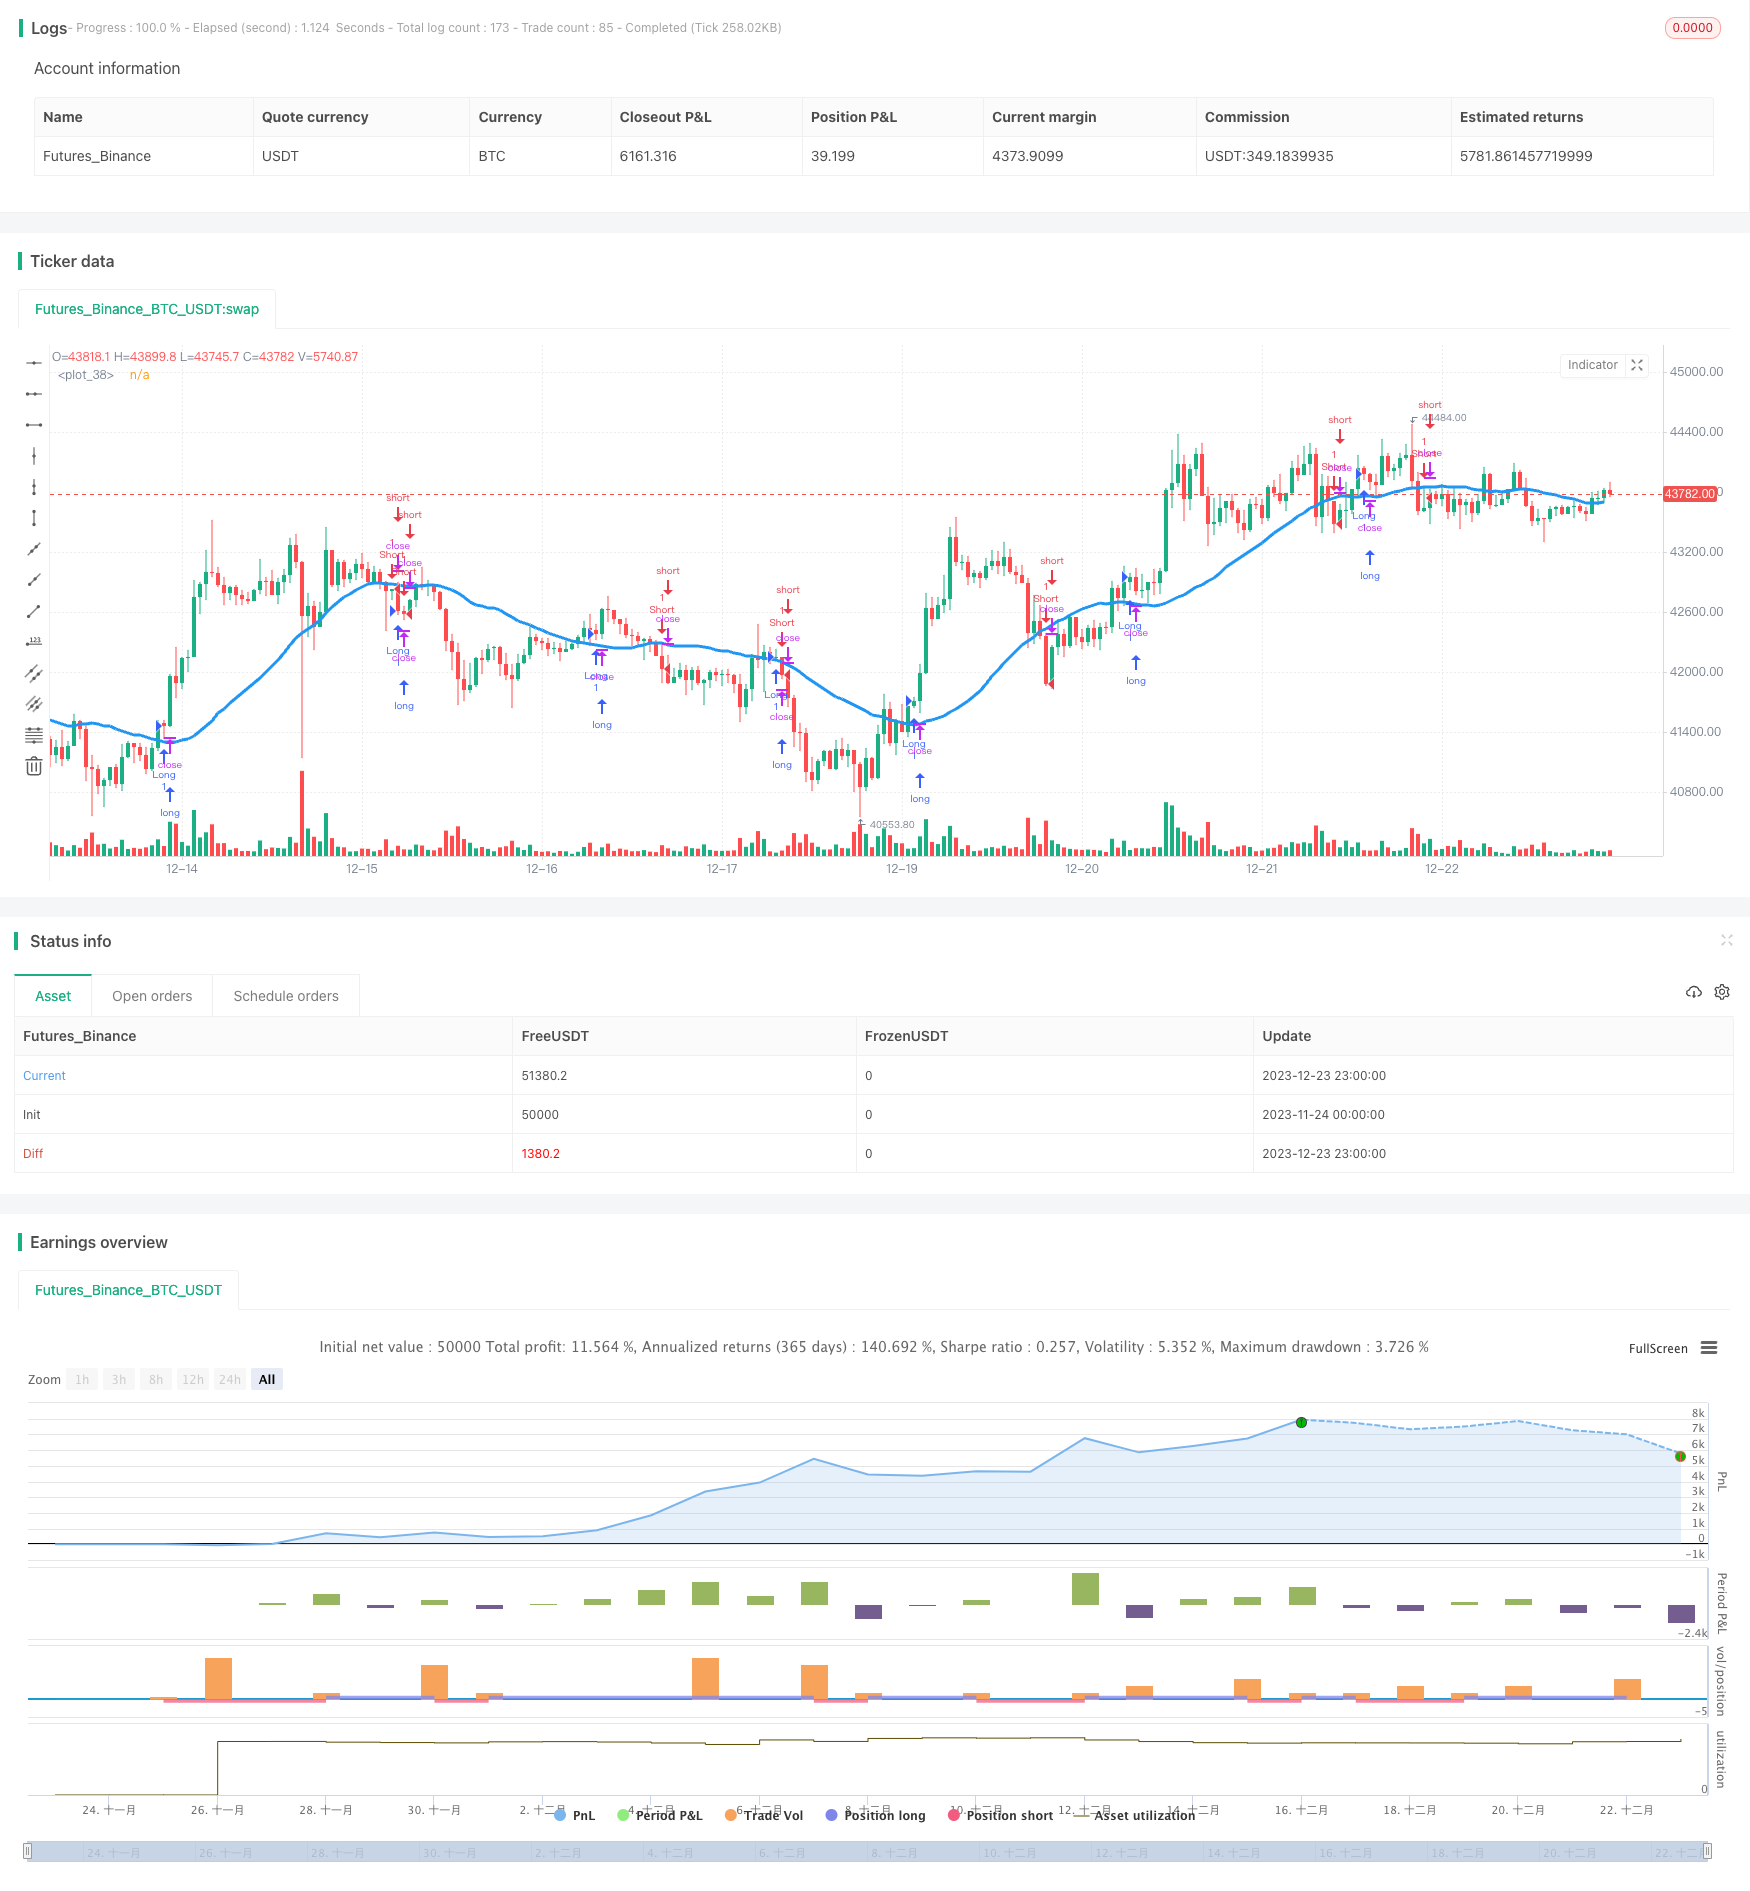
This strategy calculates different types of moving averages to determine the price trend direction and implement single-side entry. It opens long or short positions when the price breaks through the moving average.
Strategy Principle
The strategy allows selecting from 7 different moving average types, including Simple Moving Average (SMA), Exponential Moving Average (EMA), Volume-Weighted Moving Average (VWMA), Double Exponential Moving Average (DEMA), Triple Exponential Moving Average (TEMA), Kaufman’s Adaptive Moving Average (KAMA) and Price Channel Middle Line. It judges the price trend direction based on the relationship between the selected moving average and the closing price.
When the closing price breaks through the moving average line upward, it is judged as an uptrend and a long position is opened. When the closing price breaks through the moving average line downward, it is judged as a downtrend and a short position is opened. This can capture turning points in the price trend and achieve single-side entry.
Advantage Analysis
The advantages of this strategy are:
-
Various types of moving averages can be selected for flexibility to suit different products and cycles.
-
Single-side entry can effectively control risks.
-
Entry in the trending direction is easy to profit.
-
It is easy to understand and implement.
Risk Analysis
There are also some risks with this strategy:
-
When the price oscillates around the moving average line, there will be multiple false signals and reverse entry positions. Proper stop loss should be set to control risks.
-
It cannot completely avoid risks caused by rapid up or down price movements. Other indicators should be combined to determine the trend signal.
-
The analyst needs to select appropriate moving average parameters. Unsuitable parameters can easily lead to lagging of the trading signals.
Optimization Directions
The strategy can be optimized from the following aspects:
-
Combine with other technical indicators such as MACD, RSI to judge the trend signal and form a trading combination.
-
Add stop loss logic, such as trailing stop loss or pending order stop loss.
-
Test and optimize parameters like moving average period, moving average type to find the optimal parameter combination.
-
Consider using MarketIfTouched order type for entry, to follow the trend.
Summary
The strategy determines the price trend direction based on moving averages, and implements single-side entry. It is simple to use and implement, and can effectively control risks. But there are also risks of false signals and reverse entries. It can be continually improved by combining other signal indicators, optimizing parameters, adding stop loss, to make the strategy more stable and reliable.
/*backtest
start: 2023-11-24 00:00:00
end: 2023-12-24 00:00:00
period: 1h
basePeriod: 15m
exchanges: [{"eid":"Futures_Binance","currency":"BTC_USDT"}]
*/

//@version=2
strategy(title = "Noro's MAs Tests v1.1", shorttitle = "MAs tests 1.1", overlay=true, default_qty_type = strategy.percent_of_equity, default_qty_value=100.0, pyramiding=0)

needlong = input(true, "long")
needshort = input(true, "short")
len = input(30, defval = 30, minval = 2, maxval = 1000, title = "MA length")
type = input(1, defval = 1, minval = 1, maxval = 7, title = "Type")
src = input(close, defval = close, title = "Source")
anti = input(true, defval = true, title = "Antipila")

//DEMA
dema = 2 * ema(src, len) - ema(ema(close, len), len)

//TEMA
xPrice = close
xEMA1 = ema(src, len)
xEMA2 = ema(xEMA1, len)
xEMA3 = ema(xEMA2, len)
tema = 3 * xEMA1 - 3 * xEMA2 + xEMA3

//KAMA
xvnoise = abs(src - src[1])
nfastend = 0.20
nslowend = 0.05
nsignal = abs(src - src[len])
nnoise = sum(xvnoise, len)
nefratio = iff(nnoise != 0, nsignal / nnoise, 0)
nsmooth = pow(nefratio * (nfastend - nslowend) + nslowend, 2)
kama = nz(kama[1]) + nsmooth * (src - nz(kama[1]))

//PriceChannel
lasthigh = highest(src, len)
lastlow = lowest(src, len)
center = (lasthigh + lastlow) / 2

ma = type == 1 ? sma(src, len) : type == 2 ? ema(src, len) : type == 3 ? vwma(src, len) : type == 4 ? dema : type == 5 ? tema : type == 6 ? kama : type == 7 ? center : 0

plot(ma, color = blue, linewidth = 3, transp = 0)

trend = anti == false and close > ma ? 1 : anti == false and close < ma ? -1 : low > ma ? 1 : high < ma ? -1 : trend[1]

longCondition = trend == 1 and trend[1] == -1
if (longCondition)
    strategy.entry("Long", strategy.long, needlong == false ? 0 : na)

shortCondition = trend == -1 and trend[1] == 1
if (shortCondition)
    strategy.entry("Short", strategy.short, needshort == false ? 0 : na)
- Dual Moving Average Momentum Squeeze Strategy
- SMA Crossover Trading Strategy
- Based on Weighted Moving Average Strategy
- Dual Moving Average Crossover Strategy
- Trend Reversal Trading Strategy Based on EMA Crossover
- RSI Based Bullish Trend Following Strategy
- Multi Timeframe Oscillation Channel Trend Tracking Strategy
- Low Lag Triple Moving Average Fast Trading Strategy
- Trend Following Strategy Based on Multi Timeframe TEMA Crossover
- Dynamic Balancing Strategy with 50% Funds and 50% Positions
- Adaptive Multi Timeframe Fibonacci Retracement Trading Strategy
- Oscillating Long-Short RSI Crypto Switching Strategy
- Trend Trading Strategy Based on Triple Hull Moving Averages and Ichimoku Kinko Hyo
- Dynamic Moving Averages and Keltner Channel Trading Strategy
- Trend Following Strategy Based on RSI and Weighted Moving Average
- Dual Moving Average Reversal Strategy
- Double Bollinger Bands Breakout Strategy
- Keltner Channel Tracking Strategy
- Price Volume Trend Strategy
- KST policy