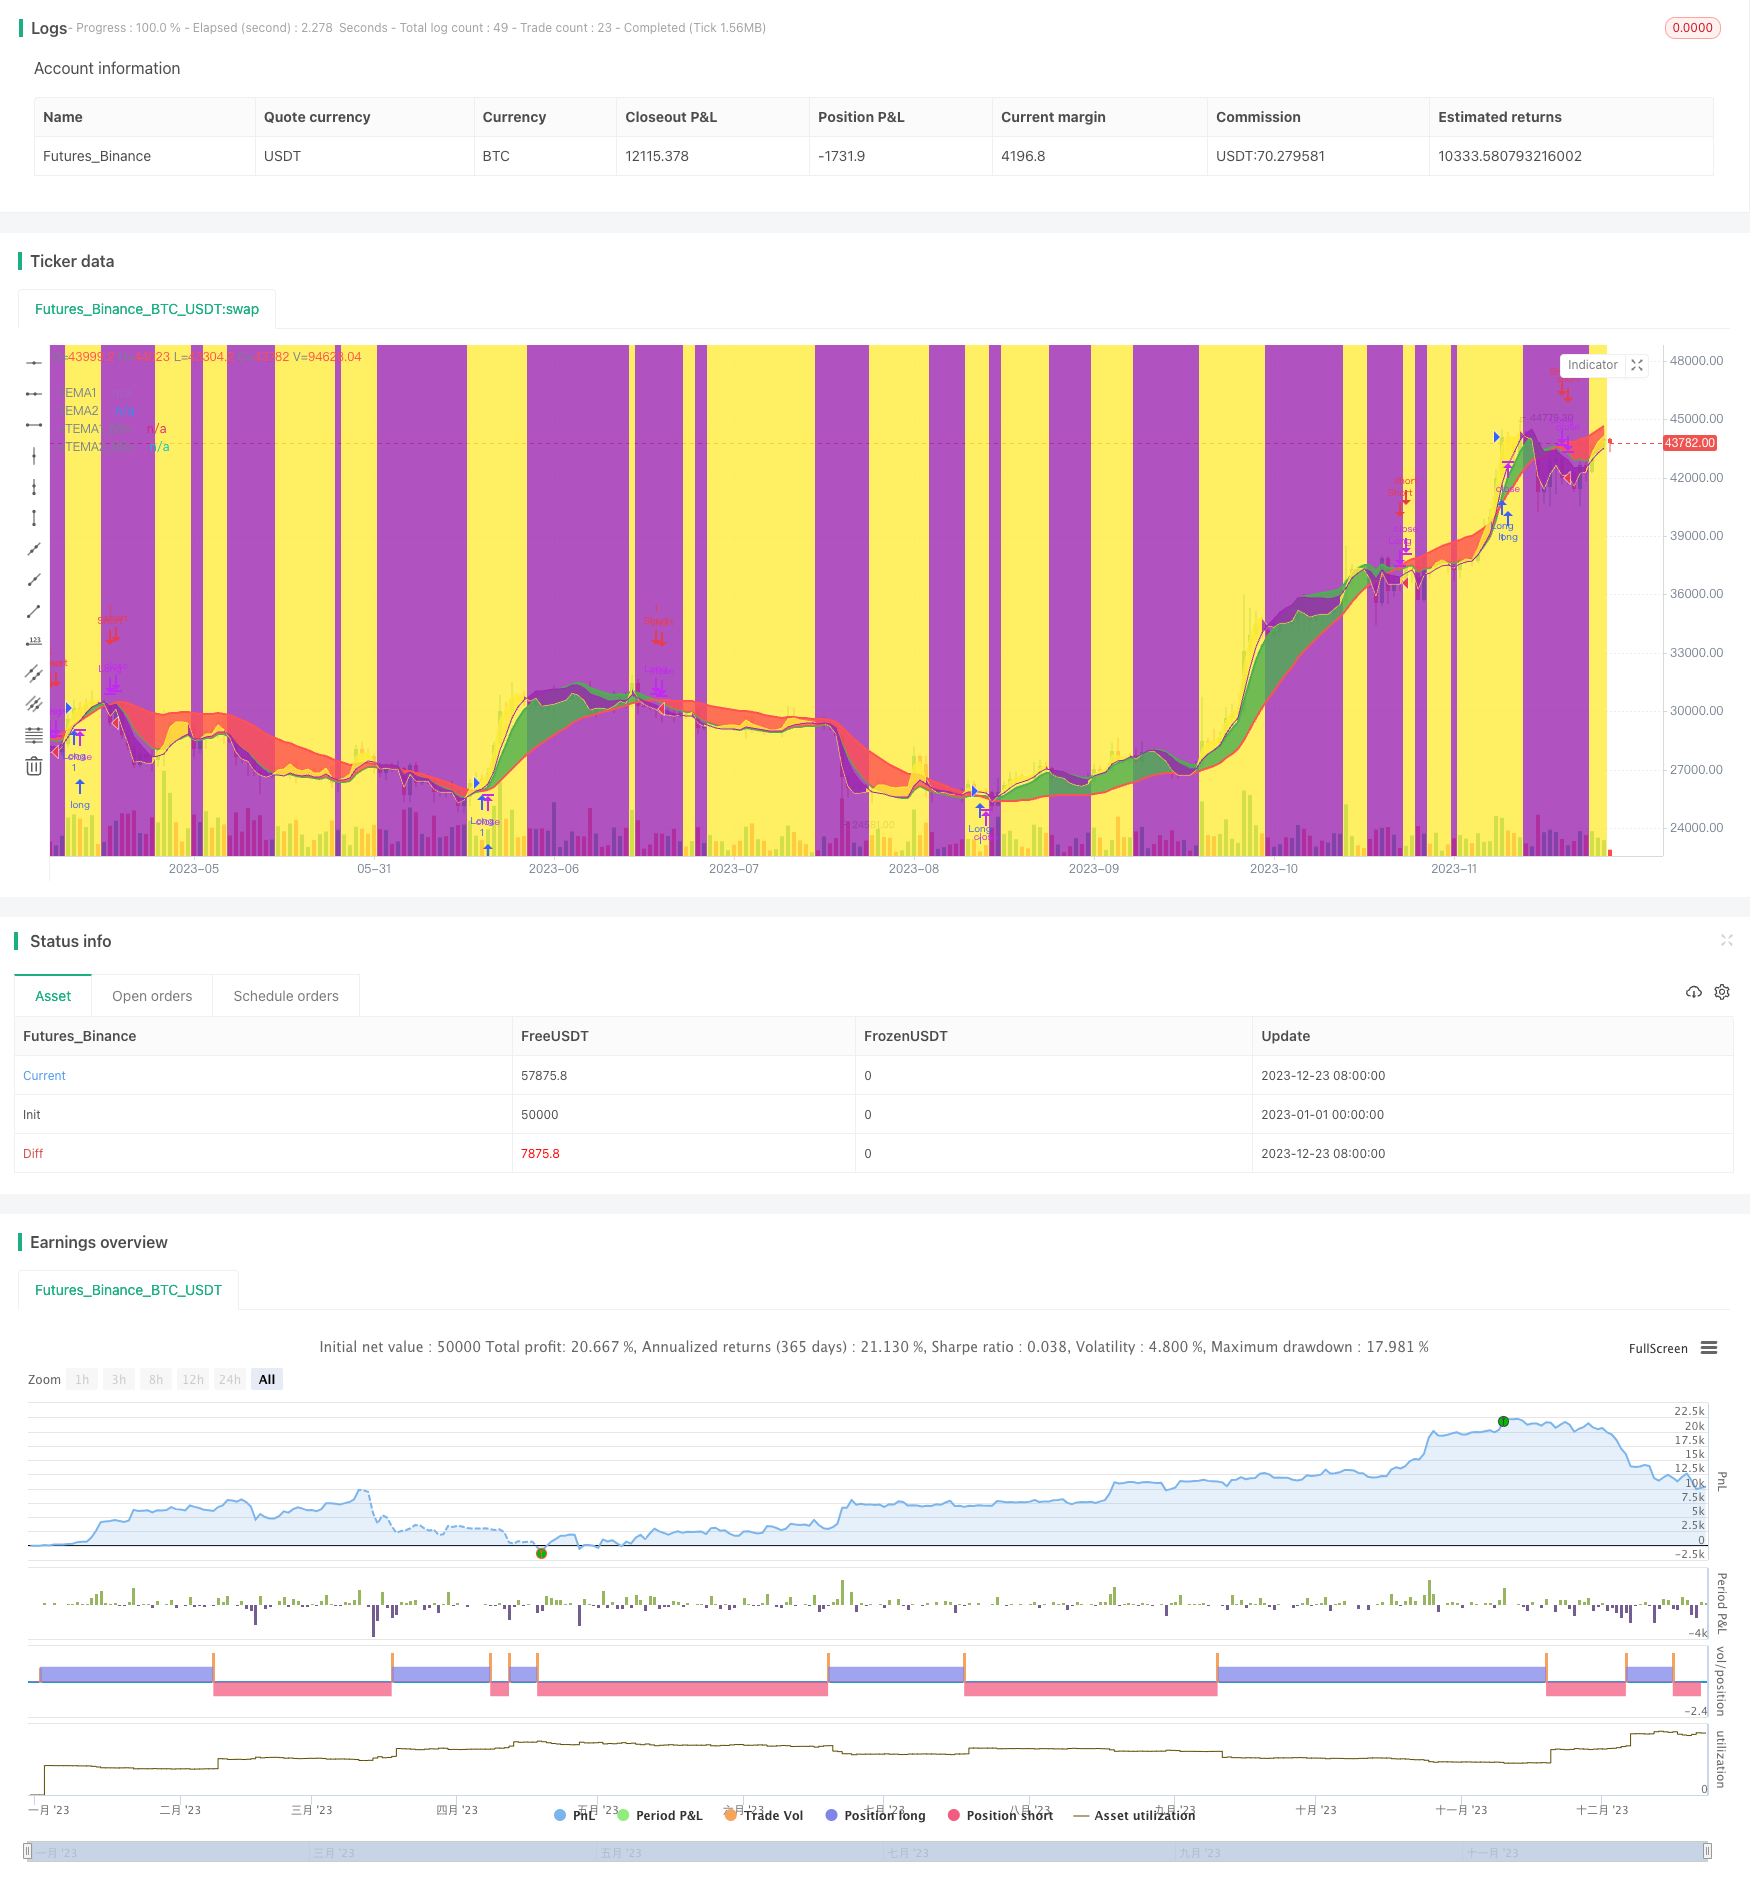
Trend Following Strategy Based on Multi Timeframe TEMA Crossover
Author: ChaoZhang, Date: 2023-12-25 14:20:36Tags:

Overview
This strategy identifies market trend direction based on the crossover of TEMA indicator across multiple timeframes, and uses TEMA crossover in lower timeframe to find specific entry and exit points. The strategy can be configured for long only, short only or both directions.
Strategy Logic
The strategy employs two TEMA indicators, one with fast and slow line based on 5 and 15 periods, the other based on user-defined higher timeframe such as daily or weekly. The crossover of higher timeframe TEMA determines overall trend bias, with fast line crossing above slow line indicating bullish view, and below indicating bearish view. The lower timeframe TEMA crossover is used to find concrete entry and exit timing.
When higher timeframe TEMA fast line crosses above slow line, a long entry can be triggered when lower timeframe TEMA fast line crosses above slow line; An exit signal is given when fast line crosses below slow line. Similarly, when higher timeframe fast line drops below slow line, a short entry is triggered on lower timeframe TEMA bearish crossover and exit when a bullish crossover happens.
Advantages
- Based on TEMA crossover, avoids noise interference
- Multi timeframe design combines high and lower cycles, improving accuracy
- Flexible configuration for long only, short only or both directions
- Simple rules, easy to understand and implement
Risk Analysis
- TEMA has lagging effect, may miss initial price change
- Short term corrections on higher TF may cause unnecessary reverse trades
- Improper higher TF setting fails to reflect real trend
- Improper lower TF setting increases stop loss risk
Risk Solutions:
- Fine tune TEMA parameters for balance
- Relax stop loss margin moderately
- Optimize high low cycle settings
- Test parameter robustness across products
Enhancement Opportunities
- Dynamically adjust TEMA parameters for sensitivity optimization
- Add momentum filter to avoid missing trends
- Add volatility index for dynamic stop loss sizing
- Machine learning for parameter optimization
Summary
The strategy overall is simple and clear in logic, identifying trend bias via TEMA crossover on multiple timeframes, and relying on additional crossover on lower TF to time entries. It has certain merits while also has some space for improvements. On the whole, it provides valuable reference for quant trading practices.
/*backtest
start: 2023-01-01 00:00:00
end: 2023-12-24 00:00:00
period: 1d
basePeriod: 1h
exchanges: [{"eid":"Futures_Binance","currency":"BTC_USDT"}]
*/

// This source code is subject to the terms of the Mozilla Public License 2.0 at https://mozilla.org/MPL/2.0/
// © Seltzer_

//@version=4
strategy(title="TEMA Cross +HTF Backtest", shorttitle="TEMA_X_+HTF_BT", overlay=true)

orderType = input("Longs+Shorts",title="What type of Orders", options=["Longs+Shorts","LongsOnly","ShortsOnly"])
isLong   = (orderType != "ShortsOnly")
isShort  = (orderType != "LongsOnly")

// Backtest Section {

// Backtest inputs
FromMonth = input(defval=1, title="From Month", minval=1, maxval=12)
FromDay = input(defval=1, title="From Day", minval=1, maxval=31)
FromYear = input(defval=2020, title="From Year", minval=2010)
ToMonth = input(defval=1, title="To Month", minval=1, maxval=12)
ToDay = input(defval=1, title="To Day", minval=1, maxval=31)
ToYear = input(defval=9999, title="To Year", minval=2017)

// Define backtest timewindow
start = timestamp(FromYear, FromMonth, FromDay, 00, 00)  // backtest start window
finish = timestamp(ToYear, ToMonth, ToDay, 23, 59)  // backtest finish window
window() => true

// }

//TEMA Section {

//LTF Section
xLength = input(20, minval=1, title="Fast Length")
xPrice = close
xEMA1 = ema(xPrice, xLength)
xEMA2 = ema(xEMA1, xLength)
xEMA3 = ema(xEMA2, xLength)
xnRes = (3 * xEMA1) - (3 * xEMA2) + xEMA3
xnResP = plot(xnRes, color=color.green, linewidth=2, title="TEMA1")

yLength = input(60, minval=1, title="Slow Length")
yPrice = close
yEMA1 = ema(yPrice, yLength)
yEMA2 = ema(yEMA1, yLength)
yEMA3 = ema(yEMA2, yLength)
ynRes = (3 * yEMA1) - (3 * yEMA2) + yEMA3
ynResP = plot(ynRes, color=color.red, linewidth=2, title="TEMA2")

fill(xnResP, ynResP, color=xnRes > ynRes ? color.green : color.red, transp=65, editable=true)

//HTF Section
HTFres = input(defval="D", type=input.resolution, title="HTF Resolution")

HTFxLength = input(5, minval=1, title="HTF Fast Length")
HTFxPrice = close
HTFxEMA1 = security(syminfo.tickerid, HTFres, ema(HTFxPrice, HTFxLength), barmerge.gaps_off, barmerge.lookahead_on)
HTFxEMA2 = security(syminfo.tickerid, HTFres, ema(HTFxEMA1, HTFxLength), barmerge.gaps_off, barmerge.lookahead_on)
HTFxEMA3 = security(syminfo.tickerid, HTFres, ema(HTFxEMA2, HTFxLength), barmerge.gaps_off, barmerge.lookahead_on)
HTFxnRes = (3 * HTFxEMA1) - (3 * HTFxEMA2) + HTFxEMA3
HTFxnResP = plot(HTFxnRes, color=color.yellow, linewidth=1,transp=30, title="TEMA1")

HTFyLength = input(15, minval=1, title="HTF Slow Length")
HTFyPrice = close
HTFyEMA1 = security(syminfo.tickerid, HTFres, ema(HTFyPrice, HTFyLength), barmerge.gaps_off, barmerge.lookahead_on)
HTFyEMA2 = security(syminfo.tickerid, HTFres, ema(HTFyEMA1, HTFyLength), barmerge.gaps_off, barmerge.lookahead_on)
HTFyEMA3 = security(syminfo.tickerid, HTFres, ema(HTFyEMA2, HTFyLength), barmerge.gaps_off, barmerge.lookahead_on)
HTFynRes = (3 * HTFyEMA1) - (3 * HTFyEMA2) + HTFyEMA3
HTFynResP = plot(HTFynRes, color=color.purple, linewidth=1, transp=30, title="TEMA2")

fill(HTFxnResP, HTFynResP, color=HTFxnRes > HTFynRes ? color.yellow : color.purple, transp=90, editable=true)
bgcolor(HTFxnRes > HTFynRes ? color.yellow : na, transp=90, editable=true)
bgcolor(HTFxnRes < HTFynRes ? color.purple : na, transp=90, editable=true)

// }

// Buy and Sell Triggers
LongEntryAlert = xnRes > ynRes and HTFxnRes > HTFynRes and window()
LongCloseAlert = xnRes < ynRes and window()
ShortEntryAlert = xnRes < ynRes and HTFxnRes < HTFynRes and window()
ShortCloseAlert = xnRes > ynRes

// Entry & Exit signals
if isLong
    strategy.entry("Long", strategy.long, when = LongEntryAlert)
    strategy.close("Long", when = LongCloseAlert)

if isShort
    strategy.entry("Short", strategy.short, when = ShortEntryAlert)
    strategy.close("Short", when = ShortCloseAlert)
- Turtle Trading Strategy
- Dual Moving Average Tracking Strategy
- Dual Moving Average Momentum Squeeze Strategy
- SMA Crossover Trading Strategy
- Based on Weighted Moving Average Strategy
- Dual Moving Average Crossover Strategy
- Trend Reversal Trading Strategy Based on EMA Crossover
- RSI Based Bullish Trend Following Strategy
- Multi Timeframe Oscillation Channel Trend Tracking Strategy
- Low Lag Triple Moving Average Fast Trading Strategy
- Dynamic Balancing Strategy with 50% Funds and 50% Positions
- Single-Side Entry Strategy Based on Moving Average
- Adaptive Multi Timeframe Fibonacci Retracement Trading Strategy
- Oscillating Long-Short RSI Crypto Switching Strategy
- Trend Trading Strategy Based on Triple Hull Moving Averages and Ichimoku Kinko Hyo
- Dynamic Moving Averages and Keltner Channel Trading Strategy
- Trend Following Strategy Based on RSI and Weighted Moving Average
- Dual Moving Average Reversal Strategy
- Double Bollinger Bands Breakout Strategy
- Keltner Channel Tracking Strategy