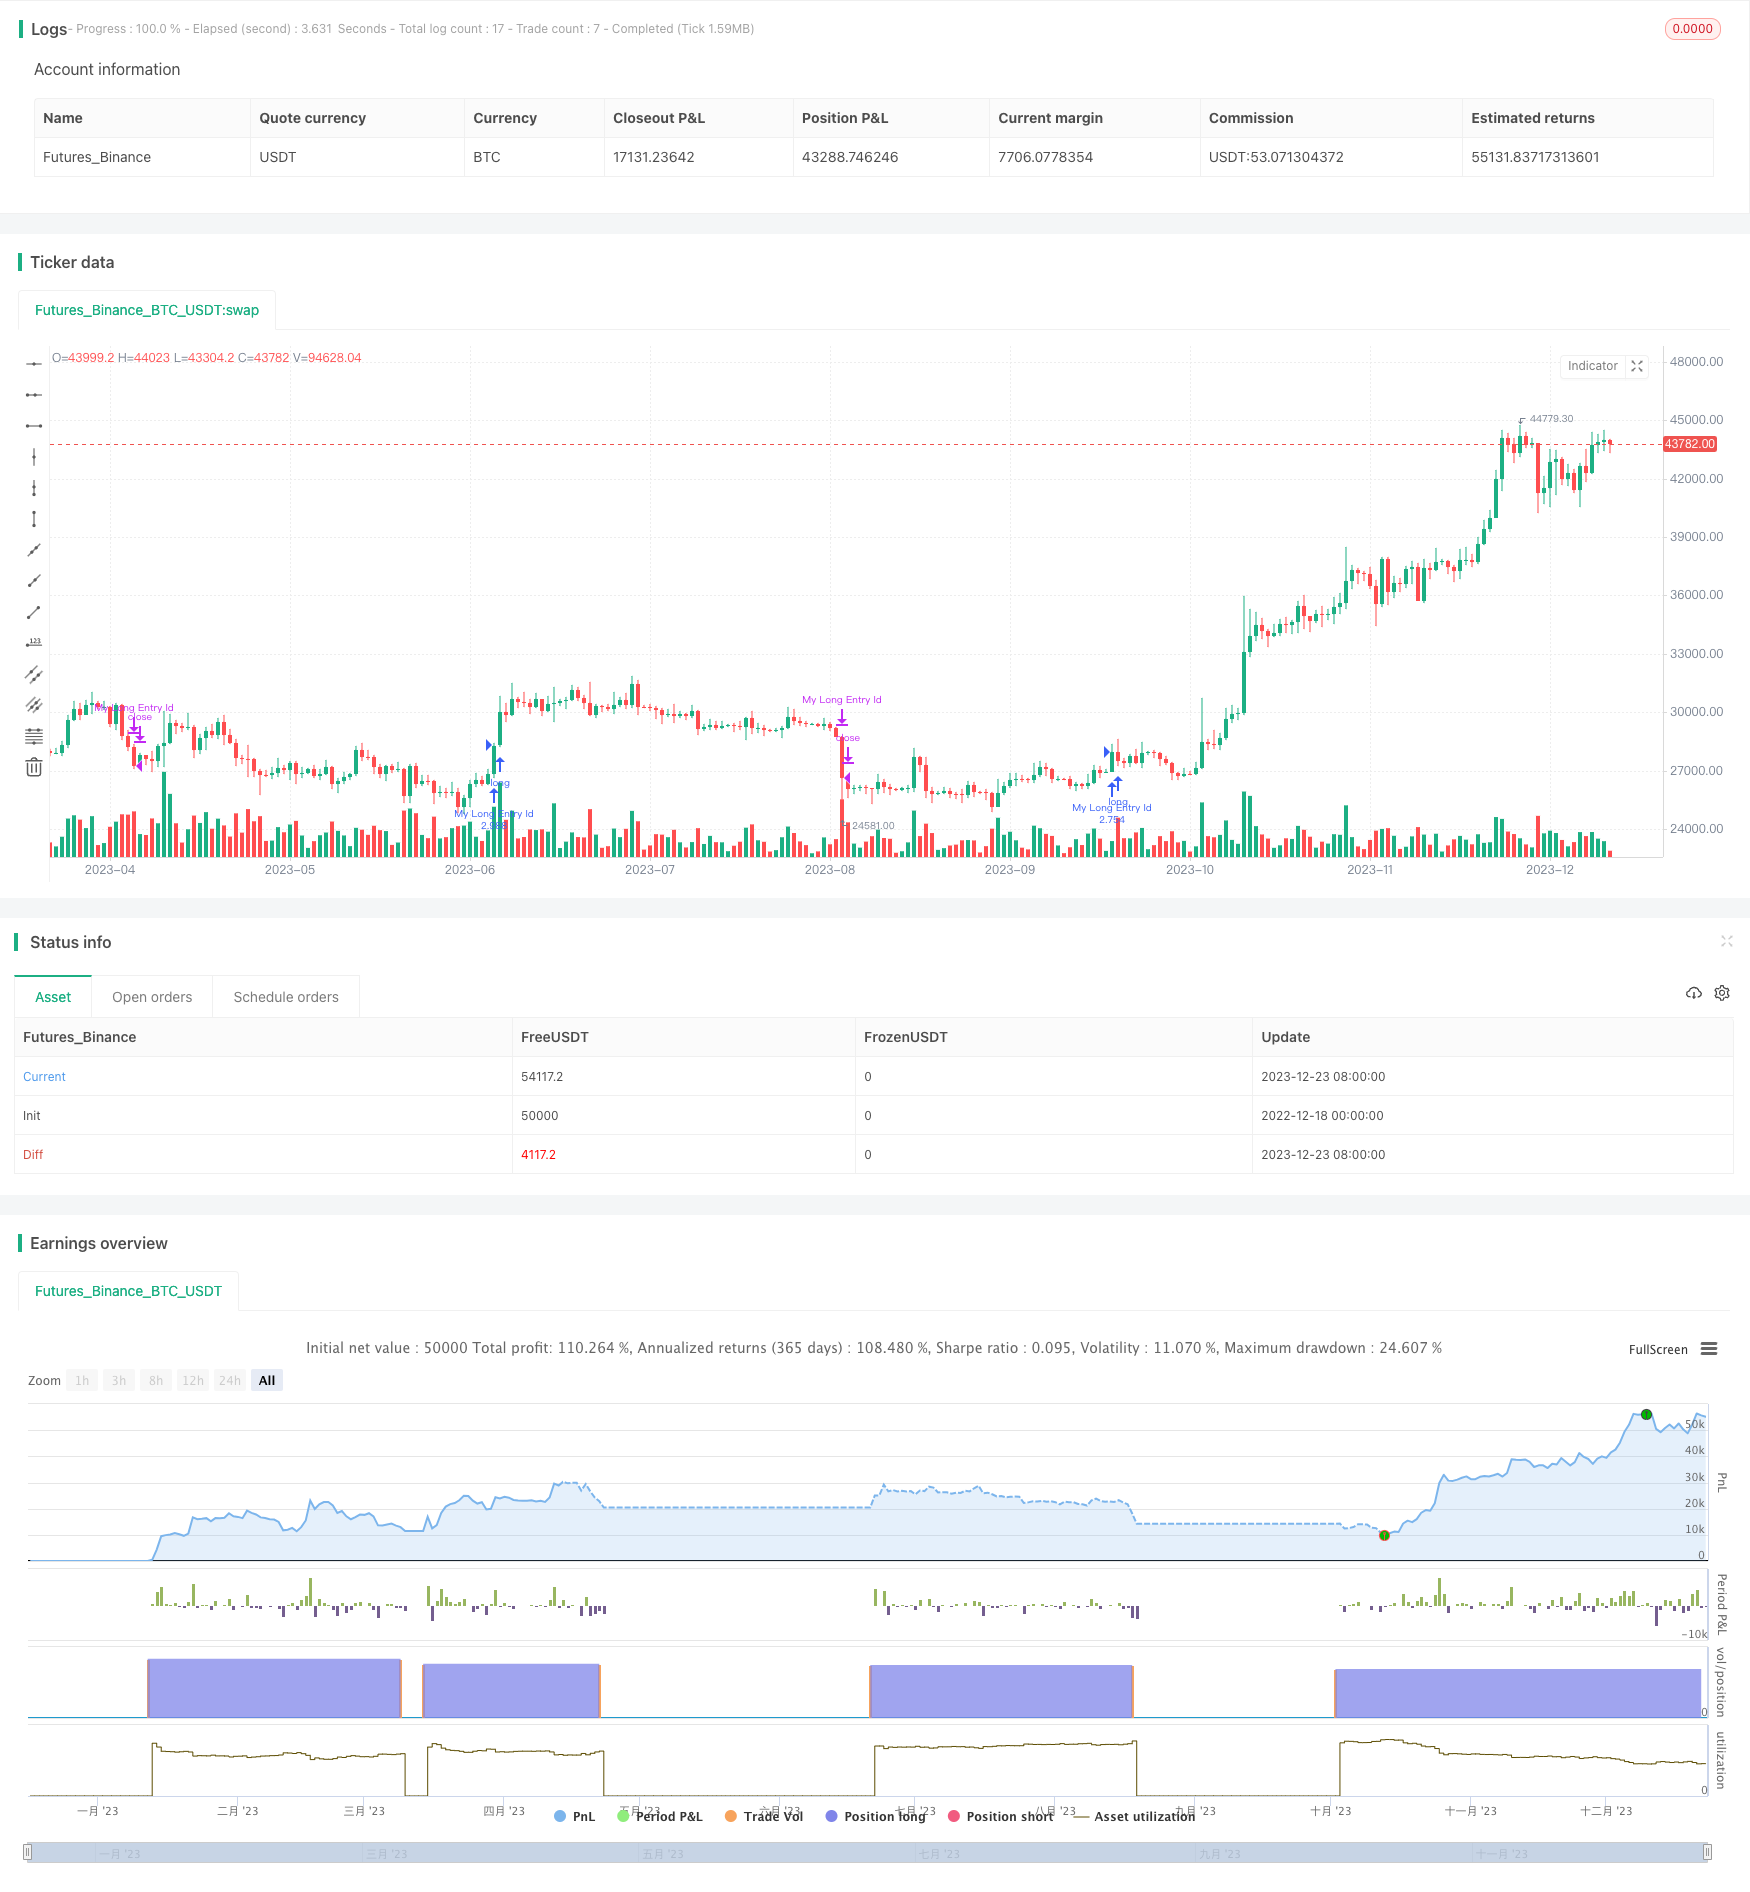
Overview
The Dual Moving Average Tracking strategy is a quantitative trading strategy based on moving average indicators. This strategy mainly utilizes the golden cross and death cross of moving averages to generate buy and sell signals. When the short-term moving average crosses above the longer-term moving average from below, a golden cross signal is generated. When the short-term moving average crosses below the longer-term moving average from above, a death cross signal is generated. This strategy also incorporates the RSI indicator and the ADX indicator to determine the direction and strength of the trend and enter when the trend is strong.
Strategy Principle
This strategy is mainly based on three technical indicators:
Supertrend: Used to judge the main trend direction of prices. When the Supertrend indicator direction changes, it is judged as an inflection point in the price trend and a trading signal is issued.
RSI Indicator (Relative Strength Index): An oscillating indicator used to judge overbought and oversold conditions. This strategy issues trading signals when the RSI indicator shows that prices are overbought or oversold in the short term.
ADX Indicator (Average Directional Indicator): Used to judge the strength of the trend. This strategy incorporates ADX to judge the trend strength and chooses to enter when the trend is strong.
When the Supertrend indicator direction changes, it means the price trend has reversed. At the same time, the RSI indicator shows an overbought/oversold phenomenon, indicating a turnaround in short-term supply and demand relationships, and prices may reverse. In addition, the ADX indicator shows that the trend strength is large. This provides an opportunity for this strategy to enter. Specifically, when Supertrend direction changes, RSI shows oversold, and ADX>20, a long signal is issued. When Supertrend direction changes and RSI shows overbought, a closing signal is issued.
Advantages of the Strategy
Using a dual moving average system can effectively track changes in price trends and profit from the trend.
Incorporating the RSI indicator to judge overbought and oversold conditions avoids chasing highs and selling lows at price reversal points.
The ADX indicator judges the strength of the trend, so that this strategy mainly acts when the trend is strong, profiting from the major trend.
The strategy parameters have been optimized and tested to show good performance.
Risks and Solutions
The dual moving average strategy itself is quite sensitive to price changes, which may generate more trading signals. The solution is to appropriately adjust the moving average parameters to reduce trading frequency.
The RSI and ADX indicators can both fail. The solution is to optimize the parameters and adjust the indicator calculation cycle.
This strategy requires an appropriate stop loss strategy. The solution is to set reasonable movement or pending order stops.
Strategy Optimization Directions
Optimize trading frequency. Try optimizing the parameters of the moving average system to adjust trading frequency.
Additional auxiliary indicators can be introduced. For example, introducing trading volume indicators and entering when large orders come in.
Machine learning algorithms can be combined for parameter optimization. Use algorithms to predict optimal parameter combinations.
Introduce a stop loss mechanism. Set movement or pending order stops to control single loss.
Conclusion
This is a dual moving average tracking strategy. The core idea is to track moving average indicators to judge price trends, and choose entry timing combined with RSI and ADX indicators. Its advantage is that it can follow trends, keenly entering on overbought/oversold phenomena, and profiting from major trends. The main risks of this strategy come from high sensitivity to price changes, which may generate overly frequent trading. Through parameter optimization and stop loss measures, this strategy can be effectively adjusted for better performance in live trading.
/*backtest
start: 2022-12-18 00:00:00
end: 2023-12-24 00:00:00
period: 1d
basePeriod: 1h
exchanges: [{"eid":"Futures_Binance","currency":"BTC_USDT"}]
*/

//@version=5
strategy("Supertrend Strategy", overlay=true, default_qty_type=strategy.percent_of_equity, default_qty_value=120,
     initial_capital=1000, margin_long=0.1)

atrPeriod = input(10, "ATR Length")
factor = input.float(3.0, "Factor", step=0.01)

[_, direction] = ta.supertrend(factor, atrPeriod)

adxlen = input(7, title="ADX Smoothing")
dilen = input(7, title="DI Length")
dirmov(len) =>
	up = ta.change(high)
	down = -ta.change(low)
	plusDM = na(up) ? na : (up > down and up > 0 ? up : 0)
	minusDM = na(down) ? na : (down > up and down > 0 ? down : 0)
	truerange = ta.rma(ta.tr, len)
	plus = fixnan(100 * ta.rma(plusDM, len) / truerange)
	minus = fixnan(100 * ta.rma(minusDM, len) / truerange)
	[plus, minus]
adx(dilen, adxlen) =>
	[plus, minus] = dirmov(dilen)
	sum = plus + minus
	adx = 100 * ta.rma(math.abs(plus - minus) / (sum == 0 ? 1 : sum), adxlen)
sig = adx(dilen, adxlen)

if ta.change(direction) < 0 and ta.rsi(close, 21) < 66 and ta.rsi(close, 3) > 80 and ta.rsi(close, 28) > 49 and sig > 20
    strategy.entry("My Long Entry Id", strategy.long)

if ta.change(direction) > 0
    strategy.close("My Long Entry Id")  // Close long position

//plot(strategy.equity, title="equity", color=color.red, linewidth=2, style=plot.style_areabr)