Dual Channel Donchian Breakout Strategy
Author: ChaoZhang, Date: 2023-12-26 10:18:51Tags:

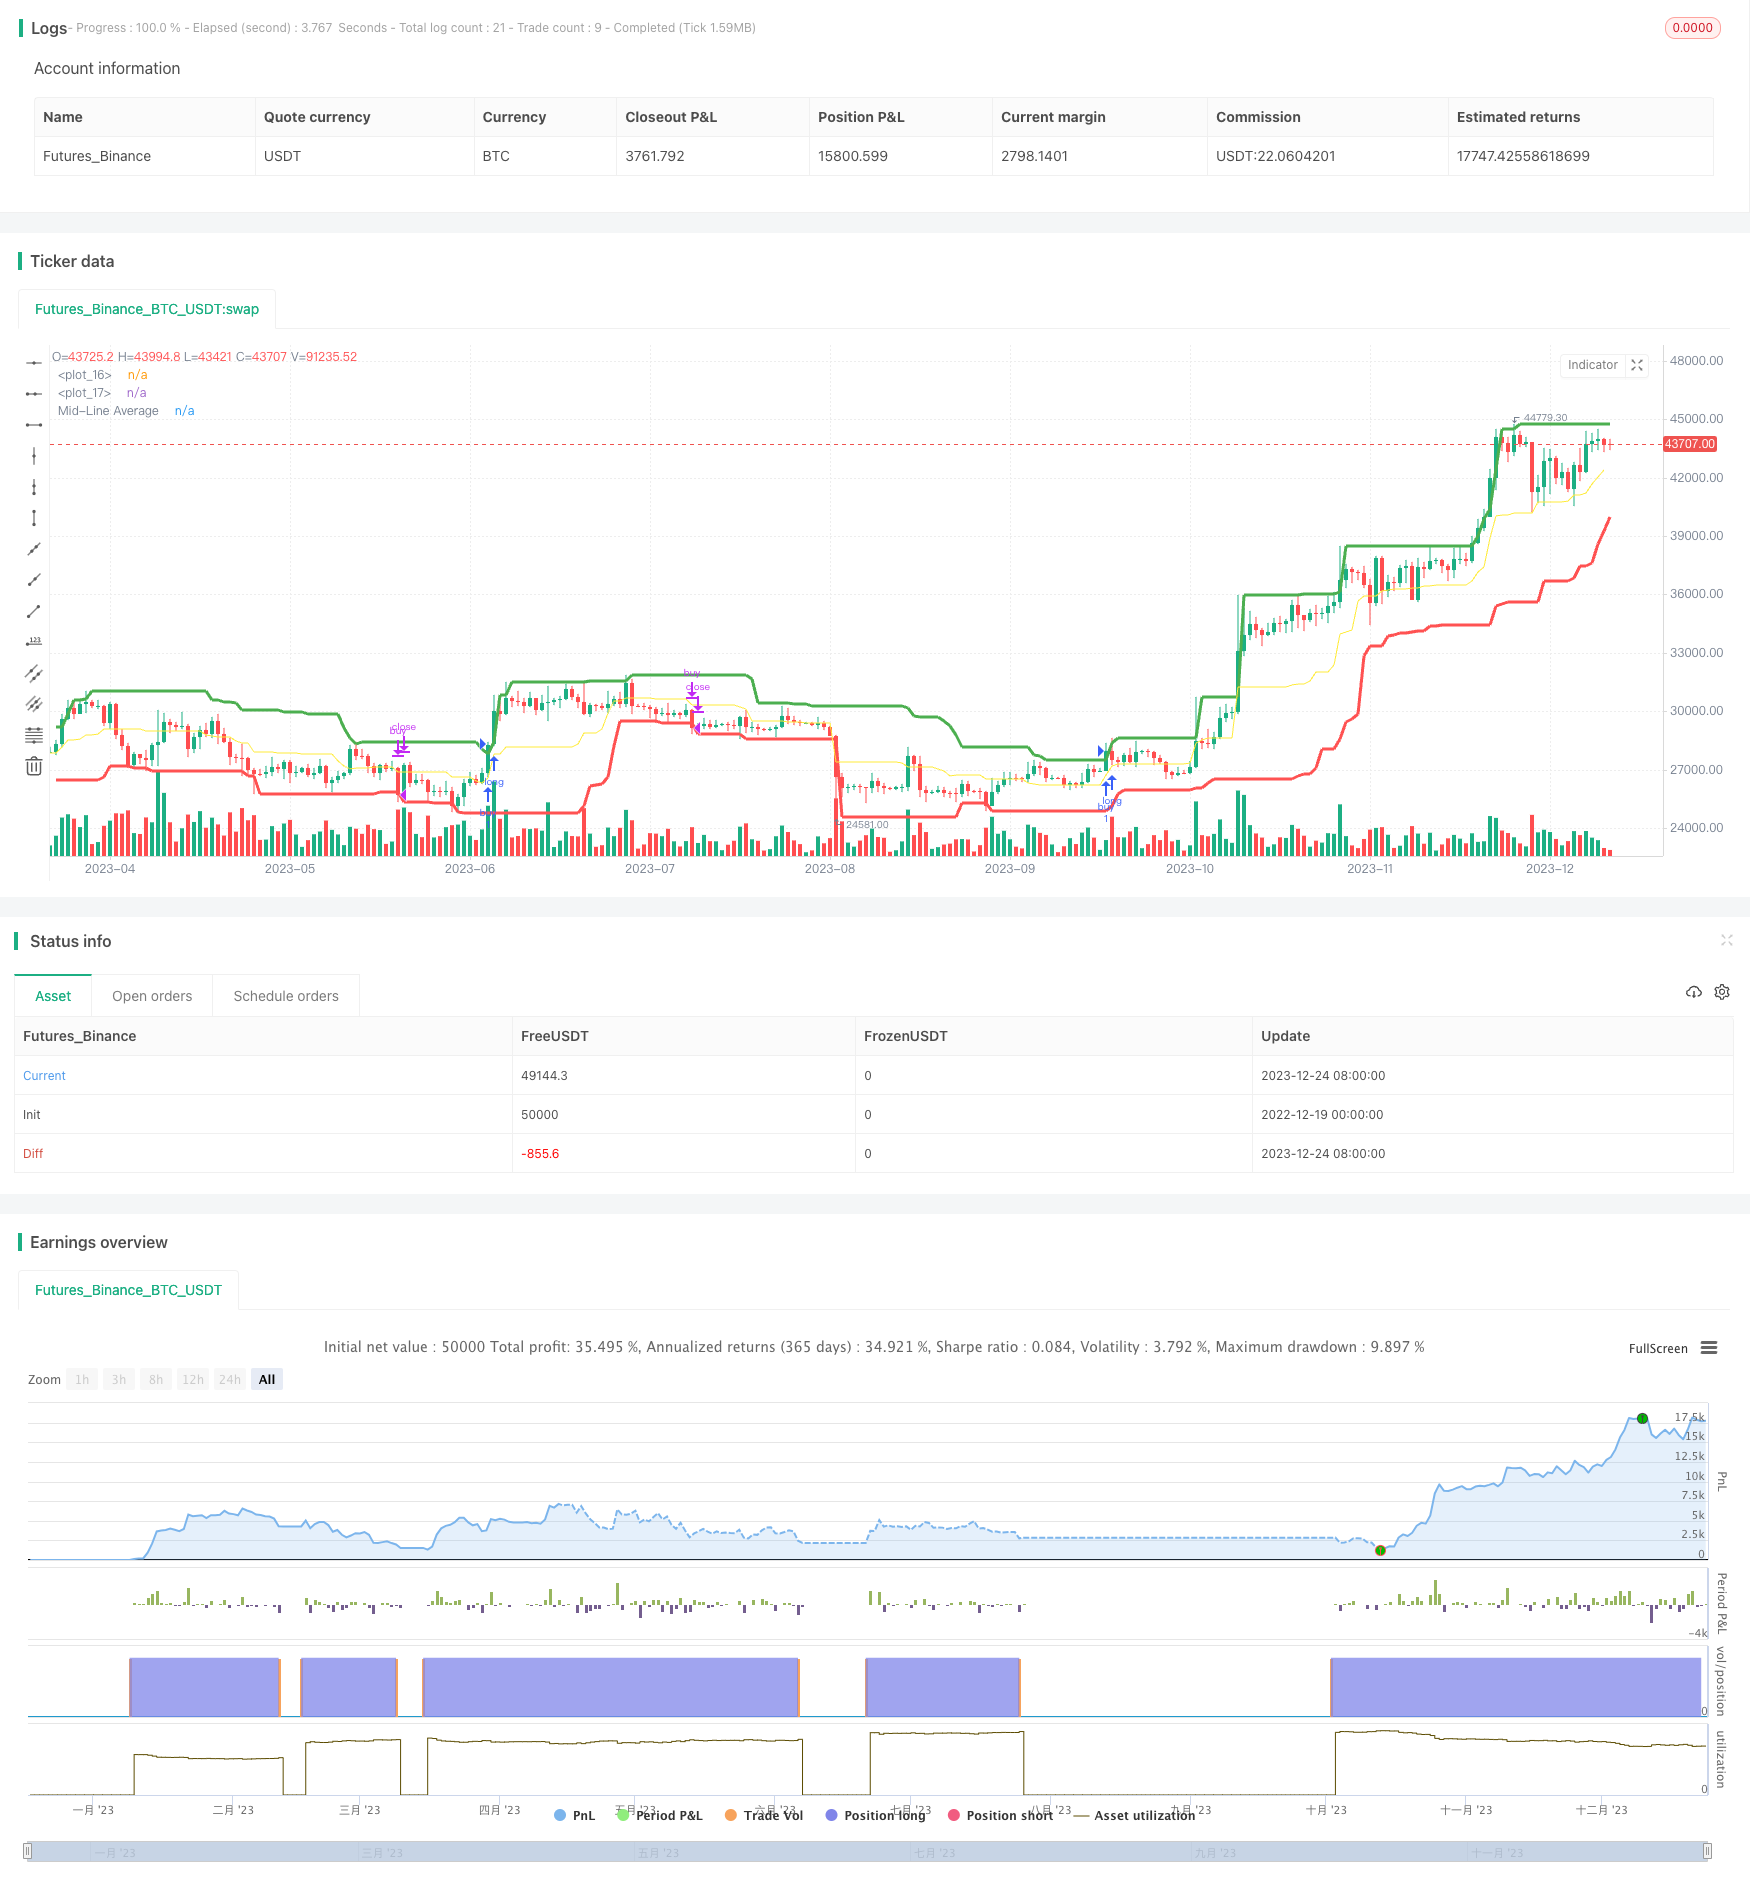
This strategy is based on the Donchian Channel indicator to implement trading signals on upper and lower band breakouts.
Strategy Logic
The strategy calculates upper and lower bands with different parameters to generate buy and sell signals respectively.
Upper Band Formula: Upper = Highest(length1) Lower Band Formula: Lower = Lowest(length2) Mid Line Formula: Mid Line = (Upper + Lower) / 2
When close price breaks above upper band, a buy signal is generated. When close price breaks below lower band, a sell signal is generated.
The advantage of this strategy is the flexibility to customize upper and lower band parameters for more flexible trading rules.
Advantages
-
Customizable upper and lower band parameters for independent long and short control.
-
Mid line indicator shows average position of bands for clearer breakout judgment.
-
Donchian Channel has trend following characteristic to catch trend opportunities.
-
Simple logic and easy to implement.
Risks
-
Vulnerable to false breakouts, needs filter from other indicators.
-
Unable to detect trend divergence, requires manual or other indicator combination.
-
Improper parameter tuning leads to over-aggressiveness or over-conservativeness.
Enhancement Directions
-
Incorporate moving averages etc. to filter false breakouts.
-
Add volatility measures to quantify true breakout probability.
-
Dynamically adjust upper and lower band parameters for adaptive trading rules.
Conclusion
This strategy implements flexible breakout trading via dual-band Donchian Channel. Simple logic but contains certain false breakout probabilities. Can be improved by parameter tuning, filters and supplementary indicators.
/*backtest
start: 2022-12-19 00:00:00
end: 2023-12-25 00:00:00
period: 1d
basePeriod: 1h
exchanges: [{"eid":"Futures_Binance","currency":"BTC_USDT"}]
*/

//@version=3
//Modified Donchian Channel with separate adjustments for upper and lower levels, with offset
// Strategy to buy on break upper Donchian and sell on lower Donchian
strategy("Donchian Backtest", overlay=true)

length1 = input(20, minval=1, title="Upper Channel")
length2 = input(20, minval=1, title="Lower Channel")
offset_bar = input(0,minval=0, title ="Offset Bars")
max_length = max(length1,length2)

upper = highest(length1)
lower = lowest(length2)

basis = avg(upper, lower)

l = plot(lower, style=line, linewidth=3, color=red, offset=1)
u = plot(upper, style=line, linewidth=3, color=green, offset=1)

plot(basis, color=yellow, style=line, linewidth=1, title="Mid-Line Average")
//break upper Donchian (with 1 candle offset) (buy signal)
break_up = (close >= upper[1])
//break lower Donchian (with 1 candle offset) (sell signal)
break_down = (close <= lower[1])


if break_up
    strategy.entry("buy", strategy.long,1)
if break_down
    strategy.close("buy")

//plot(strategy.equity)
- Dynamic Buying Selling Volume Breakout Strategy
- Supertrend MACD Quantitative Strategy
- 4 EMA Trend Strategy
- Bitcoin Trading Strategy Based on Quantitative Indicators
- Last N Candle Reverse Logic Strategy
- Trend Tracking Breakout Strategy
- Simple Buy Low Sell High Strategy
- N Bar Close Below Open Short Strategy
- Statistical Volatility Backtest Strategy Based on Extreme Value Method
- Relative Strength Index Stop Loss Strategy
- A Multi-Period Trading Strategy Based on Moving Averages
- Pivot Reversal Upgraded Long Only - A Dual Momentum Strategy
- Turtle Trading Strategy
- Dual Moving Average Tracking Strategy
- Dual Moving Average Momentum Squeeze Strategy
- SMA Crossover Trading Strategy
- Based on Weighted Moving Average Strategy
- Dual Moving Average Crossover Strategy
- Trend Reversal Trading Strategy Based on EMA Crossover
- RSI Based Bullish Trend Following Strategy