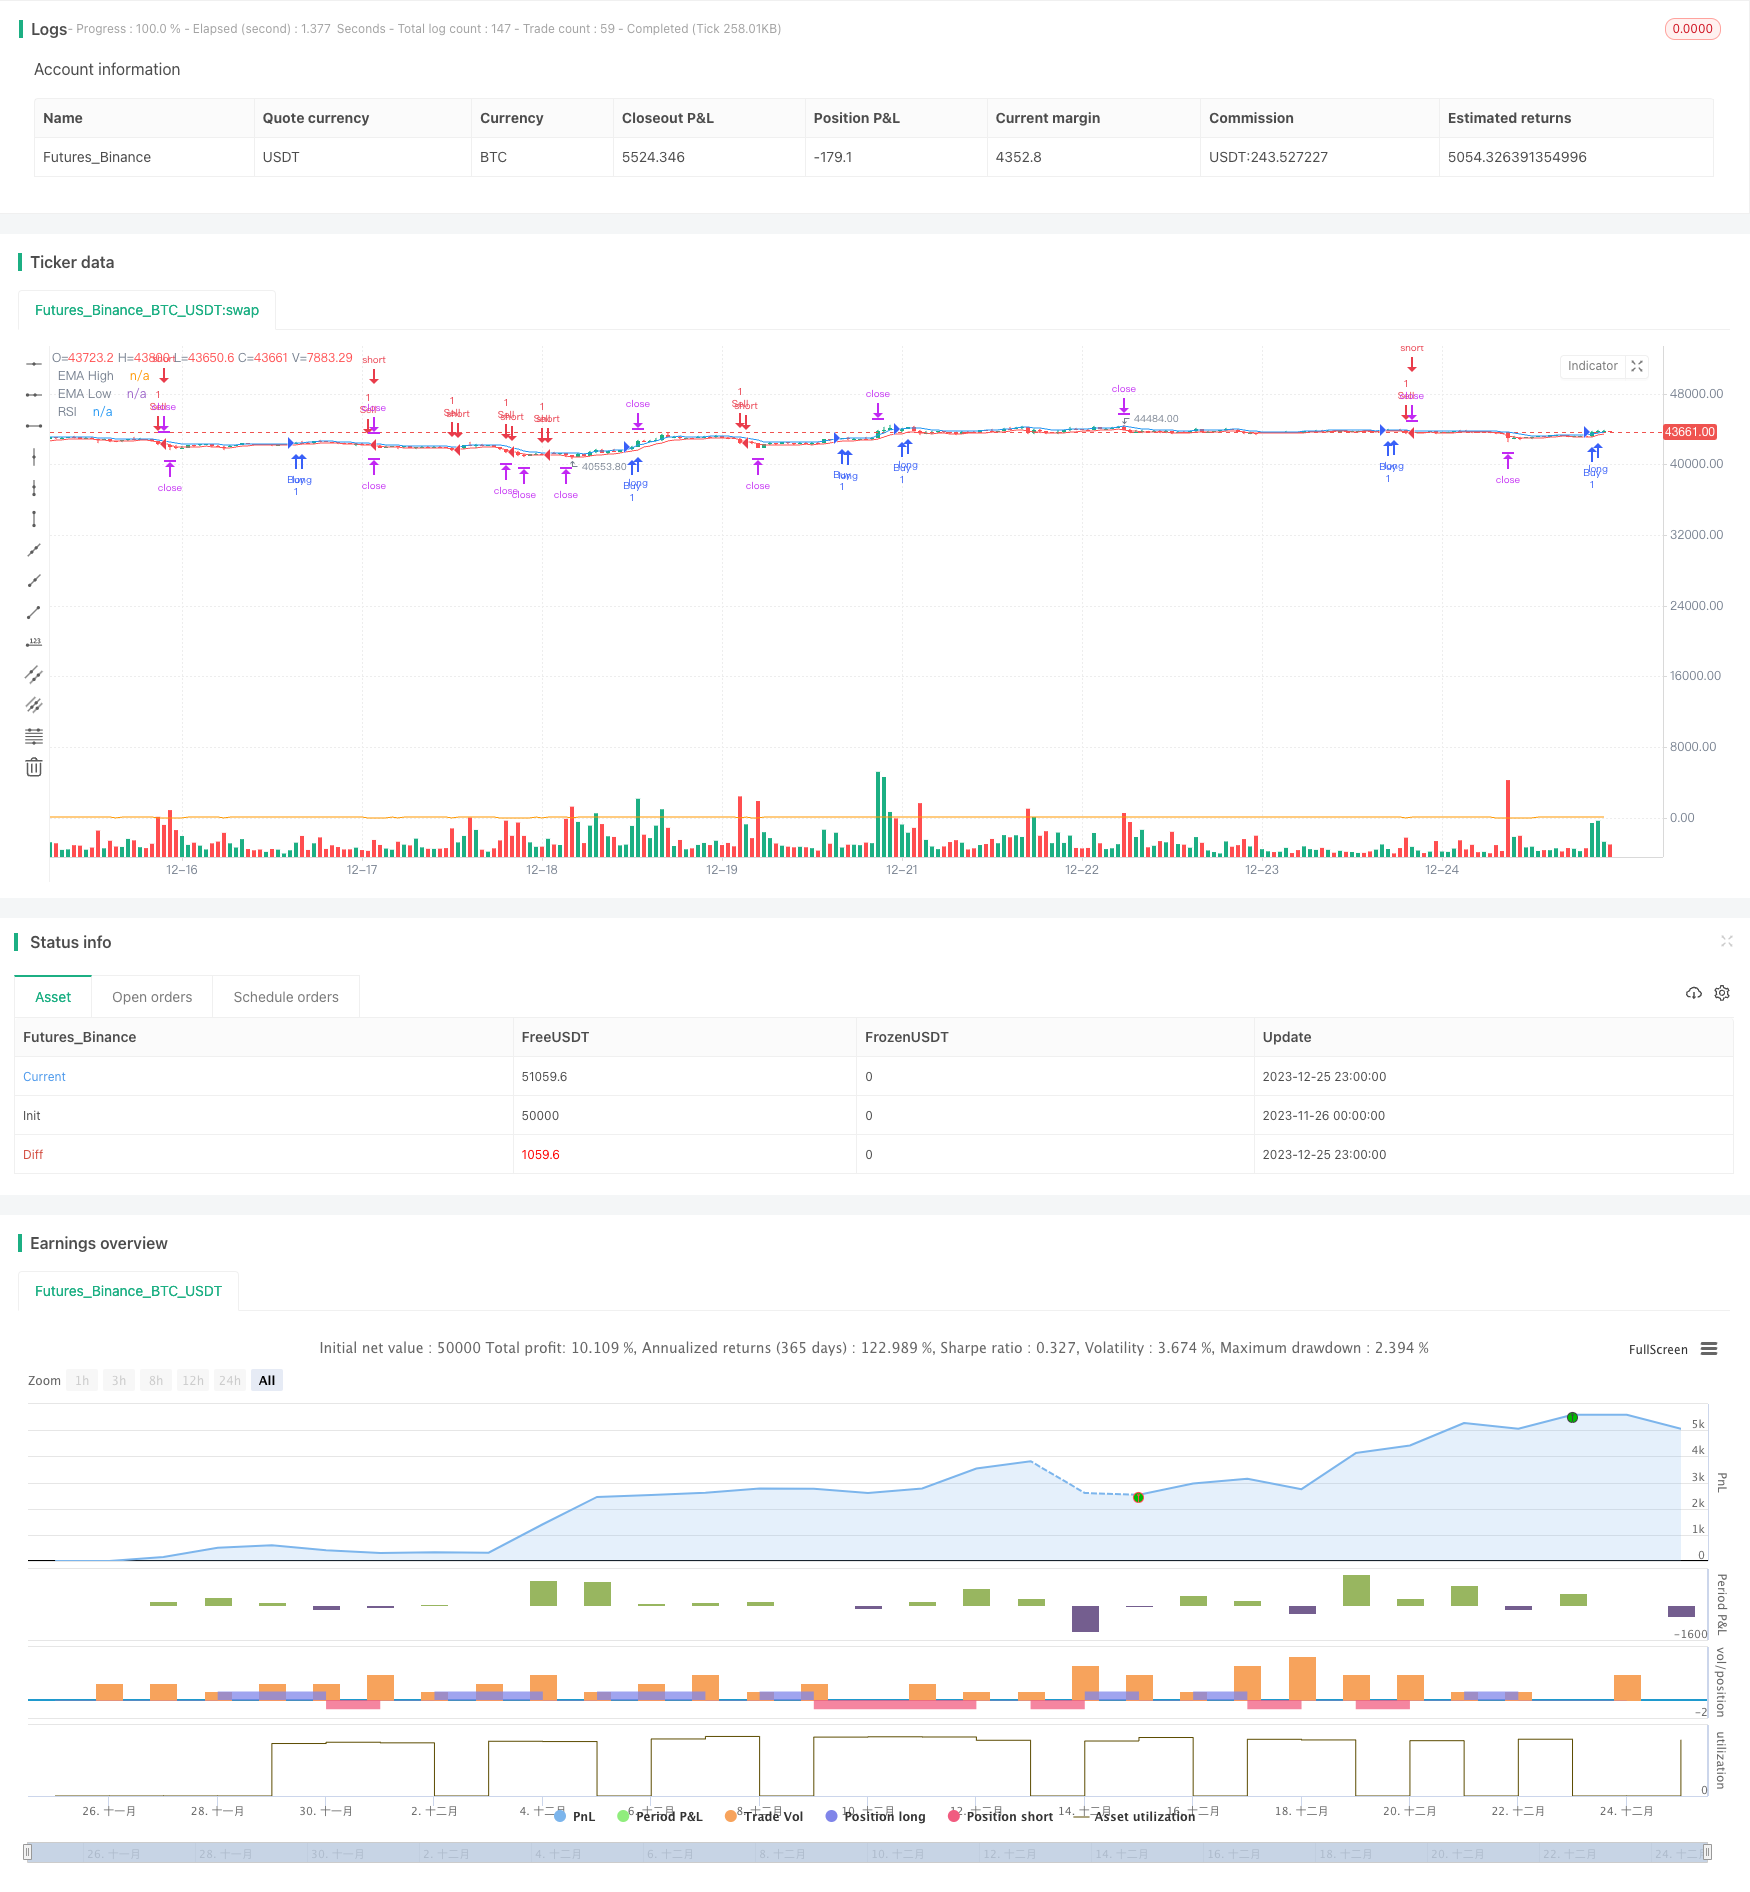
RSI and EMA Channel Intraday Trading Strategy
Author: ChaoZhang, Date: 2023-12-27 16:57:09Tags:

Overview
This strategy combines the Relative Strength Index (RSI) and the 5-day Exponential Moving Average (EMA) channel to implement intraday short-term trading. It goes long when the price breaks through the upper rail of the EMA channel and the RSI rises from the lows, and goes short when the price breaks through the lower rail of the EMA channel and the RSI falls back from the highs. The strategy aims to buy low and sell high to lock in profits.
Strategy Principle
-
Use the highest and lowest prices of the 5-day EMA to draw a price channel. The EMA can respond faster to price changes and the channel range is more in line with current market volatility.
-
The RSI indicator can spot overbought and oversold conditions. The RSI parameter is set to 6 for ultra-short cycle more suitable for intraday operations.
-
Buy condition: The price breaks through the upper rail and the RSI rises from below 30 to above 70, indicating the stock price has obtained support and the market has resumed its uptrend, giving a long signal.
-
Sell condition: The price breaks through the lower rail and the RSI falls back from above 70 to below 30, indicating the stock price has suffered a heavy blow, the market has turned bearish, giving a short signal.
-
Take profit strategy: After buying, take 50% profit first at a 1:1 risk-reward ratio, and the rest at a 1:2 ratio; after short selling, take 50% profit first at a 1:1 risk-reward ratio, and the rest at a 1:2 ratio.
Advantage Analysis
-
Using the EMA channel to draw dynamic support and resistance. It can respond quickly to price changes and improve trade win rate.
-
The RSI indicator prevents blind trading without clear signals, which can reduce unnecessary trades and drawdowns.
-
The risk-reward ratio is clear. Take profit levels directly reflect the profit level, avoiding excessive greed.
-
The strategy is simple and clear, easy to understand and implement, suitable for intraday short-term trading.
Risk Analysis
-
Intraday operations require more frequent monitoring of the market, which consumes more time and energy.
-
Risk of stop loss failure. Prices may gap or form a V-shaped reversal, rendering stops useless.
-
Need to choose stocks with good liquidity and high volatility. Stocks with low trading volume cannot profit.
-
Limited room for parameter optimization. The cycles for RSI and days for EMA are short, making optimization effects minimal.
Optimization Directions
-
Can test adding other indicators to filter signals, such as adding MACD for long/short confirmation.
-
Can automatically optimize RSI and EMA parameters based on machine learning techniques.
-
Can combine with moving average systems to determine market trend direction in higher timeframes, avoiding counter-trend trading.
-
Can dynamically adjust take profit ratios and change take profit levels according to market volatility.
Summary
The strategy integrates the EMA channel and RSI indicator into a systematic framework that can clearly judge entry and exit timing, realizing intraday short-term trading. The dynamic take profit strategy can lock in reasonable profits. The advantage of this strategy is that it is simple and easy to understand and implement, but intraday operations are quite tiring. Need to choose suitable products and trade cautiously. Can further improve through multi-indicator combinations, parameter optimization, take profit optimization, etc.
/*backtest
start: 2023-11-26 00:00:00
end: 2023-12-26 00:00:00
period: 1h
basePeriod: 15m
exchanges: [{"eid":"Futures_Binance","currency":"BTC_USDT"}]
*/

// This source code is subject to the terms of the Mozilla Public License 2.0 at https://mozilla.org/MPL/2.0/
// © moondevonyt

//@version=5
strategy("RSI and EMA Channel Daily Strategy", overlay=true)

// Indicators
ema_high = ta.ema(high, 5)
ema_low = ta.ema(low, 5)
rsi = ta.rsi(close, 6)

// Plot RSI and EMA
plot(ema_high, color=color.blue, title="EMA High")
plot(ema_low, color=color.red, title="EMA Low")
plot(rsi, color=color.orange, title="RSI")

// Buy Condition
buy_condition = close > ema_high and ta.crossover(rsi, 70)

// Sell Condition
sell_condition = close < ema_low and ta.crossunder(rsi, 30)

// Execute Buy with Take Profit Levels
if buy_condition
    strategy.entry("Buy", strategy.long)
    strategy.exit("Take Profit 1", "Buy", limit=close + (close - low[1]))
    strategy.exit("Take Profit 2", "Buy", limit=close + 2 * (close - low[1]))

// Execute Sell with Take Profit Levels
if sell_condition
    strategy.entry("Sell", strategy.short)
    strategy.exit("Take Profit 1", "Sell", limit=close - (high[1] - close))
    strategy.exit("Take Profit 2", "Sell", limit=close - 2 * (high[1] - close))
- Reversal Dual Moving Average Crossover Strategy
- Multi Timeframe Trend Strategy
- Double Moving Average Crossover Strategy
- Time-stepped Pyramiding Simple Quant Strategy
- Trend Breakout Strategy
- Dual-factor Reversal Trading Strategy
- Bollinger Band Mean Reversion Trading Strategy
- Multi-Indicator Trend Tracking Strategy
- Multi-Period EMA Crossover Quantitative Trading Strategy
- Momentum Indicator Crossover Strategy
- RSI and Fibonacci Retracement Trading Strategy
- Short-Term Silver Trading Strategy Based on SMA and RSI Indicators
- Momentum and SuperTrend Combination Trading Strategy
- fast EMA and slow EMA Momentum Breakthrough Strategy
- EMA Crossover Trend Following Strategy
- Ichimoku Cloud and Bollinger Bands Combination Trading Strategy
- Multi-timeframe Quantitative Trading Strategy Based on PSAR, MACD and RSI
- Double Moving Average Crossover Trading Strategy
- Moving Average Crossover Gold Strategy
- Bollinger Bands Heiken Ashi Short-term Trading Strategy