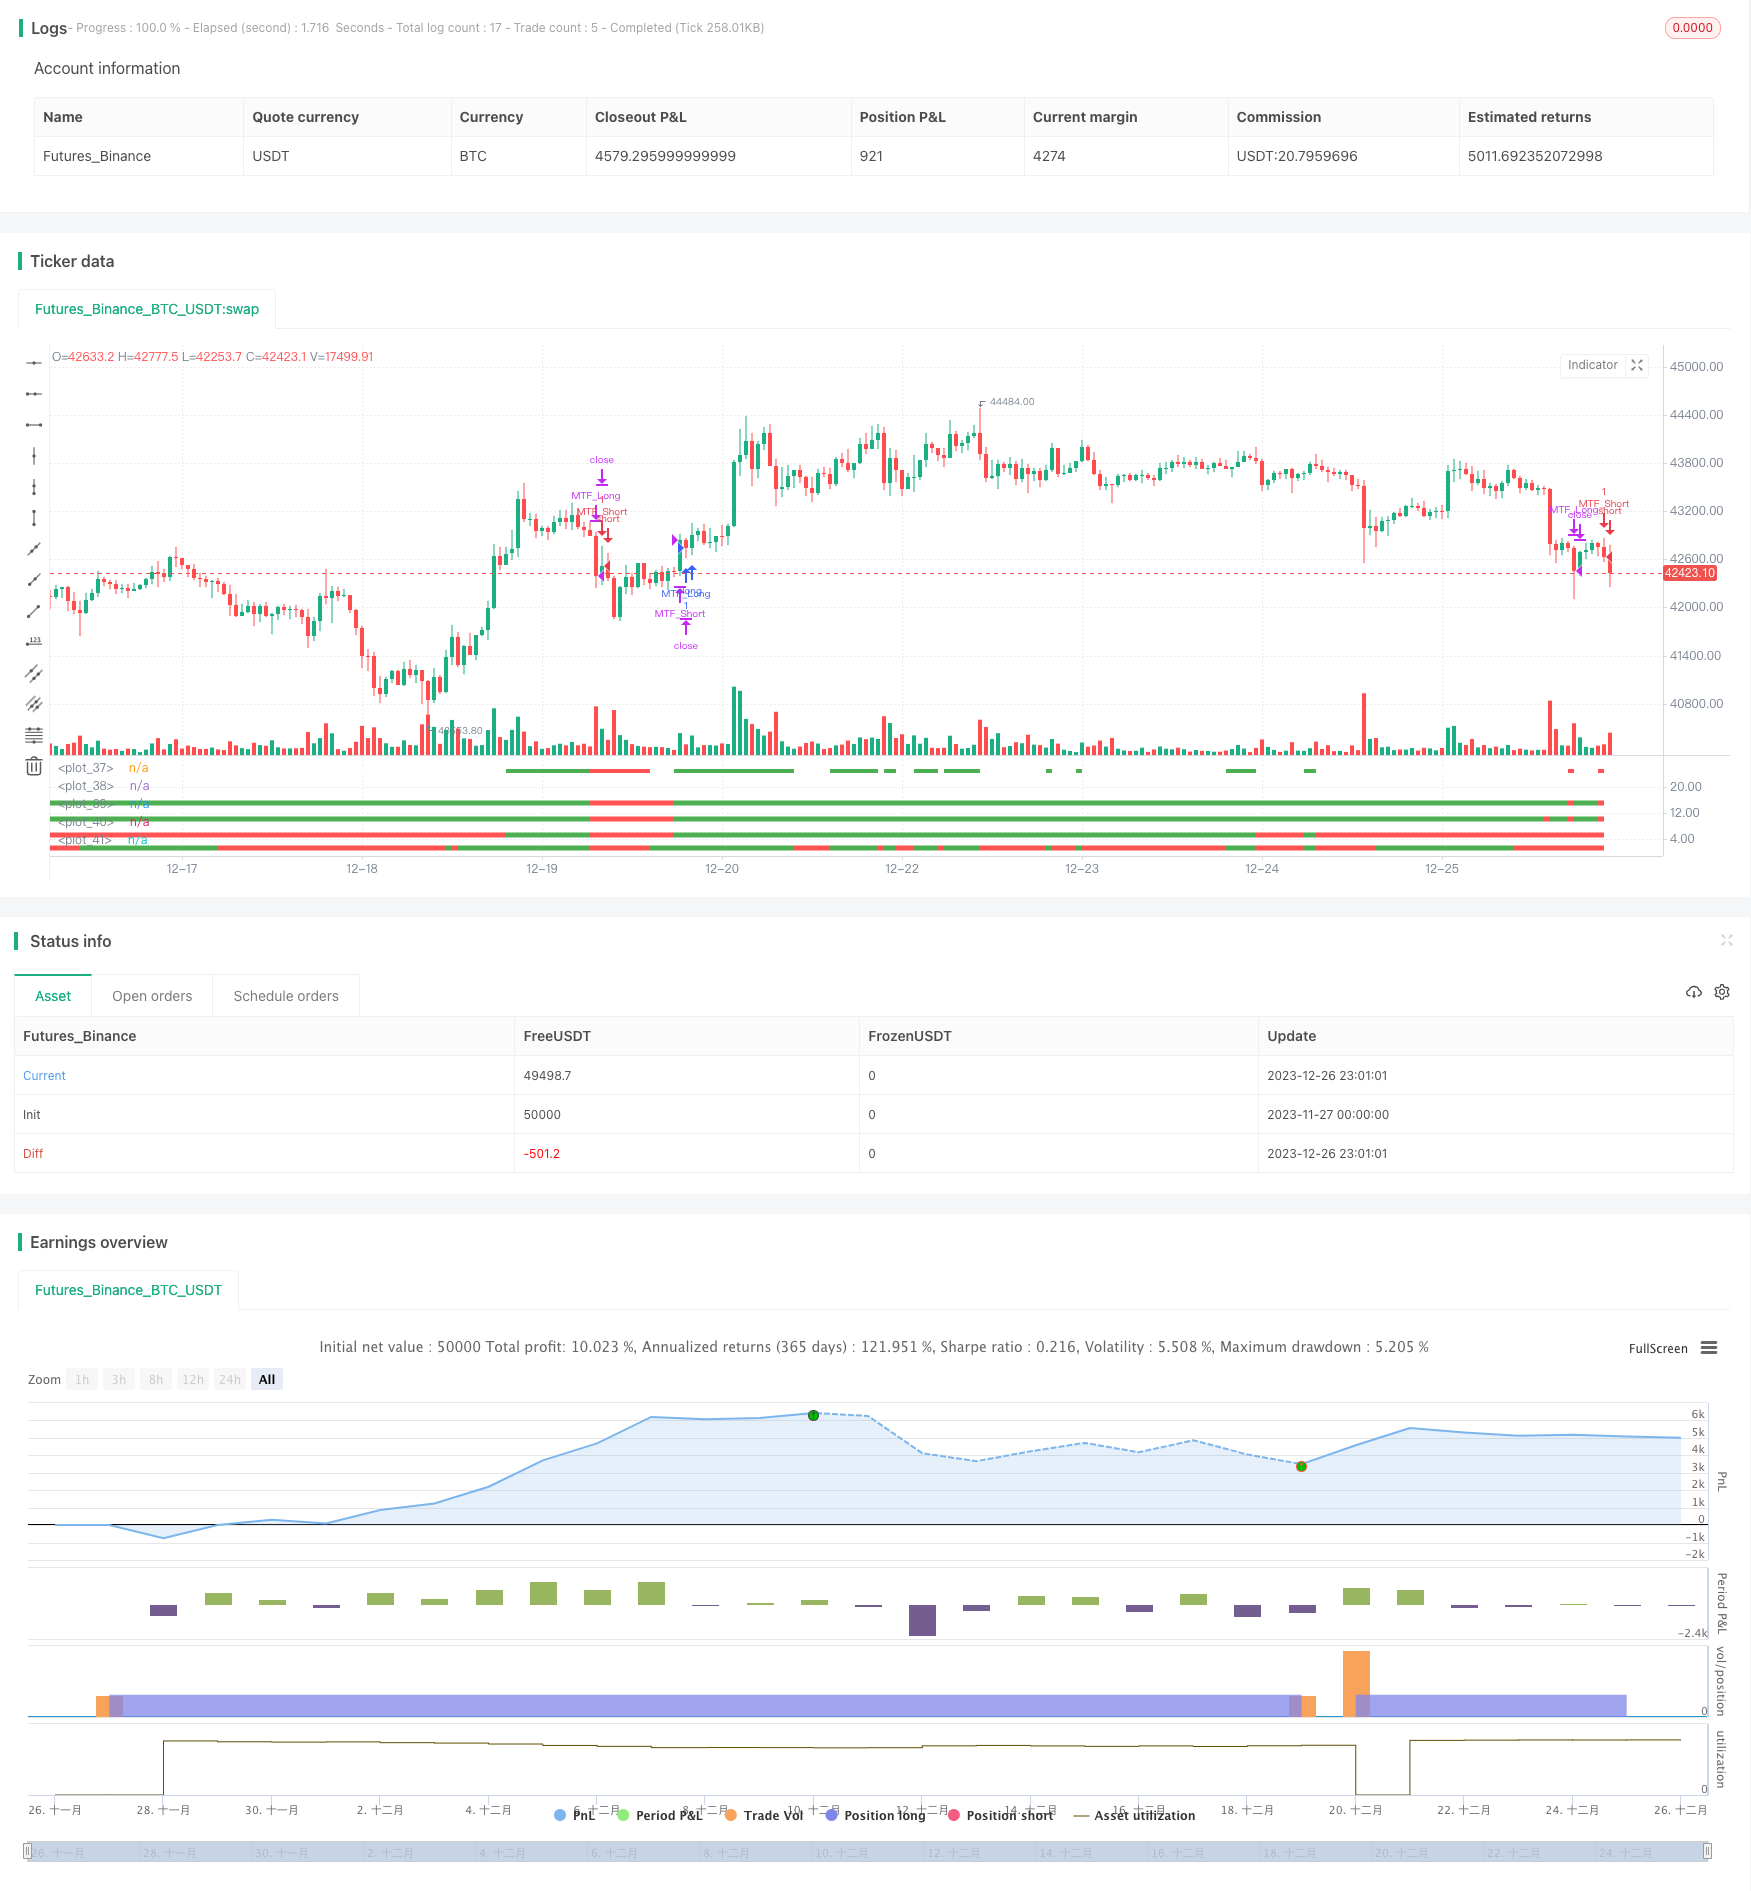
Multi Timeframe Trend Strategy
Author: ChaoZhang, Date: 2023-12-28 11:57:00Tags:

Overview
This strategy uses 4 different timeframes to determine the trend direction, to discover the long-term trend while using the short-term as entry opportunities. When the open prices of the 4 timeframes (daily, weekly, 15-day, monthly) are all lower than the closing prices, it is determined as a long-term bullish trend; when the open prices of the 4 timeframes are all higher than the closing prices, it is determined as a long-term bearish trend. The strategy will open positions when confirming the long-term trend and a short-term signal is generated.
Strategy Logic
This strategy uses 4 timeframes: daily, weekly, 15-day and monthly. It determines the long-term trend direction based on the relationship between the open and closing prices of these 4 timeframes.
When the open prices of the daily, weekly, 15-day and monthly timeframes are all lower than the closing prices, it indicates that prices are showing an upward trend across these 4 timeframes, so it is determined as a bull market and long-term bullish.
On the contrary, when the open prices of these 4 timeframes are all higher than the closing prices, it indicates that prices are showing a downward trend across these 4 timeframes, so it is determined as a bear market and long-term bearish.
After determining the long-term trend direction, the strategy will open positions when a buy/sell signal is generated on the short-term. That is, this strategy uses the long-term to determine the major trend and the short-term to decide specific entry opportunities.
Advantage Analysis
This strategy has the following advantages:
- Multi-timeframe judgment improves accuracy
Using 4 different timeframes to comprehensively judge the long-term trend can improve the accuracy of judgment and avoid being misled by short-term market noise.
- Combination of long-term and short-term, flexible strategy
Using long-term frames to determine the major direction and short-term to generate trading signals, this strategy is flexible, which can capture short-term opportunities while not deviating from the major trend.
- Simple parameters, easy to implement
The main judgment indicators of this strategy are just the open and closing prices of the 4 timeframes. The parameter setting is simple and easy to implement.
Risk Analysis
There are also some risks in this strategy:
- Long-term trend reversal
If the long-term bullish trend reverses into long-term bearish, this strategy cannot promptly judge, which may lead to greater losses. Manual intervention or stop loss should be used in this case.
- Poor short-term performance
This strategy mainly relies on short-term signals to determine specific entry opportunities. If the short-term performance is poor and unable to open positions at the right time, it will affect the overall performance. The short-term parameters can be adjusted or the short-term strategy can be optimized in this case.
Optimization Directions
There are further optimization spaces for this strategy:
- Add stop loss strategy
Moving or order stop loss can be set to control maximum loss.
- Optimize short-term strategy
Different short-term indicators can be tested to find more suitable short-term strategies and improve entry performance.
- Dynamically adjust positions
Positions can be adjusted dynamically based on market volatility, increase positions when the trend becomes more obvious.
- Combine machine learning
A large amount of data can be collected and machine learning methods can be used to dynamically optimize parameters and rules.
Conclusion
This strategy determines the trend direction across multiple timeframes, adopts the idea of combining long-term and short-term, which ensures the judgment of major trends and utilizes short-term opportunities. The overall logic is clear and reasonable, simple to implement, and it is an effective trend following strategy. With the introduction of techniques like stop loss and dynamic position management, this strategy has great room for improvement and is worth practicing and optimizing.
/*backtest
start: 2023-11-27 00:00:00
end: 2023-12-27 00:00:00
period: 1h
basePeriod: 15m
exchanges: [{"eid":"Futures_Binance","currency":"BTC_USDT"}]
*/

//@version=2
strategy("[RichG] Easy MTF Strategy", overlay=false)

TF_1_time = input("D", "Timeframe 1")
TF_2_time = input("5D", "Timeframe 2")
TF_3_time = input("15D", "Timeframe 3")
TF_4_time = input("45D", "Timeframe 4")

transaction_size = input(1, "Contract/Share Amount")

src = close, len = 20
out = sma(src, len)
width = 5
upcolor = green
downcolor = red
neutralcolor = blue
linestyle = line

TF_1 = request.security(syminfo.tickerid, TF_1_time, open) < request.security(syminfo.tickerid, TF_1_time, close) ? true:false
TF_1_color = TF_1 ? upcolor:downcolor

TF_2 = request.security(syminfo.tickerid, TF_2_time, open) < request.security(syminfo.tickerid, TF_2_time, close) ? true:false
TF_2_color = TF_2 ? upcolor:downcolor

TF_3 = request.security(syminfo.tickerid, TF_3_time, open) < request.security(syminfo.tickerid, TF_3_time, close) ? true:false
TF_3_color = TF_3 ? upcolor:downcolor


TF_4 = request.security(syminfo.tickerid, TF_4_time, open) < request.security(syminfo.tickerid, TF_4_time, close) ? true:false
TF_4_color = TF_4 ? upcolor:downcolor

TF_global = TF_1 and TF_2 and TF_3 and TF_4
TF_global_bear = TF_1 == false and TF_2 == false and TF_3 == false and TF_4 == false
TF_global_color = TF_global ? green : TF_global_bear ? red : white
TF_trigger_width = TF_global ? 6 : width

plot(1, style=linestyle, linewidth=width, color=TF_1_color)
plot(5, style=linestyle, linewidth=width, color=TF_2_color)
plot(10, style=linestyle, linewidth=width, color=TF_3_color)
plot(15, style=linestyle, linewidth=width, color=TF_4_color)
plot(25, style=linestyle, linewidth=4, color=TF_global_color)

exitCondition_Long = TF_global_bear
exitCondition_Short = TF_global

longCondition = TF_global
if (longCondition)
    strategy.entry("MTF_Long", strategy.long, qty=transaction_size, when=strategy.position_size == 0)

shortCondition = TF_global_bear
if (shortCondition)
    strategy.entry("MTF_Short", strategy.short, qty=transaction_size, when=strategy.position_size == 0)

strategy.close("MTF_Long", when=exitCondition_Long)
strategy.close("MTF_Short", when=exitCondition_Short)
- Triple EMA Crossover Breakout Strategy
- Bollinger Bands Based Quantitative Trading Strategy
- Super Trend Reverse Strategy
- Breakthrough Moving Average Trend Tracking Strategy
- Highest/Lowest Center Lookback Strategy
- Moving Average Rebound Strategy
- MACD and EMA Crossover Strategy
- Momentum Gap Trading Strategy
- Ichimoku Short-Long Strategy with Money Management
- Reversal Dual Moving Average Crossover Strategy
- Double Moving Average Crossover Strategy
- Time-stepped Pyramiding Simple Quant Strategy
- Trend Breakout Strategy
- Dual-factor Reversal Trading Strategy
- Bollinger Band Mean Reversion Trading Strategy
- Multi-Indicator Trend Tracking Strategy
- Multi-Period EMA Crossover Quantitative Trading Strategy
- Momentum Indicator Crossover Strategy
- RSI and EMA Channel Intraday Trading Strategy
- RSI and Fibonacci Retracement Trading Strategy