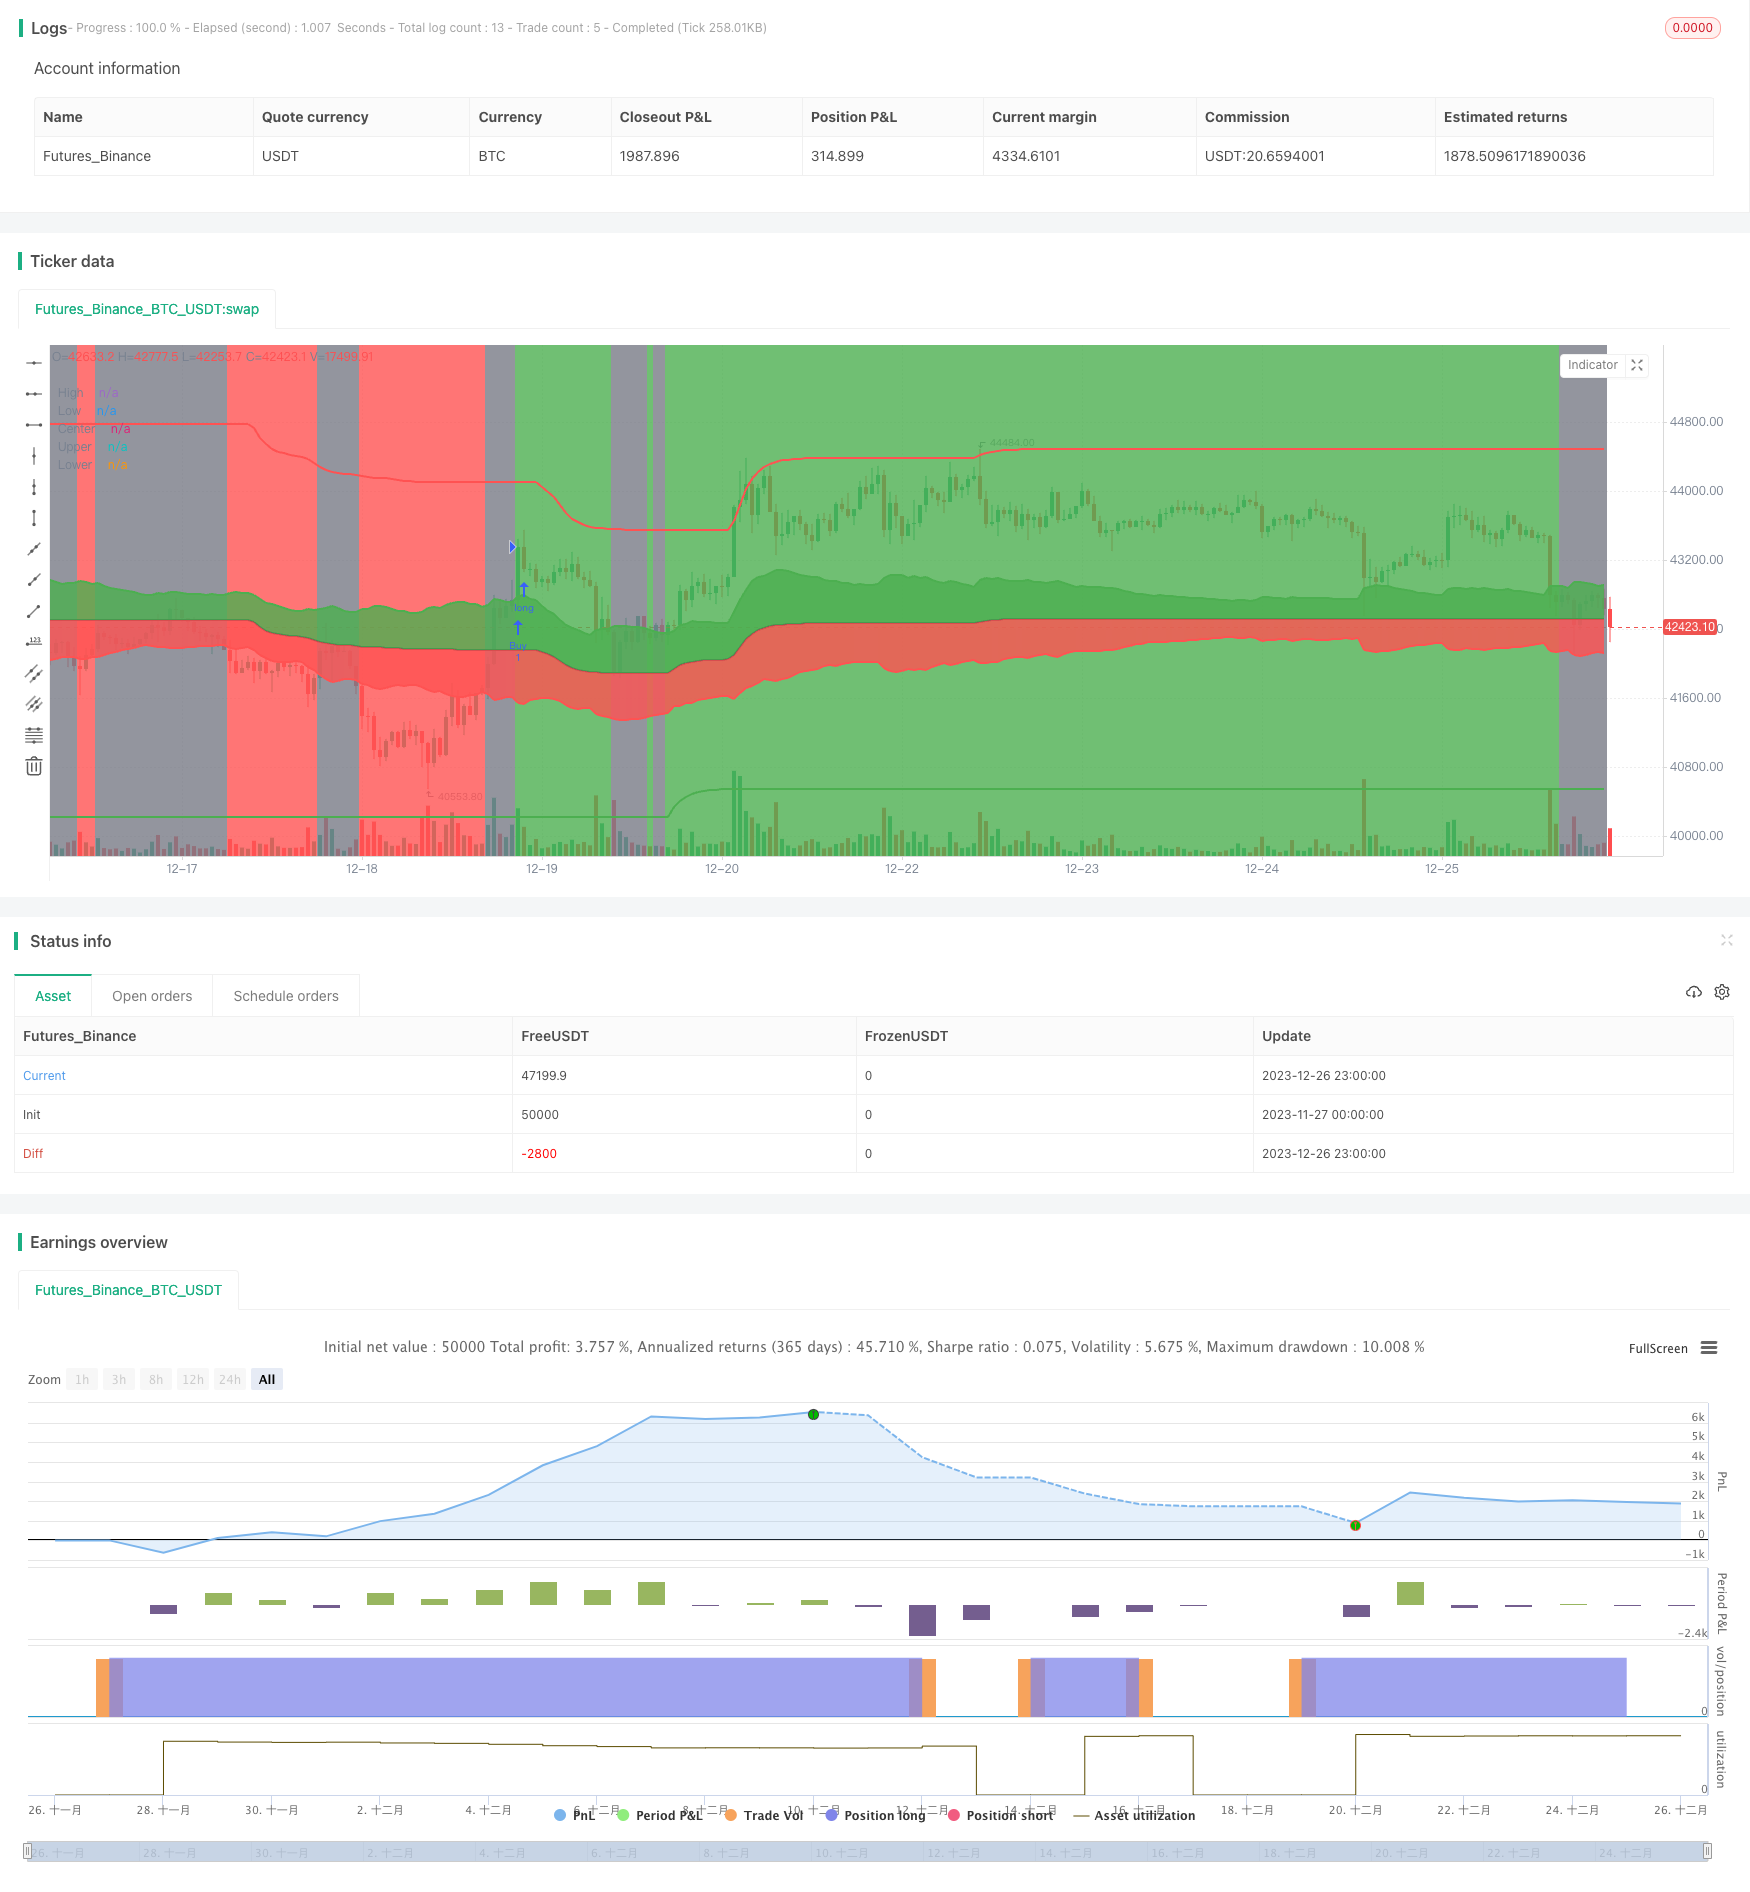
Highest/Lowest Center Lookback Strategy
Author: ChaoZhang, Date: 2023-12-28 15:42:10Tags:

Overview
The Highest/Lowest Center Lookback strategy is a trend following strategy. Its main idea is to calculate the middle price of the highest and lowest prices over a certain period in the past as the benchmark price, and then calculate the entry zone and exit zone based on this benchmark price combined with volatility. When the price enters the entry zone, go long; when the price enters the exit zone, close the position.
Strategy Logic
The strategy is mainly implemented through the following steps:
- Calculate the highest price h and lowest price l over the past lookback_length periods, and smooth them with EMA
- Calculate the middle price of h and l as the center price
- Calculate volatility vola based on ATR and ATR multiplier
- Calculate entry zone upper and exit zone lower based on center and vola
- When price price breaks above upper, go long; when price breaks below lower, close position
In this way, it can track the trend in time when price enters a trend state; at the same time, risk can be controlled through volatility.
Advantage Analysis
This strategy has the following advantages:
- Can effectively track trends and capture price changes in time
- Using the middle price of highest and lowest prices can reduce the probability of false breakouts
- Volatility can be automatically adjusted to control risk
- Position holding time is short, allowing more frequent trading opportunities
- Simple to implement and easy to understand and optimize
Risk Analysis
The strategy also has some risks:
- More unnecessary trades may occur in range-bound markets
- The settings of ATR size and multiplier will affect strategy performance, requiring careful testing and optimization
- Pullback after breaking the middle price may cause stop loss
- If the trend reversal speed is too fast, it will lead to greater losses
To control these risks, optimization can be done in the following aspects:
- Adjust ATR parameters to reduce volatility and filter whipsaws
- Add filters to avoid unnecessary trades
- Use moving stop loss to lock in profits
- Combine trend indicators to judge real trend start and end
Optimization Directions
The strategy also has room for further optimization:
- Test parameter effectiveness across different markets and timeframes
- Automatically optimize parameters with machine learning algorithms
- Incorporate more indicators to judge trend start and end
- Consider dynamically adjusting position sizing
- Incorporate sentiment indicators to avoid bias from extreme emotions
Through these optimizations, further improvements in strategy stability and profitability can be expected.
Conclusion
The Highest/Lowest Center Lookback strategy is a simple and practical trend following strategy. It can capture price changes in time, track trends, while controlling risk through volatility. The strategy is easy to implement, suitable for quantitative trading beginners to learn and practice. By optimizing parameters and rules, the strategy performance can be further improved. In general, this is a recommended quantitative strategy.
/*backtest
start: 2023-11-27 00:00:00
end: 2023-12-27 00:00:00
period: 1h
basePeriod: 15m
exchanges: [{"eid":"Futures_Binance","currency":"BTC_USDT"}]
*/

//@version=4
strategy("Highest/Lowest Center Lookback Strategy", overlay=true)

lookback_length = input(200, type=input.integer, minval=1, title="Lookback Length")
smoother_length = input(5, type=input.integer, minval=1, title="Smoother Length")
atr_length = input(10, type=input.integer, minval=1, title="ATR Length")
atr_multiplier = input(1.5, type=input.float, minval=0.5, title="ATR Multiplier")

vola = atr(atr_length) * atr_multiplier
price = sma(close, 3)

l = ema(lowest(low, lookback_length), smoother_length)
h = ema(highest(high, lookback_length), smoother_length)
center = (h + l) * 0.5
upper = center + vola
lower = center - vola
trend = price > upper ? true : (price < lower ? false : na)

bull_cross = crossover(price, upper)
bear_cross = crossunder(price, lower)

strategy.entry("Buy", strategy.long, when=bull_cross)
strategy.close("Buy", when=bear_cross)

plot(h, title="High", color=color.red, transp=75, linewidth=2)
plot(l, title="Low", color=color.green, transp=75, linewidth=2)

pc = plot(center, title="Center", color=color.black, transp=25, linewidth=2)
pu = plot(upper, title="Upper", color=color.green, transp=75, linewidth=2)
pl = plot(lower, title="Lower", color=color.red, transp=75, linewidth=2)

fill(pu, pc, color=color.green, transp=85)
fill(pl, pc, color=color.red, transp=85)

bgcolor(trend == true ? color.green : (trend == false ? color.red : color.gray), transp=85)
- Relative Volume Price Strategy
- Slow Stochastic Trend Following Strategy
- Comprehensive Quantitative Trading Strategy Based on Multiple Indicators
- Parabolic Stop and Reserve Multi-Indicator Trading Strategy
- Premium Double Trend Filter MA Ratio Strategy
- Dual Moving Average Convergence Trend Tracking Strategy
- Triple EMA Crossover Breakout Strategy
- Bollinger Bands Based Quantitative Trading Strategy
- Super Trend Reverse Strategy
- Breakthrough Moving Average Trend Tracking Strategy
- Moving Average Rebound Strategy
- MACD and EMA Crossover Strategy
- Momentum Gap Trading Strategy
- Ichimoku Short-Long Strategy with Money Management
- Reversal Dual Moving Average Crossover Strategy
- Multi Timeframe Trend Strategy
- Double Moving Average Crossover Strategy
- Time-stepped Pyramiding Simple Quant Strategy
- Trend Breakout Strategy
- Dual-factor Reversal Trading Strategy