Slow Stochastic Trend Following Strategy
Author: ChaoZhang, Date: 2023-12-28 17:50:36Tags:

Overview
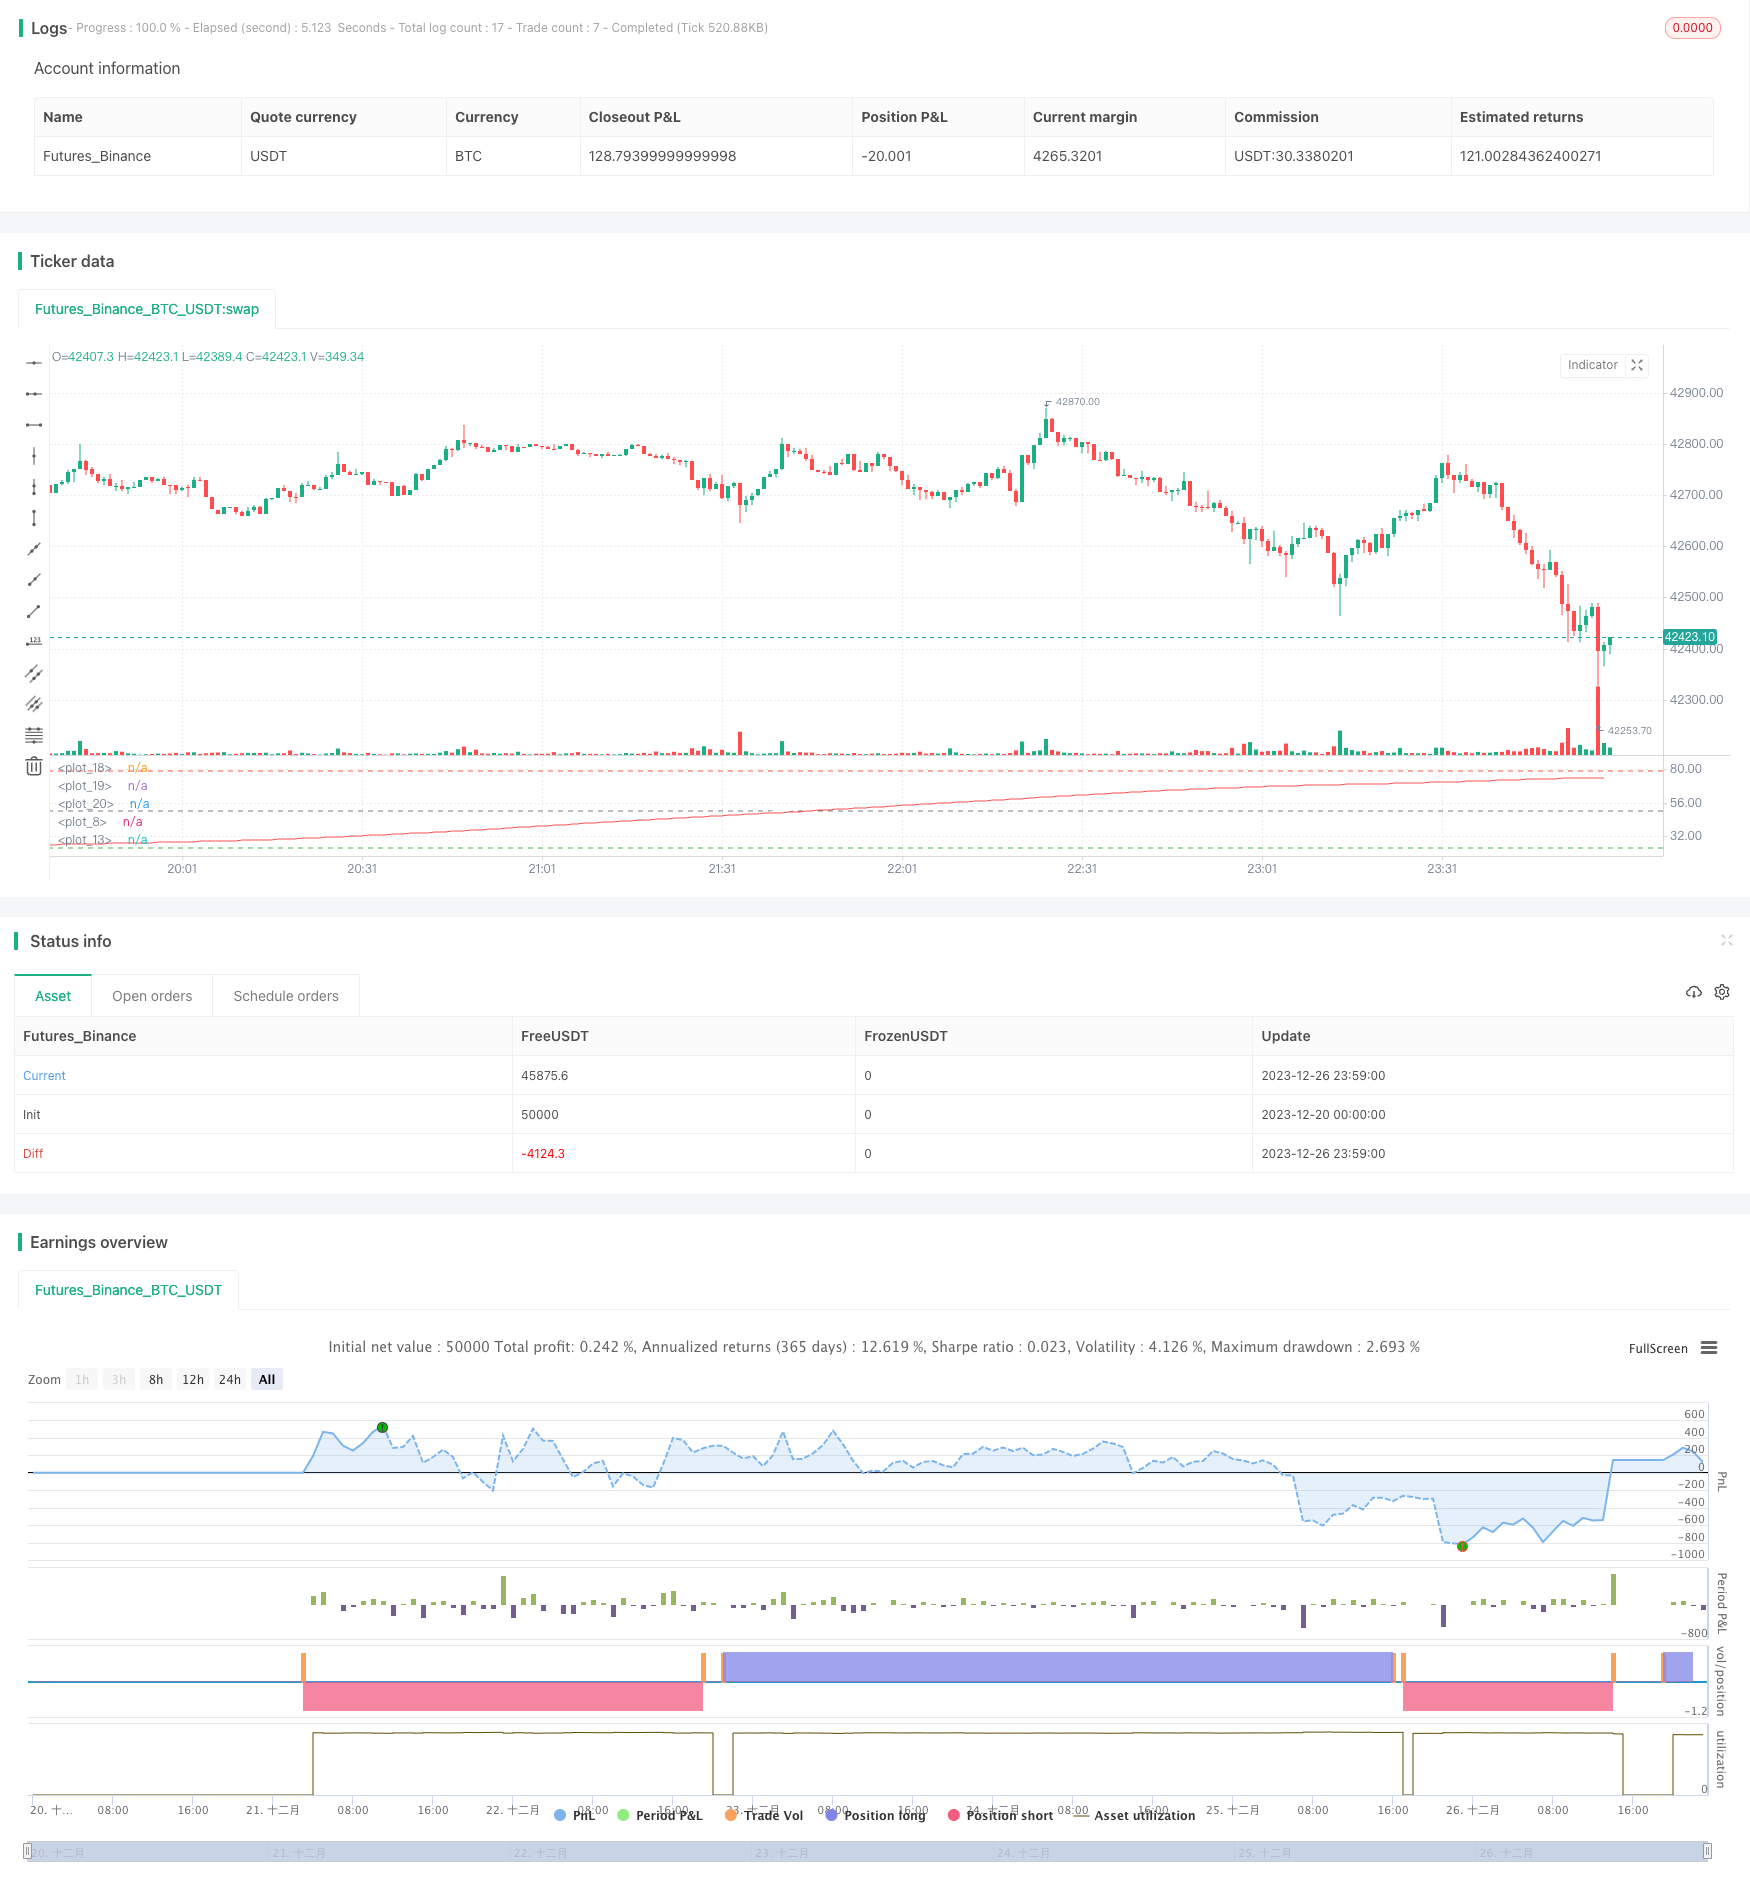
This is a trend following strategy based on slow stochastic indicator. It uses a long period K line moving average to smooth the slow stochastic and filters out market noise to lock in major trends. The strategy determines entry and exit points based on overbought and oversold levels of the smoothed slow stochastic.
Strategy Logic
The strategy first calculates a 400-period K value SMA smoothing line, and then calculates another 275-period SMA line to further smooth the K line. This makes the final K line very smooth, basically only reflecting the major trend direction of the market. The strategy uses this ultra-smoothed slow stochastic K value as trading signal.
When the K line crosses above the 23 oversold level from below, it goes long. When the K line crosses below the 78.5 overbought level from above, it goes short. Exit signals happen when the K line crosses back above/below the overbought/oversold levels. Thus the strategy achieves trend following effect.
Advantage Analysis
The biggest advantage of this strategy is using the ultra-smoothed slow stochastic to lock in major market trends, avoiding noise interference. The ultra-smoothing makes it only sensitive to major trend changes, filtering out high frequency reversals and oscillations.
Also, compared to common moving average strategies, this strategy can capture trend turning points faster, with larger profit windows.
Risk Analysis
The main risk of this strategy is that the market may oscillate within the overbought/oversold zones for extended periods, causing multiple false signals and losses. In this case parameters need to be adjusted to make the K line smoother, or widen the overbought/oversold zones.
Also, if trend changes abruptly with huge moves, the ultra-smoothed K line may delay signal recognition, causing some potential profit loss. Here the K line MA parameters should be shortened to make it more sensitive.
Optimization Directions
The strategy can be optimized in the following aspects:
- Adjust smoothing periods of K & D values to find optimal combo;
- Test different price inputs like close, typical price etc;
- Add trading volume or position sizing control like ATR stop loss, capital utilization rate control etc;
- Add auxiliary indicators like MACD to avoid false signals;
- Use machine learning to optimize parameters.
Conclusion
The slow stochastic trend following strategy achieves capturing major market trends and avoids high frequency noise interference through ultra-smoothing processing. There are also risks of delayed signal recognition. We can optimize the strategy by adjusting parameters or adding auxiliary conditions to improve stability and profitability.
/*backtest
start: 2023-12-20 00:00:00
end: 2023-12-27 00:00:00
period: 1m
basePeriod: 1m
exchanges: [{"eid":"Futures_Binance","currency":"BTC_USDT"}]
*/

//@version=4
strategy(title="Slow Stochastic OB/OS Strategy", overlay=false )

smoothK = input(400, step=5)
price = input(ohlc4)
SMAsmoothK = input(275, step=5)
k = sma(stoch(price, high, low, smoothK), SMAsmoothK)
plot(k, color=white)


smoothD = input(10, step=2)
d = sma(k, smoothD)
plot(d, color=red)


OB = input(78.5, step=0.5)
OS = input(23, step=0.5)
hline(OB, linewidth=1, color=red)
hline(OS,linewidth=1, color=green)
hline(50,linewidth=1, color=gray)


long = crossover(d, OS)
short = crossunder(d, OB)

strategy.entry("Long", strategy.long, when=long) //_signal or long) //or closeshort_signal)
strategy.entry("Short", strategy.short, when=short) //_signal or short) // or closelong_signal)

//If you want to try to play with exits you can activate these!

closelong = crossover(d, OB)
closeshort = crossunder(d, OS)

strategy.close("Long", when=closelong)
strategy.close("Short", when=closeshort)
- Mean Reversion Line Strategy
- Fibonacci HMA AI Buy Sell Signal Strategy
- Three Inside Down Reversal Strategy
- Quantitative Trading Dual Moving Average Strategy
- Leveraged RSI Strategy in Pine Script
- Quantitative Trading Reversal Trend Combo T3-CCI Strategy
- Dynamic Trailing Stop Loss Strategy
- Slow RSI OB/OS Strategy
- Multi-indicator Adaptive Trend Trading Strategy
- Relative Volume Price Strategy
- Comprehensive Quantitative Trading Strategy Based on Multiple Indicators
- Parabolic Stop and Reserve Multi-Indicator Trading Strategy
- Premium Double Trend Filter MA Ratio Strategy
- Dual Moving Average Convergence Trend Tracking Strategy
- Triple EMA Crossover Breakout Strategy
- Bollinger Bands Based Quantitative Trading Strategy
- Super Trend Reverse Strategy
- Breakthrough Moving Average Trend Tracking Strategy
- Highest/Lowest Center Lookback Strategy
- Moving Average Rebound Strategy