Moving Average Crossover System
Author: ChaoZhang, Date: 2024-01-03 16:22:18Tags:

Overview
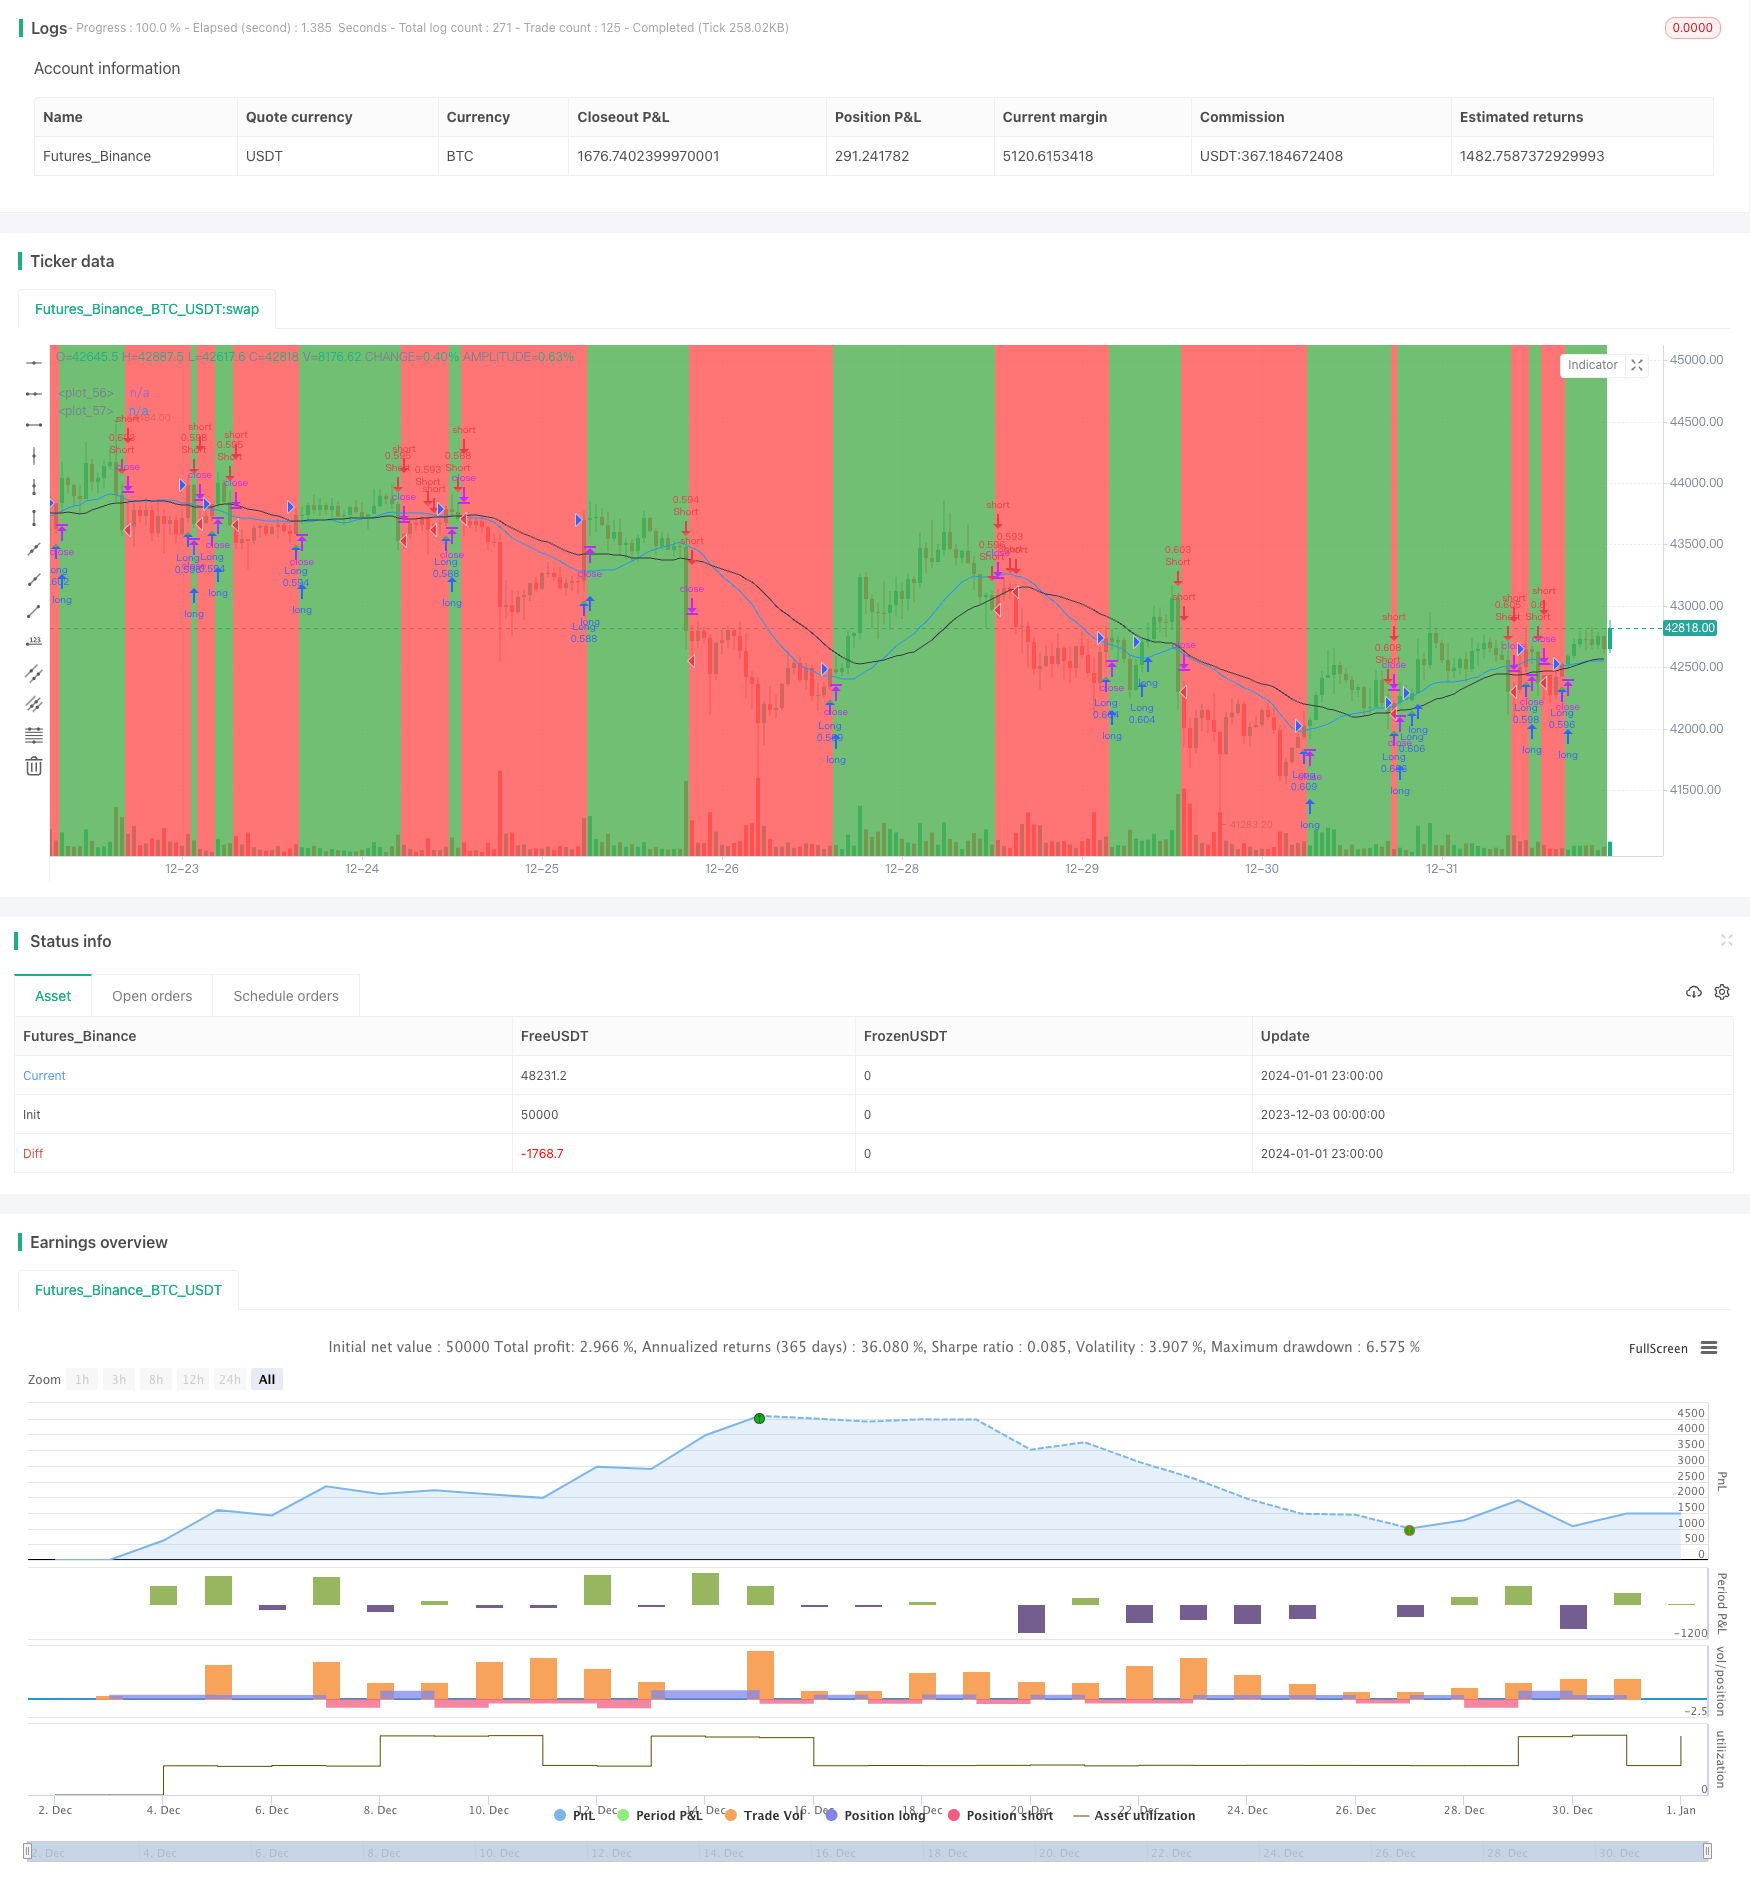
This is a trend-following strategy based on moving average crossover signals. When the fast moving average crosses above the slow moving average from below, a buy signal is generated. When the fast moving average crosses below the slow moving average from above, a sell signal is generated.
Strategy Logic
The strategy uses two moving averages, a 20-period simple moving average and a 30-period simple moving average. When the 20-period MA crosses above the 30-period MA, a buy signal is generated. When the 20-period MA crosses below the 30-period MA, a sell signal is triggered.
The moving averages themselves serve as trend indicators, depicting the market trend direction effectively. The crossover principle allows the strategy to capture trend reversal points timely and generate trading signals. The 20-day and 30-day periods are set appropriately to reflect the market trend without being too sensitive to noise.
Advantage Analysis
The main advantages of this strategy are:
- The logic is simple and clear, easy to understand and implement, suitable for beginners;
- Trading along the trend avoids counter-trend positions and unnecessary losses;
- The moving averages have a filtering effect to remove market noise and avoid false signals;
- The parameter settings are reasonable not to cause too much sensitivity.
Risk Analysis
The main risks of this strategy include:
- Frequent stop loss orders may be triggered during market consolidation when moving average crossover happens frequently;
- Missing some profits due to the lagging nature of moving averages during strong trends;
- Inappropriate parameter settings may affect the stability.
Solutions:
- Adjust the moving average periods, use triangle moving averages etc to smooth the curves and reduce crossover frequency;
- Use other indicators to determine the trend, avoid trading during consolidation;
- Optimize parameters to find the best combination.
Optimization Directions
The main aspects to optimize the strategy:
- Test different types of moving averages, like weighted moving average, triangular moving average etc;
- Add other technical indicators to avoid signals during consolidation;
- Incorporate other analysis techniques like Elliott Waves, channel theory to determine the trend;
- Adopt machine learning models to optimize parameters dynamically;
- Utilize quant tools and apply stop loss/profit taking techniques to refine money management.
Conclusion
The moving average crossover system is a simple and effective trend following strategy. The logic is clear and easy to understand, very suitable for beginners to learn. It generates trading signals based on moving average crossovers and profits from trading along the trend. The strategy can be optimized in many ways to become more stable and efficient.
/*backtest
start: 2023-12-03 00:00:00
end: 2024-01-02 00:00:00
period: 1h
basePeriod: 15m
exchanges: [{"eid":"Futures_Binance","currency":"BTC_USDT"}]
*/

// This source code is subject to the terms of the Mozilla Public License 2.0 at https://mozilla.org/MPL/2.0/
// © gliese581d

//@version=4
strategy(title="Moving Averages Testing", overlay=true, precision=2, calc_on_every_tick=false, max_bars_back=5000, pyramiding=2,
 default_qty_type=strategy.percent_of_equity, default_qty_value=50, commission_type=strategy.commission.percent, initial_capital=10000)


//SETTINGS

longs_on = input(title="Long Trades enabled", defval=true)
shorts_on = input(title="Short Trades enabled", defval=true)

long_cond = input(title="Buy/Long Crossover Condition", defval="price x MA1", options=["price x MA1", "price x MA2", "MA1 x MA2"])
short_cond = input(title="Sell/Short Crossunder Condition", defval="price x MA2", options=["price x MA1", "price x MA2", "MA1 x MA2"])

ma1_type = input(title="Moving Average 1 Type", defval="SMA", options=["SMA", "EMA"])
ma1_len = input(defval=20, title="Moving Average 1 Len", type=input.integer, minval=1, maxval=1000, step=1)
ma2_type = input(title="Moving Average 2 Type", defval="SMA", options=["SMA", "EMA"])
ma2_len = input(defval=30, title="Moving Average 2 Len", type=input.integer, minval=1, maxval=1000, step=1)


//MOVING AVERAGES

ma_1 = ma1_type == "EMA" ? ema(close, ma1_len) : sma(close, ma1_len)
ma_2 = ma2_type == "EMA" ? ema(close, ma2_len) : sma(close, ma2_len)


//STRATEGY

//trade entries
long_entry = long_cond == "price x MA1" ? crossover(close, ma_1) : long_cond == "price x MA2" ? crossover(close, ma_2) : long_cond == "MA1 x MA2" ? crossover(ma_1, ma_2) : false
short_entry = short_cond == "price x MA1" ? crossunder(close, ma_1) : short_cond == "price x MA2" ? crossunder(close, ma_2) : short_cond == "MA1 x MA2" ? crossunder(ma_1, ma_2) : false

start_month = input(defval=4, title="Strategy Start Month", type=input.integer, minval=1, maxval=12, step=1)
start_year = input(defval=2018, title="Strategy Start Year", type=input.integer, minval=2000, maxval=2025, step=1)
end_month = input(defval=12, title="Strategy End Month", type=input.integer, minval=1, maxval=12, step=1)
end_year = input(defval=2020, title="Strategy End Year", type=input.integer, minval=2000, maxval=2025, step=1)

in_time =true

strategy.entry("Long", strategy.long, when=longs_on and in_time and long_entry)
strategy.close("Long", when=longs_on and not shorts_on and short_entry)

strategy.entry("Short", strategy.short, when=shorts_on and in_time and short_entry)
strategy.close("Short", when=shorts_on and not longs_on and long_entry)


//PLOTTING

//color background
last_entry_was_long = nz(barssince(long_entry)[1], 5000) < nz(barssince(short_entry)[1], 5000)
bgcol = (longs_on and last_entry_was_long) ? color.green : (shorts_on and not last_entry_was_long) ? color.red : na
bgcolor(color=bgcol, transp=90)

plot((long_cond == "price x MA1" or long_cond == "MA1 x MA2") or (short_cond == "price x MA1" or short_cond == "MA1 x MA2") ? ma_1 : na, color=color.blue)
plot((long_cond == "price x MA2" or long_cond == "MA1 x MA2") or (short_cond == "price x MA2" or short_cond == "MA1 x MA2") ? ma_2 : na, color=color.black)
plotshape(long_entry, style=shape.triangleup, location=location.belowbar, color=color.green)
plotshape(short_entry, style=shape.triangledown, location=location.abovebar, color=color.red)
- Grid Trading Strategy Based on Moving Average System
- Momentum Reversal Strategy
- Crossing Moving Average Trend Tracking Strategy
- Fibonacci Golden Ratio and Relative Strength RSI Strategy
- Reversal and Center of Gravity Integrated Trading Strategy Based on Multi-strategy
- Dual and Triple Exponential Moving Average Crossover Strategy
- Bollinger Bands Breakout Swing Trading Strategy
- Trend Tracking Reversal Strategy
- AlexInc's Bar v1.2 Breakout Accumulation Strategy Based on Meaningful Bar Filtering
- Stock Quant Trading Strategy Combining Exponential Moving Average with Trailing Stop Loss and Percentage Stop Loss
- Close Buying Next Open Profit Taking Strategy
- Moving Stop Loss Tracking Strategy
- Short-term Trend Tracking Strategy Based on Gann Me Analysis Indicator
- The Gaussian Moving Average Trading Strategy
- Adaptive Kaufman Moving Average Trend Following Strategy
- Bandpass Filtering Trend Extraction Strategy
- Dual Reversal High-Low Strategy
- Heyping Moving Average Trend Strategy
- Long and Short Opening Strategy Based on Multi Timeframe Moving Average and MACD
- Momentum Indicator RSI Reversal Trading Strategy