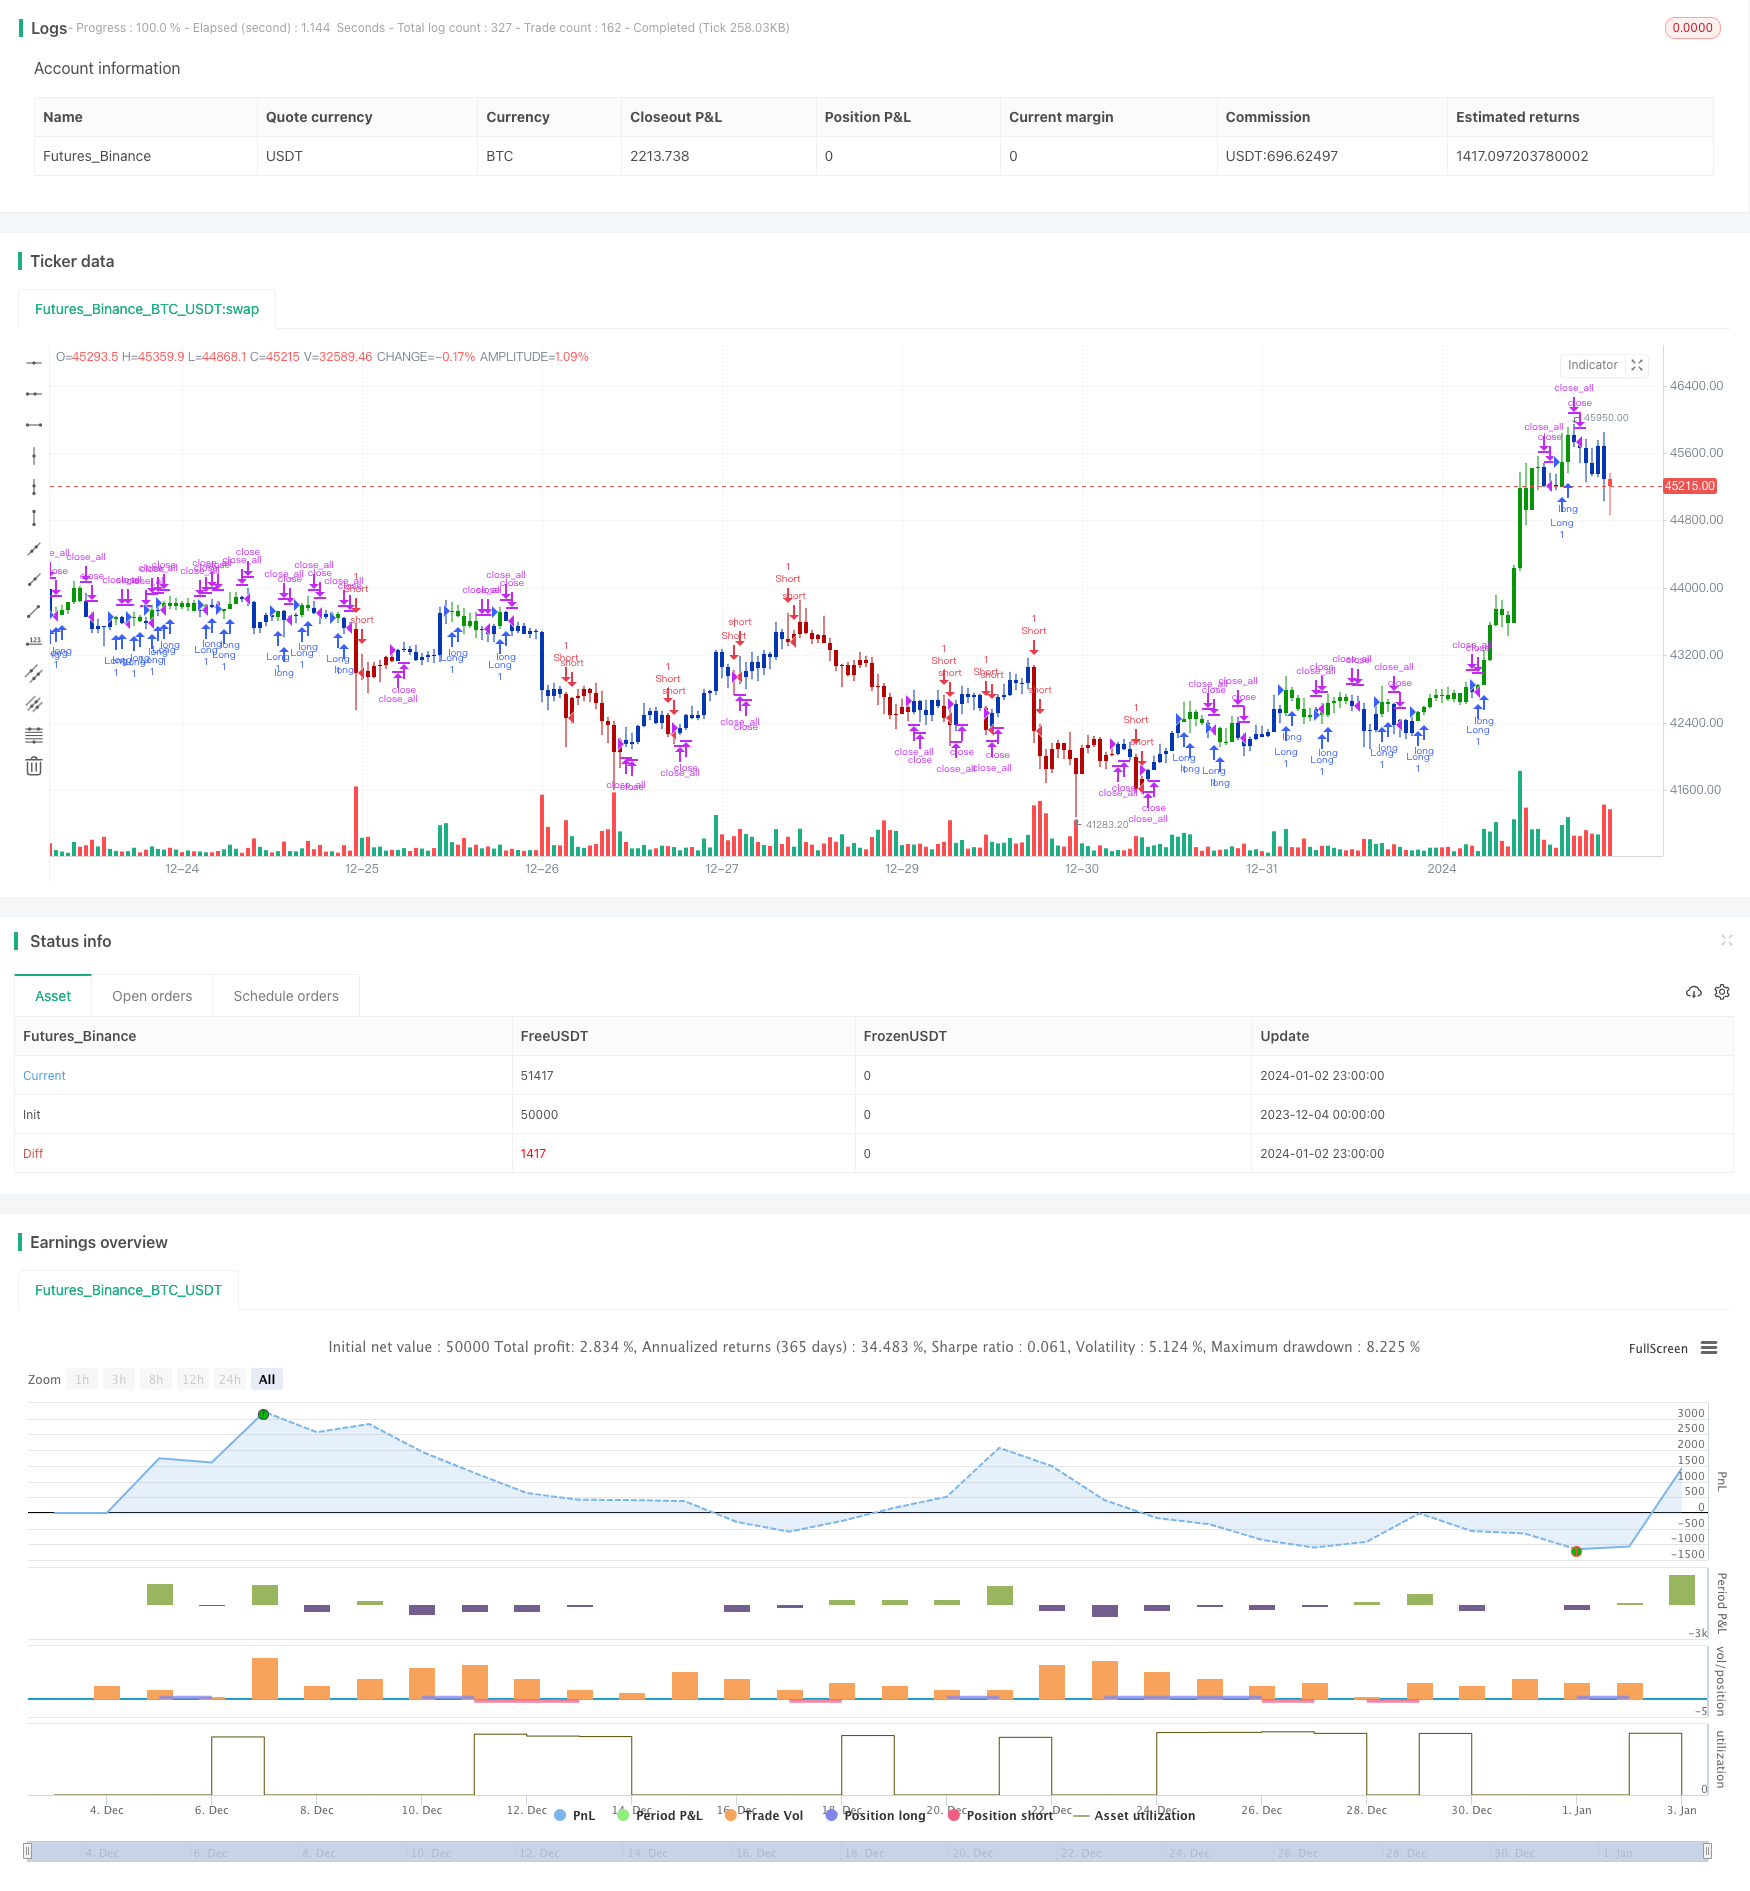
Dual Reversion CMO Quantum Strategy
Author: ChaoZhang, Date: 2024-01-04 14:35:23Tags:

Overview
This strategy is a dual reversion strategy, combining the 123 Reversion indicator and CMOWMA quantum indicator to achieve double confirmation of price reversal signals with red and green K-line visual effects.
Strategy Principle
The strategy consists of two parts:
-
123 Reversion Indicator
- Use the closing price vs previous closing price to determine price up or down
- Use Stochastic indicator’s fast line and slow line crossovers to confirm reversal signals
- Generate long or short signals when conditions are met
-
CMOWMA Quantum Indicator
- Use CMO indicator to measure price momentum
- Apply WMA weighted moving average to CMO indicator
- See long (short) when CMO is above (below) its WMA
Enter positions when both parts give signals in the same direction.
Advantages of the Strategy
- Dual confirmation mechanism can filter false breaks and reduce unnecessary positions
- Red and green K-line coloring generates visual effects for easily judging market conditions
- Combination of reversal and momentum indicators provides overall stability
- Simple parameter settings make it suitable for various products and easy to implement
Risks of the Strategy
- Prices may reverse again after initial reversal, with risk of whipsaws
- Frequent position switching generates excessive trading fees
- Improper parameter settings may cause too many or too few signals
- CMO parameters need adjustment based on product characteristics
Risks can be reduced by relaxing reversal conditions, increasing holding period, optimizing parameter combinations etc.
Optimization Directions
- Test impacts of different Stochastic parameters
- Replace/add confirmations with other indicators like MACD, KDJ etc.
- Test optimizations of different CMO and WMA lengths
- Try adding stop loss/profit taking at certain levels
- Set filters to control frequency of new positions
Summary
The strategy is robust overall with simple parameters, easy to implement, combining price reversal and momentum indicators to form an effective dual-signal filtering mechanism to eliminate false signals. K-line coloring provides intuitive visuals. Further performance improvements can come from parameter optimization and risk control.
/*backtest
start: 2023-12-04 00:00:00
end: 2024-01-03 00:00:00
period: 1h
basePeriod: 15m
exchanges: [{"eid":"Futures_Binance","currency":"BTC_USDT"}]
*/

//@version=4
////////////////////////////////////////////////////////////
//  Copyright by HPotter v1.0 19/08/2019
// This is combo strategies for get a cumulative signal.
//
// First strategy
// This System was created from the Book "How I Tripled My Money In The
// Futures Market" by Ulf Jensen, Page 183. This is reverse type of strategies.
// The strategy buys at market, if close price is higher than the previous close
// during 2 days and the meaning of 9-days Stochastic Slow Oscillator is lower than 50.
// The strategy sells at market, if close price is lower than the previous close price
// during 2 days and the meaning of 9-days Stochastic Fast Oscillator is higher than 50.
//
// Second strategy
//    This indicator plots Chandre Momentum Oscillator and its WMA on the
//    same chart. This indicator plots the absolute value of CMO.
//    The CMO is closely related to, yet unique from, other momentum oriented
//    indicators such as Relative Strength Index, Stochastic, Rate-of-Change,
//    etc. It is most closely related to Welles Wilder?s RSI, yet it differs
//    in several ways:
//    - It uses data for both up days and down days in the numerator, thereby
//        directly measuring momentum;
//    - The calculations are applied on unsmoothed data. Therefore, short-term
//        extreme movements in price are not hidden. Once calculated, smoothing
//        can be applied to the CMO, if desired;
//    - The scale is bounded between +100 and -100, thereby allowing you to clearly
//        see changes in net momentum using the 0 level. The bounded scale also allows
//        you to conveniently compare values across different securities.
//
// WARNING:
// - For purpose educate only
// - This script to change bars colors.
////////////////////////////////////////////////////////////
Reversal123(Length, KSmoothing, DLength, Level) =>
    vFast = sma(stoch(close, high, low, Length), KSmoothing)
    vSlow = sma(vFast, DLength)
    pos = 0.0
    pos := iff(close[2] < close[1] and close > close[1] and vFast < vSlow and vFast > Level, 1,
	         iff(close[2] > close[1] and close < close[1] and vFast > vSlow and vFast < Level, -1, nz(pos[1], 0)))
	pos

CMOWMA(Length, LengthWMA) =>
    pos = 0
    xMom = abs(close - close[1])
    xSMA_mom = sma(xMom, Length)
    xMomLength = close - close[Length]
    nRes = 100 * (xMomLength / (xSMA_mom * Length))
    xWMACMO = wma(nRes, LengthWMA)
    pos := iff(nRes > xWMACMO, 1,
    	   iff(nRes <= xWMACMO, -1, nz(pos[1], 0)))
    pos

strategy(title="Combo Backtest 123 Reversal & CMO & WMA", shorttitle="Combo", overlay = true)
Length = input(14, minval=1)
KSmoothing = input(1, minval=1)
DLength = input(3, minval=1)
Level = input(50, minval=1)
//-------------------------
LengthCMO = input(14, minval=1)
LengthWMA = input(13, minval=1)
reverse = input(false, title="Trade reverse")
posReversal123 = Reversal123(Length, KSmoothing, DLength, Level)
posCMOWMA = CMOWMA(LengthCMO, LengthWMA)
pos = iff(posReversal123 == 1 and posCMOWMA == 1 , 1,
	   iff(posReversal123 == -1 and posCMOWMA == -1, -1, 0))
possig = iff(reverse and pos == 1, -1,
          iff(reverse and pos == -1 , 1, pos))
if (possig == 1)
    strategy.entry("Long", strategy.long)
if (possig == -1)
    strategy.entry("Short", strategy.short)
if (possig == 0)
    strategy.close_all()
barcolor(possig == -1 ? #b50404: possig == 1 ? #079605 : #0536b3 )
- Dual Moving Average Crossover Reverse Trend Tracking Strategy
- Quant Lights Moving Average Trend Tracking Optimization Strategy
- Volume Energy Driven Strategy
- HMA Momentum Breakthrough Strategy
- ATR and Volatility Index Based Trend Tracking Strategy
- Momentum Trend Tracking Strategy
- Quant Trend Following Strategy
- Hull Filter Moving Average Strategy
- Bear Power Strategy
- Dual Moving Average Crossover Strategy
- RSI and SMA Crossover Strategy
- Bollinger Band Breakout Strategy
- Price Momentum Tracking Strategy
- Grid Trading Strategy Based on Moving Average System
- Momentum Reversal Strategy
- Crossing Moving Average Trend Tracking Strategy
- Fibonacci Golden Ratio and Relative Strength RSI Strategy
- Reversal and Center of Gravity Integrated Trading Strategy Based on Multi-strategy
- Dual and Triple Exponential Moving Average Crossover Strategy
- Bollinger Bands Breakout Swing Trading Strategy